PACS Blue Edge - Herschel
PACS Spectrometer HPDP: Observations in the BLUE EDGE spectral range
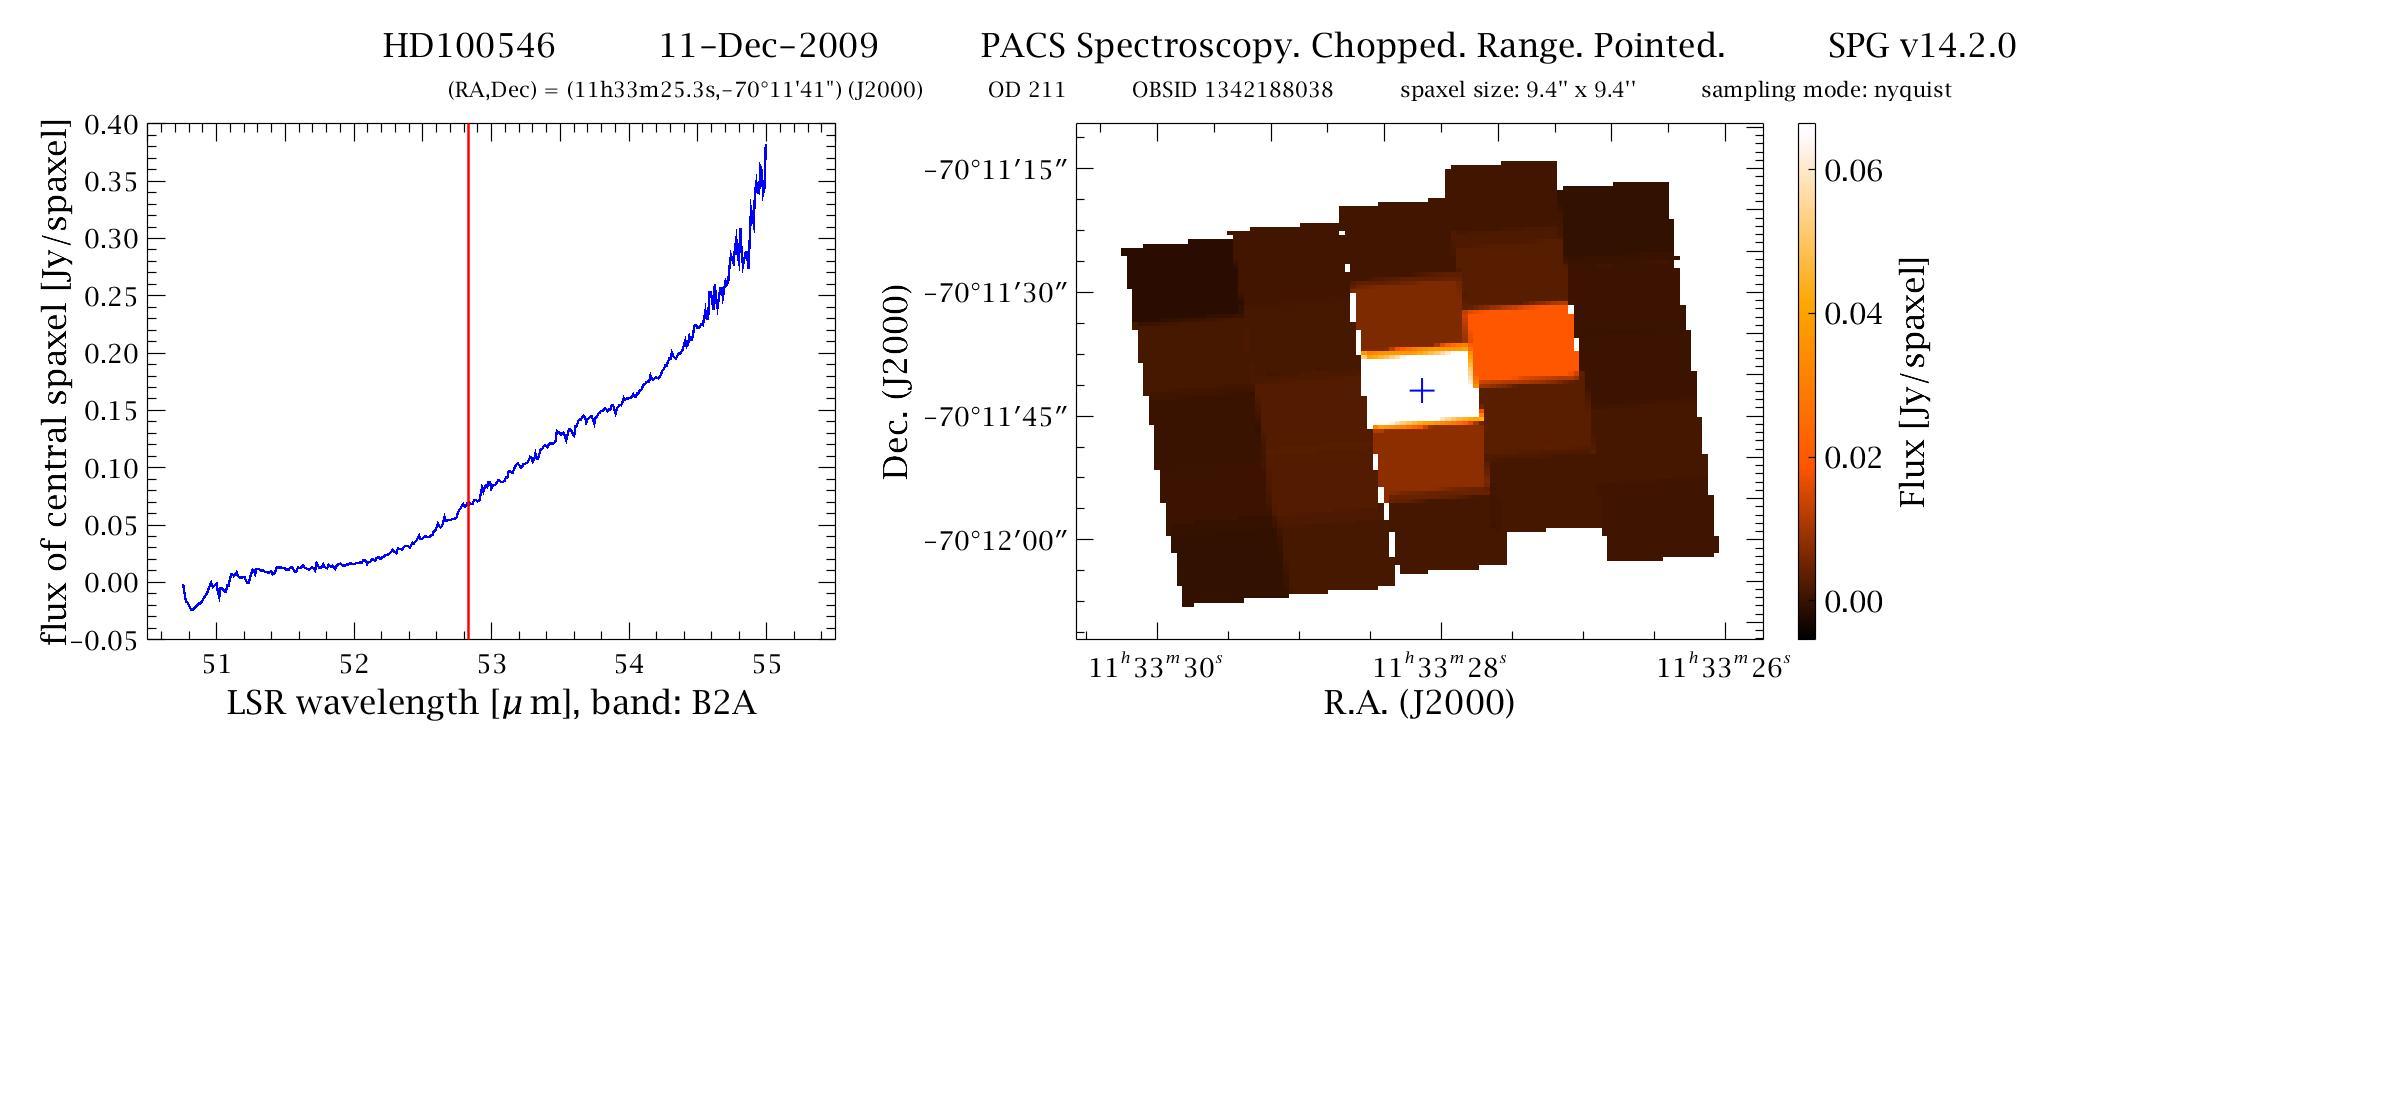
Example of a PACS spectrum in the blue edge (50-55 μm) and the associated HPDP postcard.
Introduction
PACS spectroscopy observations processed by the standard pipelines and provided via the Herschel Science Archive cover the range 55—190 μm. The range >190 μm is provided as a “Red Leak” HPDP: these data required a particular flux calibration and pipeline method, and are calibrated for the line emission only. In the blue end, the data in the range 50—55 μm cannot be flux calibrated as they lie at the edge of the blue filters bandpass where the flux calibration is completely unreliable. However, these data can be processed and provided to the users in an uncalibrated form: both on an absolute level and a relative (spaxel-to- spaxel) level. These data conform the “Blue Edge” HPDP.
Blue Edge Products
The Blue Edge HPDP entails products at Level 2 (unchopped and chop-nod observations) and Level 2.5 (only also provided for the unchopped ranges scan on-source observations). The range and organisation of the data is similar, but not the same, as that provided in an SPG download. Please read the associated Release Note for more details.
OBSERVATIONS
There are 1114 standard PACS Spectrometer observations included in this HPDP. The list is provided in the coma-separated-values file obsidList.csv. The column “mode” encodes the unchopped (mode=0), the chop-nod Line scans (mode=1) and chop-nod Range scans (mode=2). The chop-nod observations (625) include line scans (prime) fully in the blue edge, range scans (prime and parallel) fully or partly in the blue edge and B2A and B3A SEDs in that spectral range. The unchopped observations (489) include line scans (prime and parallel) fully in the blue edge, range scans (prime and parallel) and SEDs in the blue edge. Some line scans with confirmed no-detection have been eliminated from the processing.
POSTCARDS
The postcard is a jpeg file that contains the spectrum of the brightest spaxel in the field (considering the fluxes in the entire wavelength range of the cube), taken from the mosaic cube (interpolated or projected), and a wavelength-integrated image created also from the mosaic cube. The banner at the top of this page shows one example. As a general rule, there is one postcard per obsid at Level 2, and for unchopped range scans at Level 2.5 also: for these obsids, this Level 2.5 postcard is the one you will see in the HSA search results. For some observations the spectral range in the blue edge may be marginal and a postcard is not provided.
CAVEATS
A few things should be noted before using these products for science. The first is, naturally, that the data are not flux calibrated. The second is that the shape of the continuum is completely dictated by the spectral flatfielding done by the pipeline, and hence is “artificial”. The third is that since these data are of a short stretch and with quite strong curvature (which is especially due to their being uncalibrated), the spectral flatfielding could not perform as well as it does at the other wavelengths. Hence, any “ringing” seen in the spectra is an artefact of this. Finally, many spectra have poor spectral sampling in this range: this is a feature of the observation itself, not the data reduction.
---
Herschel Science Centre, Dec 2018