Bright Object Time Series - JWST NIRSpec
BOTS - Bright Object Time Series
The NIRSpec instrument is designed to reach the highest sensitivity for multi-object spectroscopy of faint targets. However, it also features a large aperture S1600A (1600 x 1600 mas2) dedicated for high contrast spectroscopy of bright sources.
It is expected that exoplanets transiting bright host stars will be preferred targets for JWST, as the final SNR will be dominated by stellar photon noise. The BOTS modes will enable NIRSpec to obtain high S/N spectra of transiting exoplanets with very low and stable slit losses. The small subarrays which have been designed to encompass the slightly curved trace of S1600A have very short exposure times, as fewer pixels to be read means shorter read out time, making the mode perfect for high cadence time series.
Available Instrument Modes
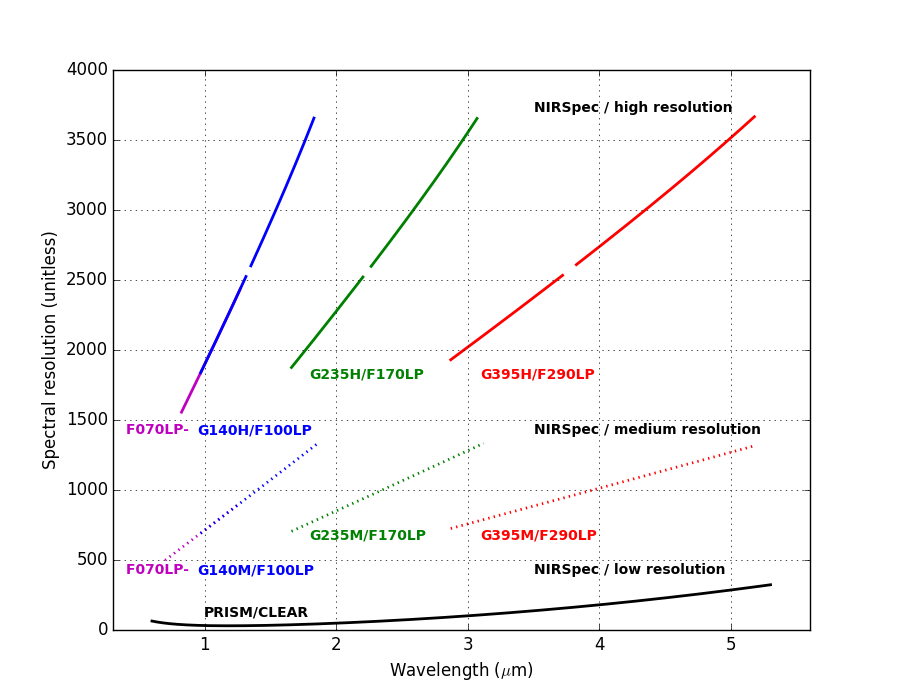
All NIRSpec dispersers are available in the BOTS mode. Their wavelength coverage and spectral resolutions when used with the S1600A aperture and default subarrays are listed in the table below and depicted in the figure to the right. The default subarrays are chosen to be the smallest subarrays which encompasses the entire spectra while leaving enough pixels to determine the background as well. The projection of the S1600A aperture onto the detector plane 16x16 pixels, so a subarray with 32 pixels in spatial direction can catch the entire trace of the spectrum as well as pixels outside of the aperture.
The spectral resolution curves in the figure also show the wavelengths which are lost due to the gap between the two detectors in the focal plane when using the high resolution gratings. All the gratings have fairly uniform dispersions, resulting in an increase of spectral resolution towards longer wavelengths.
The J magnitude limits listed in the table indicate a conservative estimate for the brightest 3600 K star which can be observed without saturating any pixels in the spectrum. Brighter targets can be observed, but at the risk of loosing wavelength coverage for those pixels which will saturate already in the first group. The magnitude limits depend highly on spectral type and subarray. Full brightness curves as a function of effective temperature can be found here.
|
||||||||||||||||||||||||||||||||||||||||||||||||||||||
| *J magnitude limits are derived for a M-type star with effective temperature 3600 K. These limits are strictly meant as a guideline as magnitude limits depend on the spectral type and subarray. These estimates are conservative as they only go to 80% of the full well of the detector (or rather, the range for which linearity corrections hold up, minus the zero level) and assumes that the PSF is always centered on a pixel (see more below). |
Detector read out
|
|
|
|
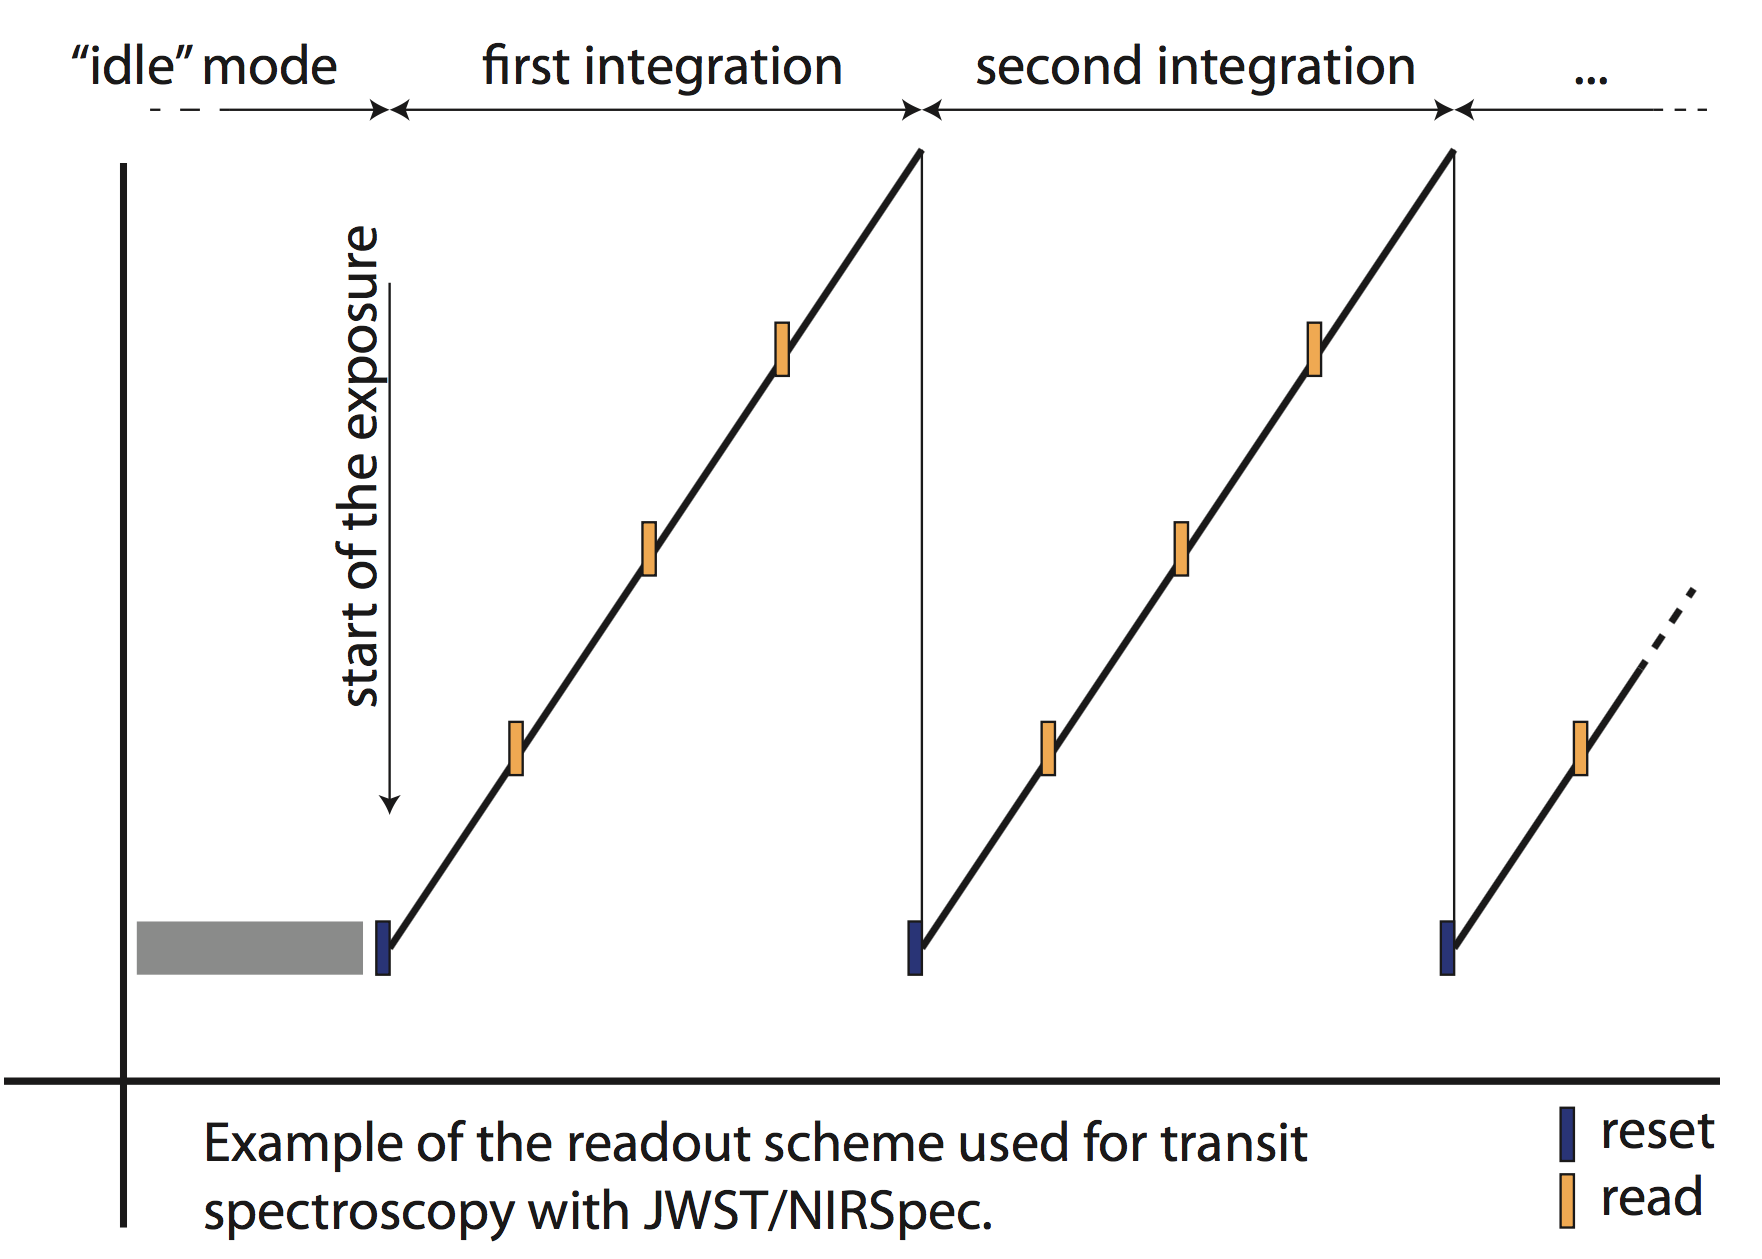
Example of the NRSRAPID readout pattern, with one frame per group. From Ferruit et al. 2014. |
To accommodate observations of bright sources the BOTS mode couples small subarrays with gain=2 e-/ADU, which ensures that the saturation limit is set by the physical full well of the detector, opposed to the nominal gain=1 e-/ADU which is limited by digital saturation in the ADC.
An exposure consists of consecutive integrations, separated by a reset of the detector where the pixels are reset individually at the same cadence at which they are read out. Resetting the detector therefore takes the same amount of time as reading a frame of data. The maximum number of integrations per exposure is 65,535. BOTS mode users will specify exposure times by defining the subarray, readout pattern (NRSRAPID or NRS), number of groups per integration (integration time), and the number of integrations within the observation.
NRSRAPID
The NRSRAPID read out pattern, where each group consists of one frame, i.e. no on-board frame averaging is used. The figure to the right outlines how the up-the-ramp read out works, with a specific number of groups (reads) per integration - in this case 3 groups per integration.
NRS
In the NRS scheme 4 frames are averaged into a single group. BOTS mode users will specify exposure times by defining the subarray, readout pattern, number of groups in each integration (integration time), and the number of integrations within the observation.
Subarrays
The subarrays available to BOTS observations are listed below. The maximum duration of an exposure, texp,max, is given by the number of groups per integration, frame time (tframe) and maximum number of integrations per exposure (65535). The maximum durations listed here are computed for the shortest integrations possible (reset-read) with a NRSRAPID readout pattern.
Name |
Size [px] |
tframe [s] |
texp,max [hr] |
Disperser |
Wavelength truncation |
| SUB2048 | 2048x32 | 0.9016 | 32.8 | All | None |
| SUB1024A | 1024x32 | 0.4510 | 16.4 | All | Long wavelengths missing for the medium resolution gratings, central part for high resolution |
| SUB1024B | 1024x32 | 0.4510 | 16.4 | All | Short wavelengths missing for the medium resolution gratings, extremes for high resolution |
| SUB512 | 512x32 | 0.2257 | 8.22 | PRISM | None (for PRISM) |
| SUB512S | 512x16 | 0.1436 | 5.23 | PRISM | No pixels outside of aperture trace, limited 1/f detector noise correction |
|
|
|
| The NIRSpec PSF at 2 micron sampled at the center (left) and at the corner (right) of the detector pixels. |

Point spread function - PSF
Because NIRSpec spectra are slightly curved on the detector, the sampling of the PSF by the detector pixels varies as a function of wavelength, position, and the disperser used. The light distribution for the NIRSpec PSF at 2 micron is shown in the images to the right, both for the PSF centered on one pixel and with the PSF at the corner between four pixels.
time line for observations
- figure from AandA paper
- Is this important or is the page fine without this?