JWST - Exoplanet Transit Spectroscopy - JWST NIRSpec
Exoplanet Transit Spectroscopy with NIRSpecThe NIRSpec instrument is designed to reach the highest sensitivity for multi-object spectroscopy of faint targets. However, it also features a large aperture (1600 x 1600 mas2) dedicated for high contrast spectroscopy of bright sources. This aperture will enable NIRSpec to obtain high S/N spectra of transiting exoplanets with very low and stable slit losses.
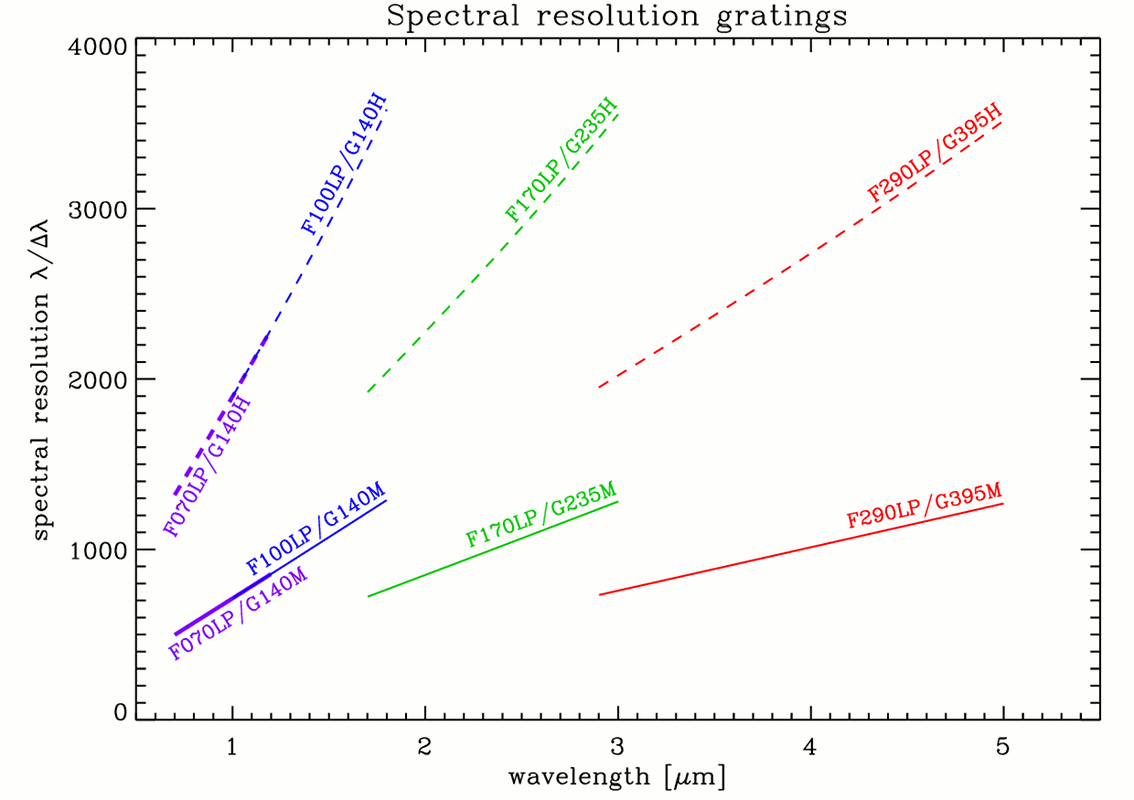
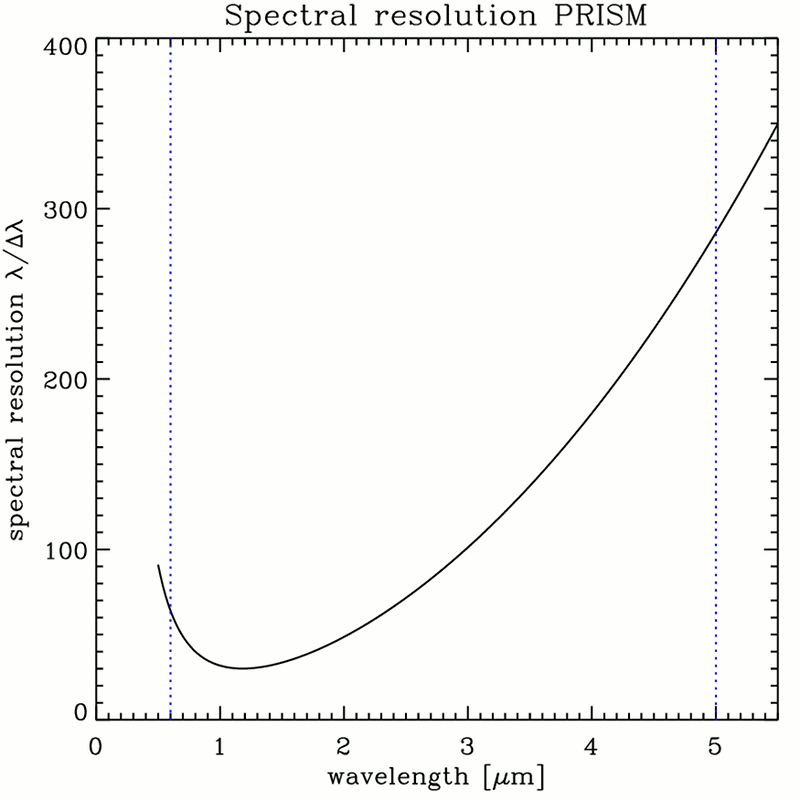
Available Instrument Modes and Brightness LimitsAll NIRSpec dispersers are available for exoplanet transit/eclipse spectroscopy. The modes, their wavelength coverage, and their spectral resolution are listed in the table below.
Due to the large collecting area of JWST (~25 m2) and the high throughput / photon conversion efficiency (PCE) of NIRSpec, there are limits on how bright a source can be before it saturates the NIRSpec detectors too early, making the data unusable. We have calculated the limiting fluxes for all NIRSpec dispersers taking into account the (wavelength dependent) point spread function (PSF), its sampling by the detector pixels, the system (OTE + NIRSpec) PCE, the spectral resolution, and the read times for different detector subarrays.
 The NIRSpec PSF at 2 micron sampled at the center (left) and at the corner (right) of the detector pixels. Because NIRSpec spectra are slightly curved on the detector, the sampling of the PSF by the detector pixels varies as a function of wavelength, position, and the disperser used. The light distribution for the NIRSpec PSF at 2 micron is shown in the images to the right, both for the PSF centered on one pixel and with the PSF at the corner between pixels.
The used PCE curves include the estimated telescope transmission (four gold coated mirrors) and the NIRSpec PCE (worst case) for a point source centered in the large aperture (slit and diffraction losses included) at beginning of live (BOL) with a 10% system margin, i.e. they are conservative and the actual PCE might be higher. Therefore, the derived limiting fluxes have been decreased by 15% in order to make sure that those sources can be observed with NIRSpec.
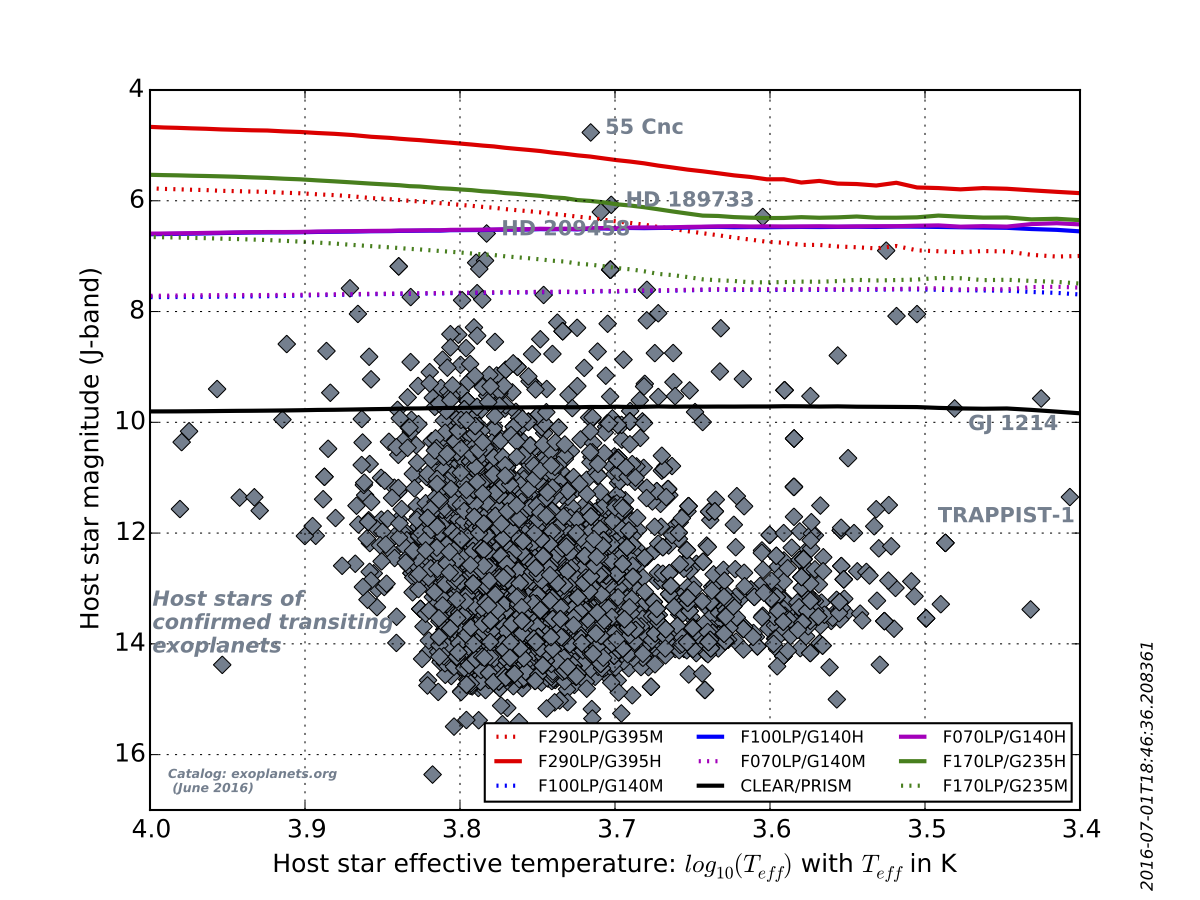
Based on the limiting fluxes we have calculated the magnitude limits for a range of host star temperatures/spectral types based on the Phoenix models computed by France Allard and collaborators and that are also used by the STScI JWST Exposure Time Calculator. We used the spectra of the models with solar metallicity and 4 ≤ log g ≤ 5 (depending on Teff) and the resulting magnitude limits in J-band are shown in the plots below.
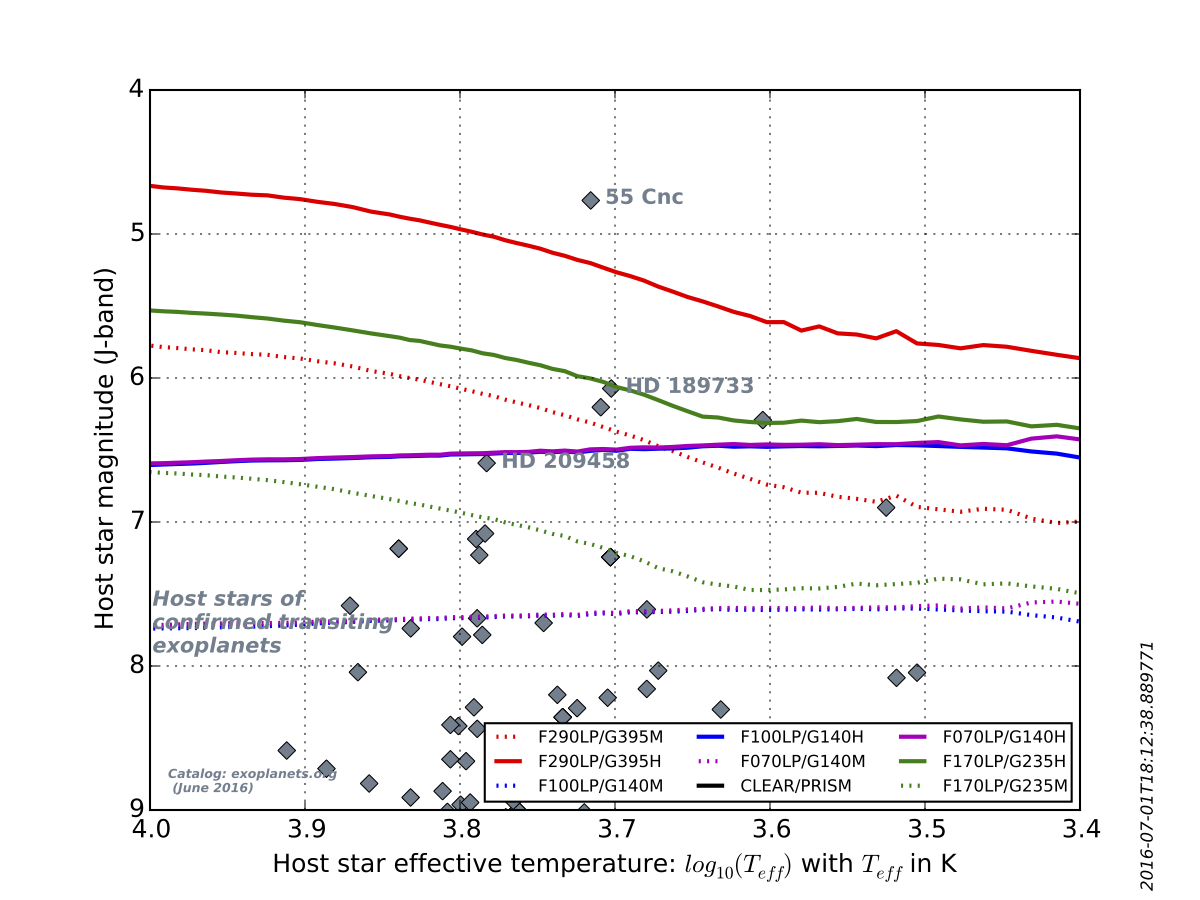
The J-band limiting magnitudes for the different NIRSpec modes as a function of host star temperature. The colored dashed lines are for the high resolution gratings, the colored solid lines for the medium resolution gratings, and the solid black line for the prism. Sources below the lines can be observed in the full wavelength range of the given mode as specified in the table above. The black symbols denote the host stars of known transiting exoplanets (data taken from exoplanets.org on 7 June 2013). The plot on the right shows the magnitude limits for the gratings in more detail. The difference in shape between the curves is due to the combined effect of i) using J-band magnitudes as the reference, ii) the spectral resolution of NIRSpec, and iii) the spectral energy distribution of the stars.
The magnitude limits have been computed using an average detector full well of 77.000 electrons and detector sub-arrays of 2048x32 pixels for the gratings and 512x32 pixels for the prism, and assuming that there must be one unsaturated read following the detector reset. Furthermore, we assumed that the PSF is centered on a pixel regardless of the actual position/sampling along the spectrum. Therefore, the given magnitude limits are considered conservative, i.e. they are on the faint side.
The sub-array sizes given above provide full wavelength coverage for all the modes. If only partial wavelength coverage is required, smaller sub-arrays can be used, yielding somewhat brighter limits in return. However, as of today, there are very few systems with transiting exoplantes that are too bright to be observed with the NIRSpec gratings.
|