Slew Survey XMMSL2 Catalogue - XMM-Newton
The XMM-Newton slew survey Source Catalogue:XMMSL2
User Guide to the Catalogue
| Release 2.0 | 14th March 2017 | Associated with Catalogue version 2.0 |
This User Guide refers directly to the FITS format version of the catalogue. Most of the content is also applicable to the database-served format (from XSA), but there are some aspects that are not applicable to the latter. Conversely, there are aspects of the database implementations that are not covered by this User Guide, but by the Help information provided from the database user interfaces.
The User Guide provides a detailed account of the production and contents of the catalogue.
Contents
- Summary
- Version
- 1. Introduction
- 2. Initial Processing
- 3. Processing
- 4. Combination of individual band surveys
- 5. Spurious flagging
- 6. Identifications
- 7. Astrometry
- 8. Reliability
- 9. Column Descriptions
- 10. Detection Limits
- 11. Flux conversion
- 12. Differences between XMMSL2 and XMMSL1
- 13. References
Summary
XMMSL2 is the second catalogue of X-ray sources found in slew data taken from the European Space Agency's (ESA) XMM-Newton observatory, and has been constructed by members of the XMM SOC and the EPIC consortium on behalf of ESA. This release uses results of work which has been carried out within the framework of the EXTraS project ("Exploring the X-ray variable and Transient Sky"), funded from the EU's Seventh Framework Programme under grant agreement no.607452.
Version 2.0
This is the first release of XMMSL2 which contains data taken between revolutions 314 and 2758. The previous catalogue was called XMMSL1_Delta6 and contained slews up to revolution 2441.
1. Introduction
XMMSL2 has been generated from 2114 slews, executed between 2001-08-26 and 2014-12-31, revolutions 314 to 2758. Not all slews made in this period have been used; slews with particularly high background throughout the slew or which gave processing problems have been rejected. A description of slew selection and initial processing is given in section 2
| Band | Energy (keV) | Description |
|---|---|---|
| 8 | 0.2-12 | Total |
| 7 | 2-12 | Hard |
| 6 | 0.2-2 | Soft |
to form three distinct surveys which have been subsequently combined to form one catalogue.
The release includes two FITS files. A full catalogue (xmmsl2_total.fits.gz), containing 72352 detections found with a likelihood of DET_ML>8 and a "clean" catalogue (xmmsl2_clean.fits.gz) where all known bad sources have been removed and where the detection limit has been raised to DET_ML>10.5 in general and DET_ML>15.5 for sources found in images with a higher than usual background. Efforts have been made to identify spurious detections and 3017 have been flagged as such in the full catalogue.
There is an overlap between the slew paths, which has led to some sources being observed upto 15 times with 4924 sources being observed two or more times. The full catalogue has a significant expected spurious fraction, determined from cross-correlations with other catalogues. A cleaner subset has been created, with sources of likelihood DET_ML>15.5 (or DET_ML>10.5, for the soft and total energy bands, taken from images where the background count rate is <=3c/s) and where there is a minimum of 4 background subtracted counts in at least one of the bands. The number of sources and the sky area for the two catalogues is:
Full catalogue: sky area=65000 deg2
| Band | NSRC |
|---|---|
| 8 | 55969 |
| 7 | 13927 |
| 6 | 36189 |
| ALL | 72352 |
Clean catalogue: for band 7, sky area=65000 deg2; for bands 6 and 8, the sky area contains 44000 deg2 of low-background images where sources are accepted with det_ml>10.5 and 21000 deg2 of higher background images where sources are accepted with det_ml>15.5
| Band | NSRC |
|---|---|
| 8 | 26390 |
| 7 | 1934 |
| 6 | 22337 |
| ALL | 29393 |
The median flux is 3.0E-12 ergs/s/cm2 in the total band, 1.2E-12 in the soft band and 9.3E-12 in the hard band in the clean catalogue. All sources have been cross-correlated with existing astronomical catalogues and an identification assigned for each source where found. These have been included together with the source category, e.g. Galaxy, flare star etc., as columns in the catalogue together with any ROSAT All Sky Survey (RASS) counterpart. The quoted positions in the slew catalogue have a 1 sigma error of ~8 arcseconds which for point sources is dominated by the accuracy of the attitude reconstruction during the slewing manoeuvers. The statistical position error quoted in the catalogue has a median of ~4.2 arcseconds (1 image pixel) for non-extended CLEAN catalogue sources. This is usually much larger for extended sources.
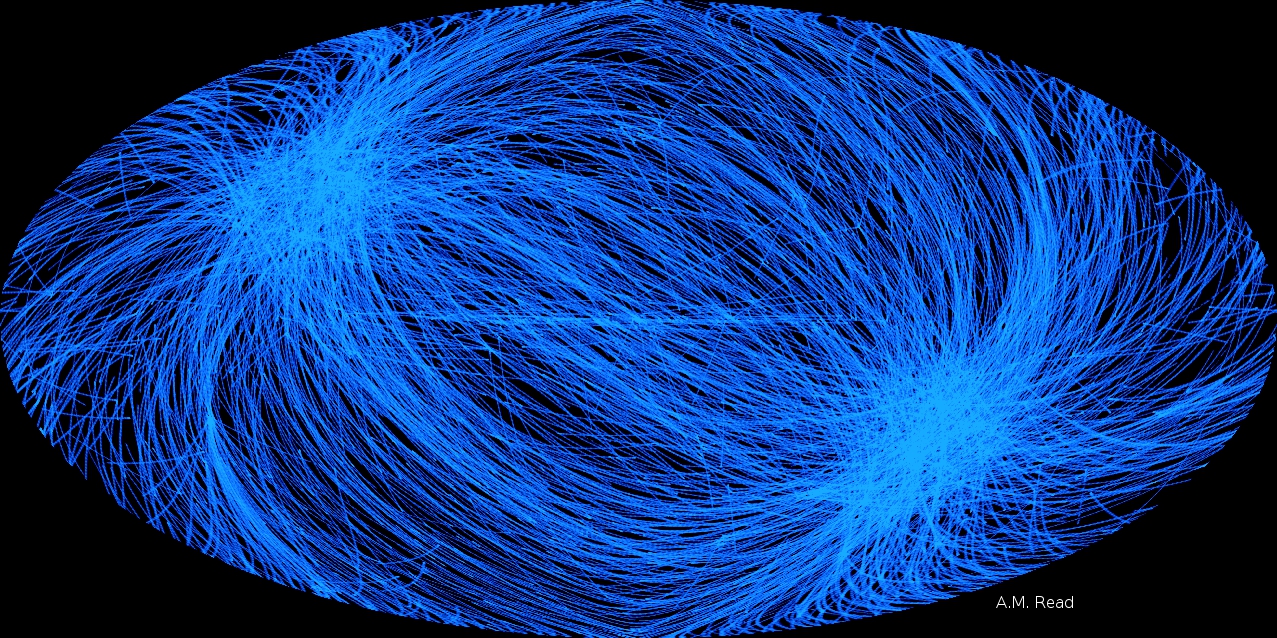
After correcting for overlaps between slews, 84% of the sky has now been covered. The slew paths pass predominantly through the ecliptic poles as can be seen in the plot below, which shows all the slews contained in this catalogue release.
Below are shown the positions of the slew sources in Galactic coordinates. They have been logarithmically scaled with strength and colour-coded so that hard sources are blue and very soft sources, light-red.
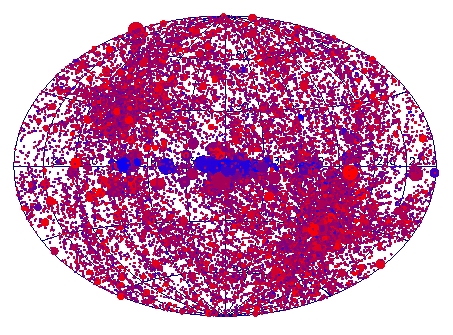
Clean catalogue slew sources in Galactic coordinates. Blue circles indicate hard sources.
2. Initial Processing
The XMM-Newton Slew Data Files (SDFs) for EPIC-pn were processed using the odfingest and epproc packages of the public xmmsas-15. For diagnostic reasons a few parameters were set to non-default values (e.g. keeping also events below 150 eV). For the Slew Survey catalogue only EPIC-pn exposures performed in Full Frame (FF), Extended Full Frame (eFF), and Large Window (LW) modes were selected, i.e. modes where all 12 CCDs are integrating (in LW mode only half of each CCD). The corresponding cycle times are 73.36 ms, 199.19 ms, and 47.66 ms, which converts to a scanned distance of 6.6 arcseconds, 17.9 arcseconds, and 4.3 arcseconds per cycle time, respectively. In the Small Window mode only the central CCD is operated and a window of 64 x 64 pixels is read out, i.e. only about 1/3 of a CCD. In the fast modes, Timing and Burst, only 1-dimensional spatial information for the central CCD is available and thus these three modes are not very well suited for source detection.
3. Processing
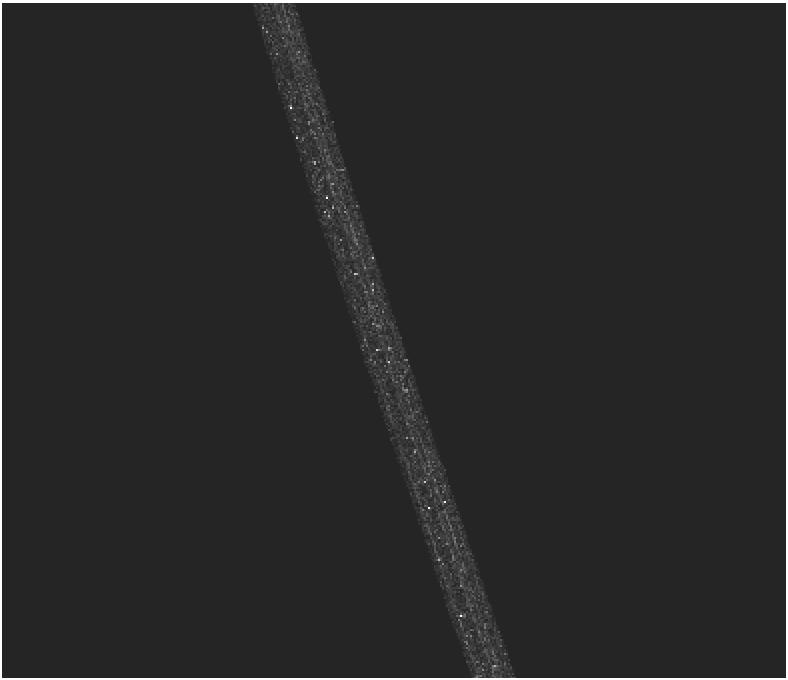
Events are recorded initially in RAW or detector coordinates and have to be transformed, using the satellite attitude history, into sky coordinates. The tangential plane geometry commonly used to define a coordinate grid for flat images is only valid for distances of 1-2 degrees from a reference position, usually placed at the centre of the image. To avoid this limitation, slew datasets are divided into roughly one square degree event files, attitude corrected and then converted into images.
An overlap of about 20% has been allowed between subimages to avoid problems with sources which lie at the edge of a subimage.
Source searching uses a semi-standard
'eboxdetect (local) + emask + esplinemap + eboxdetect (map) + emldetect'
method, tuned to about zero background, and performed on a single image containing just the single events (pattern=0) in the 0.2-0.5 keV band, plus single and double events (pattern=0-4) in the 0.5-12.0 keV band.
4. Combination of individual band surveys
Detections in the three energy bands have been combined using a match radius of 30 arcseconds to identify sources detected in more than one band. The match radius is approximately 4 sigma and is reasonable for point sources because of the great scarcity of sources (1 detection per square degree on average) at the flux levels probed by the slew survey.
5. Spurious flagging
Spurious detections are produced due to systematic effects with the instruments and detection software. These sources have been screened and flagged ('t' for 'true' or 'f' for 'false') in the different categories described below. When a source is flagged true, the FLAG_COMMENT column gives a more detailed explanation of the problem for each particular source.
VER_INEXT:
This quality flag is used to ensure that only one source is quoted for extended objects; that with the highest det_ml. Two different cases have been found: - Large extended sources (mainly SNR) that often result in multiple detections of the same object. These have been identified by searching for images with a large number of sources - Other spurious sources (mainly due to Cluster of Galaxies) appear because the technique used for merging detections in the different energy bands is optimal for point-like sources. This consists of considering the same source if their centres lie within 30 arcsec of each other, but this offset has to be bigger for extended sources. This flag has been set to 't' for 1481 detections.
VER_HALO:
A halo of false detections is often seen around bright slew sources due to the imperfect modelling of the PSF (a problem also found in the creation of the 3XMM Serendipitious Source Catalogue). Due to the reduced exposure time in slew observations this is only important for very bright sources, rate>>10c/s. For flagging this category of spurious, the different sources detected in the same image and containing a very bright source have been inspected. If their centres lie within 30 arcsec but corresponding to the same object, the one with highest det_ml is taken as the non-spurious detection and the rest have been flagged 't'. 1248 detections have this flag set.
VER_HIGHBGND:
One of the characteristics of slew exposures is their low background (of average ~0.1 c/arcmin2). Solar flares may be present however, and can generate high background sub-images which aren't above the threshold used to exclude them. Sources which fall in these patches of high background have been identified and flagged in this category by looking for images with a large number of sources (without being included in the VER_INEXT category of spurious sources explained above). It has been checked that no other bright off-axis source could generate the detections. There are 189 detections with this flag set to 't'.
VER_NREDG:
In the previous catalogue some sources were detected lying on the border of consecutive images of the same slew observation. This no longer occurs and this flag has not been used in XMMSL2.
VER_PSUSP:
This quality flag is related to the astrometry performance and arises after a careful visual examination of the RAF files. The attitude reconstruction of some slews appears to be "turbulent" rather than smooth, so source positions lying in these poorly attitude reconstructed regions are likely to be inaccurate. 1014 detections have this warning flag set to 't'
VER_FALSE:
This flag is related to spurious detections not included in the other flags. Examples are cosmic rays, out of field-of-view reflections from SCO X-1 or other bright sources, bad attitude files or bad exposure time. 99 detections have this flag set to 't'.
VER_OPTLOAD:
This is a warning flag which says that most of the events associated with this source have been removed by filtering. This can be a good indication that the detection has been spuriously created by optical photons. It can also indicate that the source extraction region includes an image defect (such as a bad pixel) or that the source is extremely soft, e.g. a white dwarf. This flag should be used in conjunction with knowledge of the optical magnitude of the object.
6. Identifications
All sources detected in the survey have been correlated with different catalogues in order to identify the XMM-Newton slew sources with previously known objects.
The search for counterparts uses the following catalogues and databases in the listed order.
| Catalogue | Search Radius (arcsec) |
|---|---|
| SIMBAD | 12 |
| Abell galaxy clusters | 180 |
| Zwicky galaxy clusters | 180 |
| Einstein IPC | 120 |
| EXOSAT slew | 45 |
| Rosat all-sky survey | 90 |
| Rosat pointed PSPC observations (2RXP) | 30 |
| Rosat pointed HRI observations (1RXH) | 30 |
| Integral source catalogue (IGR) | 60 |
| XMM-Newton serendipitous survey (3XMM) | 12 |
| NED | 12 |
Counterparts have been allocated depending on where they are found, with identifications in SIMBAD given the greatest precedence and NED the least. The one exception is sources found in the Abell or Zwicky catalogues which are extended in the slew catalogue (EXT_B6>0.5 or EXT_B7>0.5 or EXT_B8>0.5). These have been assigned the Abell or Zwicky counterpart name rather than that given in SIMBAD.
The cross-correlation with the ROSAT all sky survey was split into two. Bright source catalogue (BSC) sources have been matched to a radius of 1 arcminute and the faint source catalogue (FSC) sources to 1.5 arcminutes. Of the clean catalogue slew sources, 59% have a ROSAT counterpart. This increases to 69% if we consider only sources with a soft band (B6) detection.
Results from the identification process appear in the final catalogue in the columns:
IDENT: name of the source
ALTIDENT: alternative name of the source
ID_DIST: distance in arcseconds between the slew source and the identification.
ID_CATEGORY: type of the identified source that, when existing, has been extracted from the catalogues (it is not very homogeneous because type convention is very variable between and sometimes within catalogues)
RASSNAME: the closest RASS match
RASSDIST: distance in arcseconds to the closest RASS match.
Given the statistical nature of the identification process these should be regarded as suggested rather than definitive counterparts.
7. Astrometry
The attitude information of the XMM-Newton satellite is provided by the Attitude and Orbit Control Subsystem (AOCS). A star tracker co-aligned with the telescopes allows up to a maximum of five stars to be continuously tracked giving accurate star position data every 0.5 seconds, which operates in addition to the Sun sensor that provides a precise Sun-line determination. Such information is processed resulting in an absolute accuracy of the reconstructed astrometry of typically 1 arcsecond during pointed observations. For the open-loop slews, large slews outside the star-tracker field of view of 3 x 4 degrees, the on-board software generates a three axis momentum reference profile and a two-axis (roll and pitch) Sun-sensor profile, both based on the ground slew telecommanding. During slew manoeuvring a momentum correction is superimposed onto the reference momentum profile and, as there are no absolute measurements for the yaw axis, a residual yaw attitude error exists at the end of each slew that may be corrected in the final closed-loop slew. To process slew data, attitude information is taken from a Raw Attitude File (RAF) which stores attitude points every 40-60 seconds. The times quoted in the RAF are offset from spacecraft time by 0.75 seconds, which has to be corrected in the software, otherwise a 1 arcminute offset in source positions is seen along the slew direction. Initially the correction was performed in the slew specific software but from SAS 7.0 has been included in the general SAS software. The SAS astrometry software interpolates between the rather sparse RAF points using a curve fit. Several RAFs have been found to contain one or more bad attitude points which are sufficient to totally corrupt the attitude solution over a considerable section of the slew. In other slews a part or all of the attitude seems to be turbulent rather than smooth. It is not known why this occurs and no attempt to fix it has been made. Sources affected by these attitude problems have a position suspect (VER_PSUSP) flag set to true. The error introduced in the source positions can be of the order of 1 arcminute.
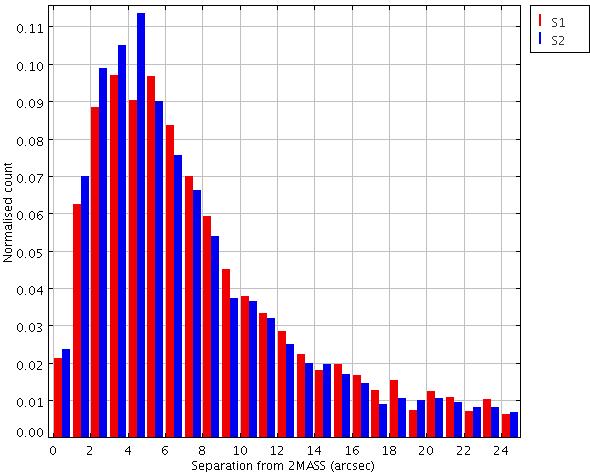
A sample of 16281 non-extended sources from the clean catalogue with matches in the ROSAT all-sky survey have been cross-correlated with the WISE catalogue (Cutri et al. 2012). A histogram of the positional offsets is shown below. The distribution has a 1-sigma offset of 7.1 arcseconds and 90% of the matches lie within 11.3 arcseconds.
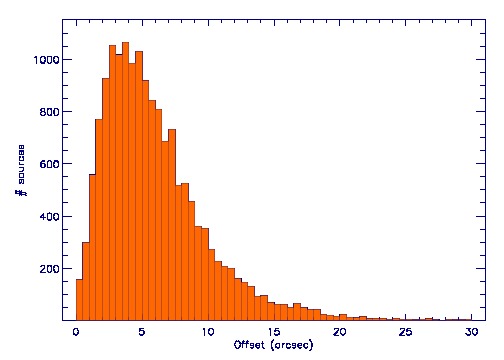
A histogram of the offsets between point sources with a RASS counterpart in the clean catalogue and the closest WISE survey counterpart
8. Reliability
By comparing positions of a well constructed sample of reliable slew sources with the WISE catalogue it was found that 90% have a WISE match within 11.3". We can use this to gauge the reliability of other sub-samples of sources. In the table below we look at the effect of varying detection likelihood on the percentage of sources which is found in WISE within the 11.3" radius. Only point sources (extension parameter < 1.0), which are not flagged as BAD, and where the number of counts > 4 in at least one of the bands, have been used.
| Band | MIN_DET_ML | Nsample | Percentage |
|---|---|---|---|
| Total | |||
| 8 | 10.5/15.5 | 24993 | 83.3 |
| 8 | 15.5 | 17155 | 89.7 |
| Hard | |||
| 7 | 10.5/15.5 | 2975 | 68.7 |
| 7 | 15.5 | 1601 | 81.4 |
| Soft | |||
| 6 | 10.5/15.5 | 21197 | 86.6 |
| 6 | 15.5 | 17321 | 89.8 |
| ALL bands | |||
| 6,7 or 8 | 10.5/15.5 | 28285 | 81.2 |
| 6,7 or 8 | 12.0/15.5 | 25668 | 84.0 |
| 6,7 or 8 | 13.0/15.5 | 24036 | 85.5 |
| 6,7 or 8 | 14.0/15.5 | 22512 | 86.8 |
| 6,7 or 8 | 15.5 | 20393 | 88.3 |
MIN_DET_ML represents the minimum detection likelihood for low background images (first number) and high background images (second number) or for both if just one number, where a low background image is defined as having IMAGE_BG_RATE<=3.0. A full assessment of the spurious content of the catalogue has not yet been made. The table above gives an indication of the reliability of samples based on different cuts in the detection likelihood compared with a sample with a ROSAT counterpart which is assumed to be free of spurious sources. The statistical error in the XMM-Newton slew position has been ignored in the matching process and so it is natural that the lower significance sources should have a lower match rate. Nevertheless, the hard band (band 7) lower significance sources have a particularly low match rate with WISE within 11.3" and for this reason the CLEAN sample has been re-defined to exclude sources with DET_ML_B7<15.5 which are not positively detected in the total or soft bands.
9. Column Descriptions
UNIQUE_SRCNAME
This is the official name for sources detected in the XMM-Newton slew survey. It starts with the prefix, XMMSL2 (evolving from XMMSL1, the IAU registered designator), and then encodes the J2000 sky position, e.g. XMMSL2 J010537.6+364858. The name is assigned in two passes. When the three independent energy band source lists are combined to form one catalogue the source name is set using the position in the band where the DET_ML likelihood is the highest. A second pass is then performed such that sources which have been observed in more than one slew are given the same name. Again, priority is given depending on the detection likelihood. Note that the combination of UNIQUE_SRCNAME and observation number (OBSID) is unique. Detections are deemed to be from the same source if their centres lie within 30 arcseconds of each other. Note that the statistical position error (RADEC_ERR) calculated by the source search software is not used in this calculation. This is because the systematic error on the slew attitude reconstruction dominates the error budget in many cases. Given the scarcity of slew sources on the sky, 30" was found to be a reasonably robust match radius for point sources. It is not so good for extended sources and the catalogue may contain multiple detections of the same extended source with different names.
OBSID
This is the observation number assigned to the slew by the satellite scheduling system. Slew observations always begin with a 9 to distinguish them from pointed observations, followed by a 4 digit satellite orbit number and a 5 digit slew designator, e.g. 9031400004, refers to the second slew of revolution 314.
SOURCENUM
This is a number which uniquely identifies each detection in an observation.
RA, DEC
The J2000 right ascension and declination of the source.
Units: Degrees
In the event of a detection in more than one energy band, the coordinates are taken from the band with the highest detection likelihood.
RADEC_ERR
The statistical error on the source position as returned by the source detection software.
Units: arcseconds
LII, BII
The galactic coordinates of the source.
Units: Degrees
HR1
The hardness ratio, defined as
HR1 = (rate_b7-rate_b6)/(rate_b7+rate_b6)
where rate_b7 is the hard band count rate and rate_b6 is the soft band count rate. This has been calculated for the 1936 sources which have a positive detection in both bands (see hratios.ps)
HR1_ERR
Error on the hardness ratio calculated as:
sqrt(rate_b7_err*rate_b7_err + rate_b6_err*rate_b6_err) /(rate_b7+rate_b6)
where rate_b7_err and rate_b6_err are the errors on the hard and soft band count rates respectively.
DATE_OBS, DATE_END
The start and end times of the slew containing this source.
Format is: Year-Month-dayThours:minutes:seconds, e.g. 2004-07-12T14:23:16
SCTS_B8
The number of background subtracted counts, in the total energy band (0.2-12 keV).
Units: counts
This number has been corrected for photons scattered outside the source region due to the Point Spread Function (PSF).
SCTS_B8_ERR
Statistical 1 sigma error on the total band source counts.
SCTS_B7
The number of background subtracted counts, in the hard energy band (2-12 keV), corrected for the PSF. Units: counts
SCTS_B7_ERR
Statistical 1 sigma error on the hard band source counts.
SCTS_B6
The number of background subtracted counts, in the soft energy band (0.2-2 keV), corrected for the PSF. Units: counts
SCTS_B6_ERR
Statistical 1 sigma error on the soft band source counts.
X_IMA_B8, Y_IMA_B8
The X and Y position of the source in the total band image in image pixels.
Units: 4.1"x4.1" pixels
X_IMA_B7, Y_IMA_B7
The X and Y position of the source in the hard band image in image pixels.
Units: 4.1"x4.1" pixels
X_IMA_B6, Y_IMA_B6
The X and Y position of the source in the soft band image in image pixels.
Units: 4.1"x4.1" pixels
EXT_B8
The spatial extension of the source in the total energy band.
Units: 4.1"x4.1" image pixels
This measures the deviation from a point source of the spatial distribution of the source counts. It is defined as the sigma of a Gaussian which would need to be convolved with the point spread function (PSF) to produce the observed counts distribution. The software (emldetect) fits sources out to a maximum extent of 20 pixels.
EXT_B8_ERR
Statistical one sigma error on the total band extension parameter.
EXT_B7
Spatial extension of the source in the hard energy band. Units: 4.1"x4.1" image pixels
EXT_B7_ERR
Statistical one sigma error on the hard band extension parameter.
EXT_B6
Spatial extension of the source in the soft energy band.
Units: 4.1"x4.1" image pixels
EXT_B6_ERR
Statistical one sigma error on the soft band extension parameter.
DET_ML_B8
The detection likelihood in the total (0.2-12 keV) energy band.
DET_ML_B7
The detection likelihood in the hard (2-12 keV) energy band.
DET_ML_B6
The detection likelihood in the soft (0.2-2 keV) energy band.
EXT_ML_B8
Likelihood of the source being extended in the total band.
EXT_ML_B7
Likelihood of the source being extended in the hard band.
EXT_ML_B6
Likelihood of the source being extended in the soft band.
BG_MAP_B8
Background value for the total band.
Units: Counts per pixel
BG_MAP_B7
Background value for the hard band.
Units: Counts per pixel
BG_MAP_B6
Background value for the soft band.
Units: Counts per pixel
EXP_MAP_B8
The effective on-axis exposure time in the total energy band.
EXP_MAP_B7
The effective on-axis exposure time in the hard energy band.
EXP_MAP_B6
The effective on-axis exposure time in the soft energy band.
FLUX_B8
The source flux in the total energy (0.2-12 keV) band.
Units: 10-12 ergs/s/cm2
Derived for an absorbed power-law spectrum of slope 1.7 and Nh=3.0E20 cm-2
FLUX_B8_ERR
The error on the total band source flux
FLUX_B7
The source flux in the hard energy (2-12 keV) band.
Units: 10-12 ergs/s/cm2
Derived for an absorbed power-law spectrum of slope 1.7 and Nh=3.0E20 cm-2
FLUX_B7_ERR
The error on the hard band source flux.
FLUX_B6
The source flux in the soft energy (0.2-2 keV) band.
Units: 10-12 ergs/s/cm2
Derived for an absorbed power-law spectrum of slope 1.7 and Nh=3.0E20 cm-2
FLUX_B6_ERR
The error on the soft band source flux.
RATE_B8
The total band count rate
Units: counts/second
RATE_B8_ERR
The error on the total band count rate
RATE_B7
The hard band count rate
Units: counts/second
RATE_B7_ERR
The error on the hard band count rate
RATE_B6
The soft band count rate
Units: counts/second
RATE_B6_ERR
The error on the soft band count rate
RA_B8, DEC_B8
The J2000 celestial position of the total band source.
RADEC_B8_ERR
The statistical error on the total band position.
RA_B7, DEC_B7
The J2000 celestial position of the hard band source.
RADEC_B7_ERR
The statistical error on the hard band position.
RA_B6, DEC_B6
The J2000 celestial position of the soft band source.
RADEC_B6_ERR
The statistical error on the soft band position.
LII_B8, BII_B8
The galactic position of the total band source.
LII_B7, BII_B7
The galactic position of the hard band source.
LII_B6, BII_B6
The galactic position of the soft band source.
VAL_FLAG
A text string which is set to 'CLEAN_SAMPLE' if this source is included in the clean subset. Otherwise the string is set to 'XXXXXXXXXXXX'
SRCNAME_B8
The source name defined in the total band list. The format is 'xs' followed by the revolution number, the observation ID and the source position, e.g. xs0841_9084100002_12:57:07.5+01:50:42
SRCNAME_B7
The source name defined in the hard band list. The format is 'xs' followed by the revolution number, the observation ID and the source position, e.g. xs0841_9084100002_12:57:07.5+01:50:42
SRCNAME_B6
The source name defined in the soft band list. The format is 'xs' followed by the revolution number, the observation ID and the source position, e.g. xs0841_9084100002_12:57:07.5+01:50:42
XIMNAME_B8
The name of the image containing the total band detection.
XIMNAME_B7
The name of the image containing the hard band detection.
XIMNAME_B6
The name of the image containing the soft band detection.
VER_INEXT
If set true, this flag notes that a detection has been found within an extended source and is probably false. This flag is used to ensure that only one source is quoted for the large supernova remnants.
VER_HALO
If set true, this flag indicates that a detection lies within the point spread function, or halo, of a very bright source and is probably spurious.
VER_HIBGND
If set true, this flag indicates that the source lies within a bright region, caused by high background, and is probably spurious.
VER_NREDG
Not used in XMMSL2.
VER_PSUSP
This flag indicates that the quoted position of the source is likely to be inaccurate. In a few slews the attitude reconstruction is poor and in these cases the actual position of the source is difficult to determine and can be wrong by an arcminute.
VER_FALSE
This is a catch-all for problems not included in the other flags. In the catalogue 99 detections have this flag set true. Reasons include: the exposure time has been calculated as zero, a detection due to a very bright source, e.g. SCO X-1, out of the field of view, a possible cosmic ray or a very bad attitude reconstruction.
FLAG_COMMENT
A comment which explains why a particular source flag has been set to true.
IDENT
Cross-correlations of the positions of the slew sources with astronomical databases and catalogues have been performed (see section on IDs). This column gives the catalogue name of the best match.
ALTIDENT
An alternative name for the best match source.
RASSNAME
The name of the closest Rosat All Sky Survey (RASS) source.
ID_CATEGORY
The source type as returned by SIMBAD, NED and the other resources used in the cross-matching process. This is directly taken from the catalogue in question and no attempt has been made to rationalise the values.
ID_RESOURCE
The astronomical database or catalogue from which the best match has been selected. e.g. SIMBAD, NED, etc.
ID_DIST
The distance in arcminutes between the best match candidate and the slew survey source.
Units: arcminutes
RASS_DIST
The distance from the best match ROSAT source and the slew source. Units: arcseconds
MODE_ID
Observing mode of the EPIC-pn camera. FF= Full frame mode eFF = extended full frame mode LW = large window mode
IMAGE_BG_RATE
Peak background count rate in the image from which the source was extracted. This is measured as the count rate, over the whole image, for events with energy > 10 keV (PI>10000). Units: counts/second. It is quoted to a resolution of 0.1 c/s and is used to determine the overall background environment in which a source was detected. This value is used in the creation of a clean subsample of the catalogue (see top level description). Generally, the higher this value, the greater the probability that the source is spurious. This is especially true if the detection likelihood of the source is less than 15.5. The value has been tabulated for images with a background rate greater than 2 c/s. For quieter images the value has been artifically set to 1.9 c/s.
MJD_START
The start time of the subimage where the source is located in modified Julian date (MJD).
MJD_STOP
The end time of the subimage where the source is located in MJD.
VER_OPTLOAD
A warning flag indicating that the source may suffer from optical loading.
FILT_COUNTS
The number of counts found within a 1 arcminute radius about the source position after standard filtering is applied.
UNFILT_COUNTS
The number of counts found within a 1 arcminute radius about the source position with no filtering applied.
US_XMMSL1
The name of the same source in the previous XMMSL1 catalogue if existing.
US_EXTRAS
This release of XMMSL2 makes use of work carried out within the framework of the EXTraS project. XMMSL2 is closely linked to the long-term variability (LTV) catalogue within EXTraS, and this US_EXTRAS column provides the corresponding SRCID value within the EXTraS LTV catalogue.
10 Detection Limits
The minimum detectable count rate for a given band is ~0.4 c/s, for a source which passes through the centre of the detector and for typical background levels. A rough flux upper limit is then available by multiplying this count rate by the conversion factors specified below. This is for each band:
| Band | Energy (keV) | Flux limit (10-12 ergs/s/cm2) |
|---|---|---|
| Total | 0.2-12 | 1.3 |
| Hard | 2-12 | 3.7 |
| Soft | 0.2-2 | 0.57 |
11 Flux Conversion
Source fluxes have been calculated from count rates based on energy conversion factors assuming a spectral model of an absorbed power-law with Nh = 3.0 * 1020 cm2 and slope = 1.7 (see XMM science survey centre memo, SSC-LUX TN-0059 for a general description of the technique) The energy conversion factors used here are:
| Band | Conv factor |
|---|---|
| Total | 3.159 |
| Hard | 9.144 |
| Soft | 1.436 |
and convert between the source count rate (c/s) to flux in these energy bands in units of 10E-12 ergs/s/cm2
12 Differences between XMMSL2 and XMMSL1
Point Spread Function (PSF)
A single slew PSF for the whole EPIC-pn field-of-view (FOV) was generated, in several energy-bands, by averaging the best pointed-observation PSFs from all points within an EPIC-pn FOV, weighted by the vignetting-corrected time that a source would spend crossing a zone associated with each defined PSF calibration location point during a slew. While this is a simplification of the real slew PSF, this averaged PSF was found to provide a very adequate description of all point-like slew sources - most slew sources are weak and the PSF fitting process is thus not highly sensitive to the exact PSF profile. Tests show that this slew PSF gives very similar results to much more time consuming slew-track-dependent PSFs which can be generated. This is both in terms of the numbers of sources detected and the derived parameters, such as detected source counts which are consistent to within ~1%. As a result, this averaged slew PSF has been adopted and applied for all the slew source analysis (see XMM-Newton Current Calibration File release note XMM-SOC-CAL-SRN-333).
Source searching and detection likelihoods
Source searching has been performed with eboxdetect v4.24 using obsmode=slew, emask v2.14, esplinemap v4.5 and emldetect 6.0.2 using psfmodel=slew set to use the EPIC-PN slew-specific PSF. The previous catalogue was searched using code in SAS version 6.5 with the EPIC-pn pointed PSF. This has led to a change in the likelihoods recorded for each source which in turn has necessitated a re-calibration of the detection likelihoods which constitute a good (CLEAN) source. In this catalogue a source is considered CLEAN when:
There are more than 4 background-subtracted counts in either the full, soft or hard bands
AND
Detection likelihood > 10.5 in one of the bands in sources found in low background subimages or detection likelihood > 15.5 in sources found in any subimage.
eslewchain v1.11
The code divides slews into subimages based on time rather than using spatial coordinates as were used previously. This is more robust and solves a problem which prevented very long slews (about 1% of all slews) from being processed in XMMSL1.
Overlapping images
The code produces images from about 45 seconds of data, during which time the spacecraft typically slews about 1.1 degrees. To avoid poor characterisation of sources which are found at the leading or trailing edge of an image, the subimages are overlapped by about 20%. This results in a significant number of sources being detected in two adjacent images. In these case the source parameters are taken from the detection which has the lowest off-axis angle.
Background
Background screening was performed in XMMSL1 on a whole slew basis such that a slew was either used in its entirety or completely discarded. In XMMSL2, subimages are used if the fraction of pixels with a count in the band 7 (2-12 keV) image is less than 0.002, i.e. less than 0.2% of the pixels have one photon.
This means that
1) Parts of slews are now used which haven't been included in previous catalogues.
2) Conversely some images are not used in XMMSL2 which were used previously, hence some sources, present in XMMSL1, will be missing from the new catalogue.
3) The background expression above is affected by bright hard sources, which can cause an artificial triggering of the criterium. To avoid this all excluded images have been checked and those with bright sources reinstated into the source searching procedure.
Maximum exposure time
To ensure a consistent sky coverage, subimages which have a maximum exposure time >30s (actually 34s for band 6, 30s for band 7 and 32s for band 8, due to the energy-dependent vignietting) have been excluded from the survey. This mainly affects the initial two subimages where the spacecraft is accelerating to the nominal slew speed.
Optical Loading
An analysis of bright optical sources in the slew survey has shown that the effects of optical loading, where false X-ray events are created by an excess of optical photons, are greater than previously thought (see XMM-SOC-CAL-TN-0210). A good indicator of optical loading is given by the ratio of events which make it through the filtering process to the original number of events at the position of a source. Three extra columns have been added to the catalogue
- FILT_CNTS : the number of events after filtering found in a circle of 1' radius about the source
- UNFILT_CNTS : the number of events found in the same area before filtering
- VER_OPTLOAD : a flag which indicates whether optical loading may be present.
The flag is set to TRUE if the ratio FILT_CNTS / UNFILT_CNTS < 0.3 and the number of UNFILT_CNTS > 30 events. This is a coarse flag which can be set true for ultra-soft sources, such as white dwarfs and also when an image artifact, for example caused by a noisy pixel or cosmic ray, causes many bad events (see XMM-SOC-CAL-TN-0210 for a detailed discussion). The user should use this flag in conjunction with knowledge of the optical magnitude of the source to discriminate against affected sources.
Reference to previous catalogues
The name of sources which were found in the previous slew catalogue are cross-referenced in the column US_XMMSL1.
Entries are also cross-referenced with the EXTraS LTV catalogue in the US_EXTRAS field.
13 References
- "The first XMM-Newton slew survey catalogue: XMMSL1"
R.D. Saxton, A.M. Read, P. Esquej, M.J. Freyberg, B. Altieri, D. Bermejo
2008, A&A 480, 611 - "EPIC-pn SLEW-specific PSF parameterisation"
A.M. Read, R.Saxton
XMM-SOC-CAL-SRN-0333 - "Optical loading in the XMM-Newton slew source catalogue"
R.D. Saxton, A.M. Read, J. Robrade, J.H.M.M. Schmitt
XMM-SOC-CAL-TN-0210
Acknowledgements
The identification process has made considerable use of the Vizier catalogue access tool, CDS, Strasbourg, France. The original description of the VizieR service was published in A&AS 143, 23. It has used the SIMBAD database, operated at CDS, Strasbourg, France and the NASA/IPAC Extragalactic database (NED) which is operated by the Jet Propulsion Laboratory, California Institute of Technology, under contract with the National Aeronautics and Space Administration.
If the XMMSL2 catalogue has been helpful for your research the following acknowledgment would be appreciated:
This research has made use of data obtained from XMMSL2, the Second XMM-Newton Slew Survey Catalogue, produced by members of the XMM SOC, the EPIC consortium, and using work carried out in the context of the EXTraS project ("Exploring the X-ray Transient and variable Sky", funded from the EU's Seventh Framework Programme under grant agreement no. 607452).