PanGaia - Machine Learning Group
PanGaia
With astrometric data for more than 1,8 billion of sources, the Gaia Early Data Release 3 is the largest stellar census ever published. Furthermore, the forthcoming releases of this catalogue will contain enhanced products like multi-epoch spectra, stellar parameters, and photometry. All together, the data provided by the Gaia mission is an ideal dataset to apply Machine Learning algorithms to identify unknown trends, confirm previous results obtained with sparser datasets, and look for new discoveries.
PanGaia is a user-friendly Python toolkit that has been developed with the main purpose of identifying potential new members of the Star Forming Regions using the astrometric data provided by the main Gaia catalogues. The members of these regions share their velocity distribution and they are spatially distributed in localised regions in our Galaxy. That is, they appear as over-densities in the multi-dimensional spatial + kinematical space. The PanGaia software helps users to
- Easily download and filter out the Gaia data according to different quality criteria,
- Explore interactively the associated astrometry using dynamical 3D Python plotters and the pyESASky visualisation tool, and
- Apply a hierarchical density-based clustering algorithm (HDBSCAN) to identify clusters (i.e., over-densities) in the downloaded dataset.
PanGaia is accessed via a Jupyter Notebook, and by construction it is very easy to modify it and/or implement new functionalities.
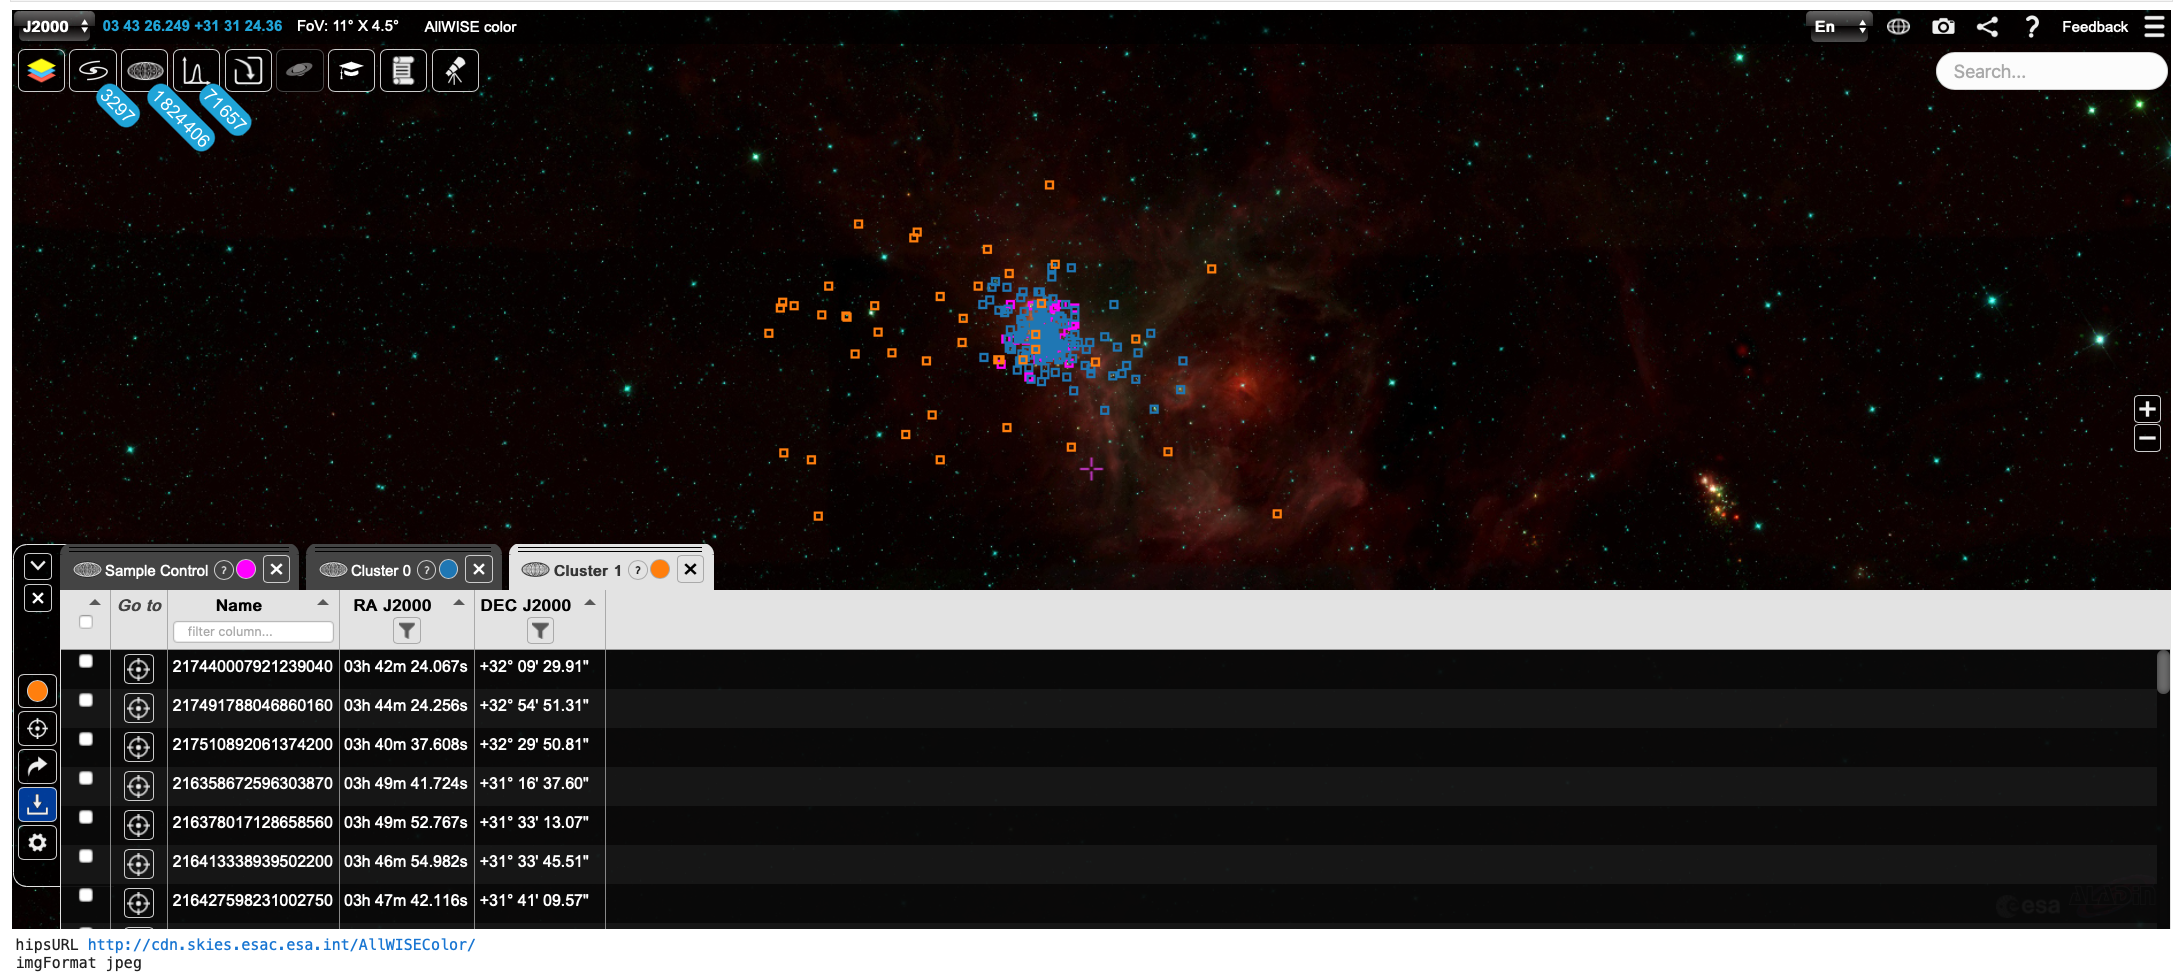
Fig. 1. Clusters identified by HDBSCAN in the IC348 Star Forming Region, visualised using pyESASky - screenshot produced by PanGaia (as all the figures below). Click to enlarge.
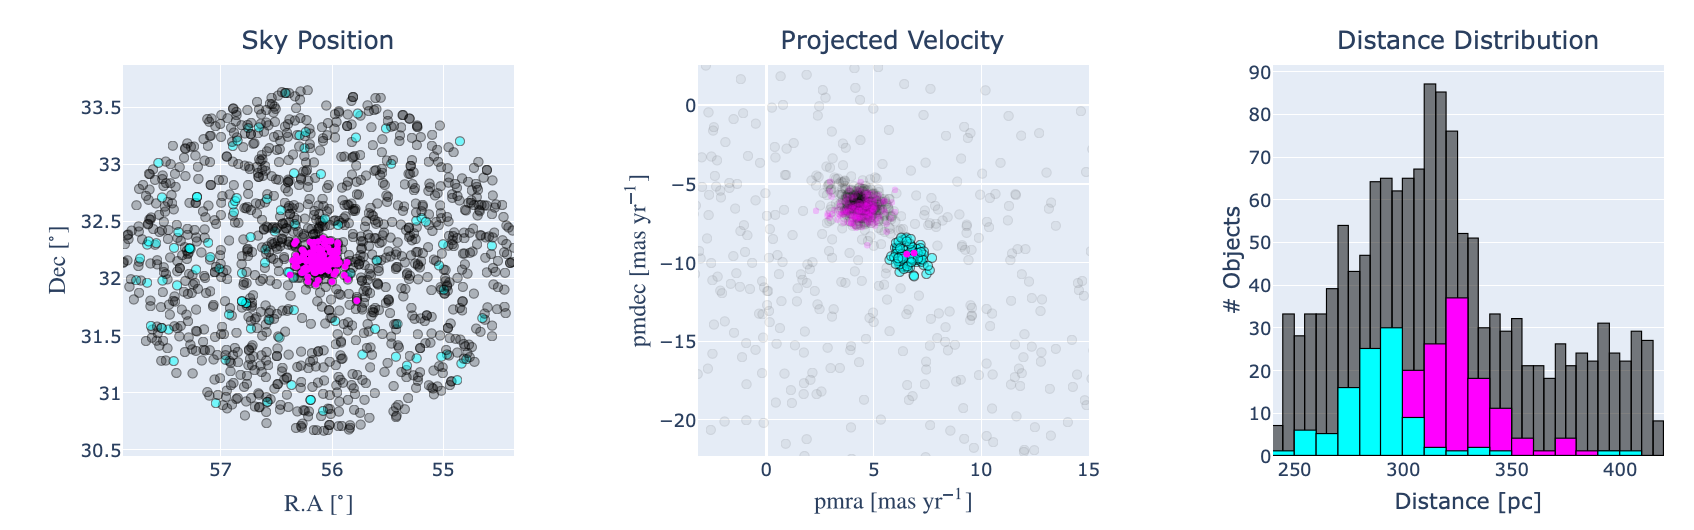
Fig. 2. Interactive plots that allow to inspect and select “by hand” potential clusters in a dataset. Click to enlarge.
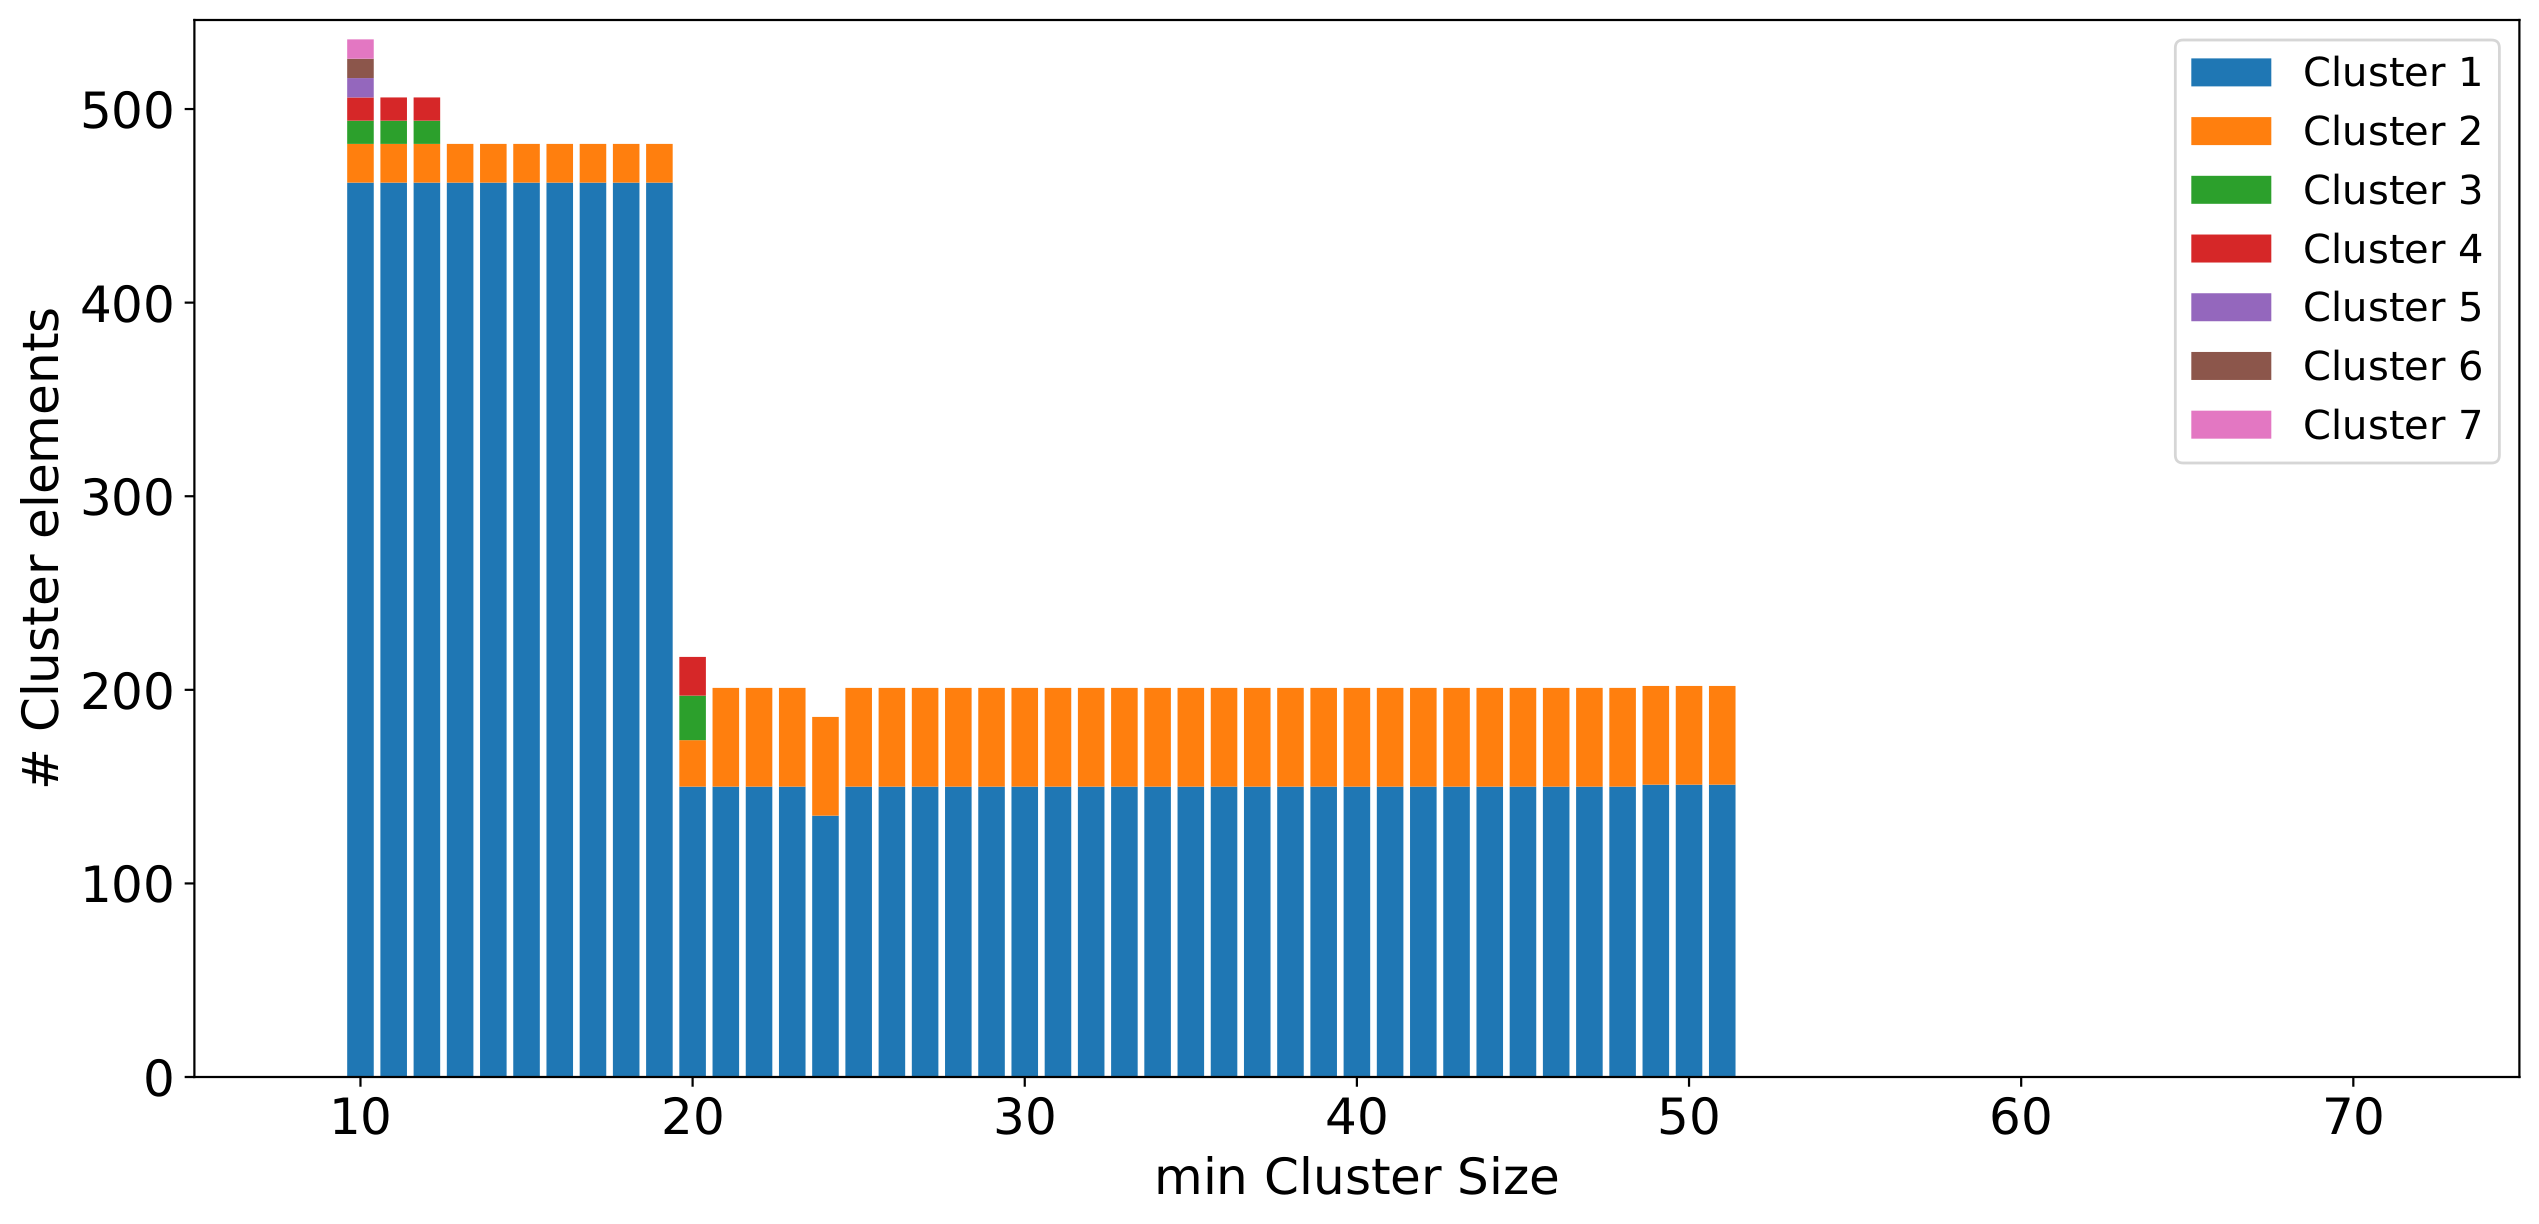
Fig. 3. Bar chart showing the results of applying HDBSCAN to a Gaia dataset. The colours and lengths of the bars indicate the different clusters identified in the multiple executions of the HDSBCAN algorithm (automatically done by PanGaia). Click to enlarge.
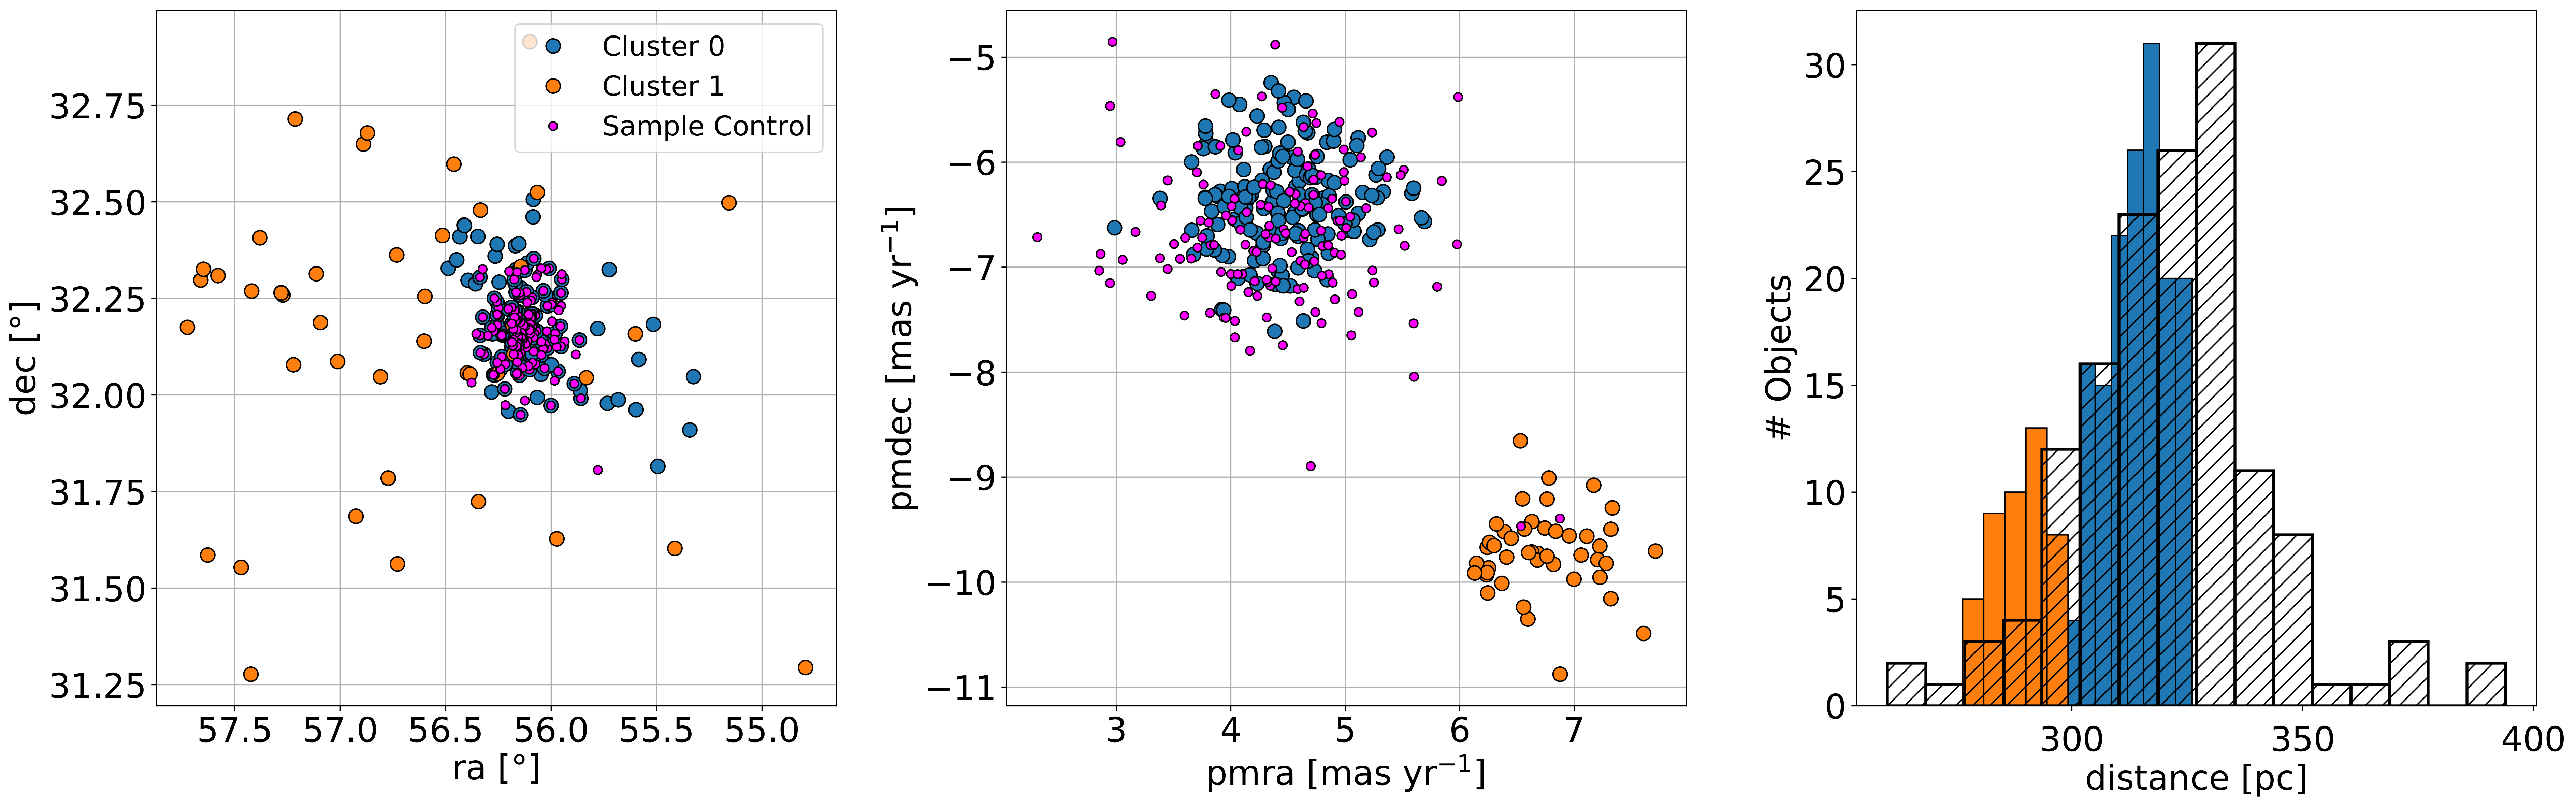
Fig. 4. Properties of two clusters identified by HDSBCAN, compared to those of a control sample. Click to enlarge.