Catalogues - ESDC
Catalogues Information
The following catalogues are available through ESASky:
- Astrometric catalogues: Gaia DR3, Gaia FPR, Hipparcos-2, Tycho-2
- INTEGRAL IBIS/ISGRI Soft Gamma-Ray Source Catalog
- XMM-Newton catalogues: 4XMM-DR13, 4XMM-DR13s, XMMSL2, XMM-SUSS5.0
- Hubble Source Catalog (HSC) v3.1
- All-Sky PLATO Input Catalogue (asPIC1.1)
- Herschel mission catalogues: HPPSC, HSPSC
- Planck mission catalogues: PCCS2, PSZ2, PGCC
- Catalogues from other data providers:
- 2WHSP: A multi-frequency selected catalogue of high energy and very high energy gamma-ray blazars and blazar candidates
- Akari IRC Point Source Catalog
- AllWISE Source Catalog
- Chandra Source Catalog
- eROSITA catalogues: eFEDS main, eFEDS hard, etaCha main, etaCha hard
- Fermi catalogues: 4FGL-DR2, 3FHL, 4LAC-DR2
- GLADE+ Galaxy Catalog
- IceCube All-Sky Point Source Events Catalogue (2008-2018)
- LAMOST DR9 General Catalogs
- Open Universe for Blazars v2.0
- The second ROSAT all-sky survey source catalogue (2RXS)
- Two-Micron All-Sky Survey (2MASS) Catalog of Point Sources
The following catalogues are also available through the ESASky Legacy TAP:
Additionally, some catalogues are also served from external Data Centres via the External Data Centres button. This feature is described here.
Below is a brief description of the content of the catalogues. Please note that some catalogues may display rounded or truncated values in ESASky; however, all the original digits are kept when the catalogue tables are downloaded or loaded into a VO application through SAMP.
The catalogue functionality has some known caveats, described here.
ASTROMETRIC CATALOGUES
GAIA DATA RELEASE 3 (DR3)
- Release: 3.0 (2022)
- Date of observations: From 25 July 2014 (10:30 UTC) to 28 May 2017 (08:44 UTC)
- Source: ESA
- Reference: Gaia Collaboration, Vallenari, A., et al. 2022 (arXiv) (ADS)
- DOI: https://doi.org/10.5270/esa-qa4lep
The Gaia DR3 main source catalogue provides positions, parallaxes and proper motions for more than 1.46 billion (1.468 x 10⁹) sources, between G-magnitudes of about 3 and 21. The astrometric solution is accompanied with some quality indicators, like RUWE, and source image descriptors. Additionally, G magnitudes for around 1.806 billion sources (with the known issue present in EDR3 corrected in Gaia DR3), and GBP and GRP magnitudes for around 1.54 billion and 1.55 billion sources, respectively are also provided. Parallax uncertainties span between 0.02 mas for G<15 mag and 1.3 mas at G=21 mag. Proper motion uncertainties range from 0.02 mas/yr for G<15 mag to 1.4 mas/yr for G=21 mag.
ESASky displays the Gaia DR3 main source catalogue (called gaia_source in the Gaia archive). For a complete description of the Gaia DR3 data release, please refer to the Gaia content and documentation pages. An overview can also be found in this page. The following provides a summary of the main source catalogue contents:
- The full astrometric solution (5 parameters) - positions on the sky (α, δ), parallaxes, and proper motions - for around 1.468 billion (1.468 109) sources, with a limiting magnitude of about G ≈ 21 and a bright limit of about G ≈ 3. The astrometric solution is accompanied with some quality indicators, like RUWE, and source image descriptors.
- In addition, two-parameters solutions - positions on the sky (α, δ) - for around 344 million additional sources.
- G magnitudes for around 1.806 billion sources (with the known issue present in EDR3 corrected in Gaia DR3).
- GBP and GRP magnitudes for around 1.54 billion and 1.55 billion sources, respectively.
- Please be aware that the photometric system for the G, GBP, and GRP bands in Gaia (E)DR3 is different from the photometric system as used in Gaia DR2 and Gaia DR1.
- See the DR3 documentation for a full description of all columns in gaia_source.
ESASky displays the following default columns from the Gaia DR3 catalogue (note: more columns are available via the settings button or by right clicking in the ESASky data panel):
|
GAIA FOCUSED PRODUCT RELEASE (Crowded Field Source catalogue)
- Release: Focused Product Release (FPR) (2023)
- Date of observations: From 1 January 2015 to 20 January 2020
- Source: ESA
- Reference: Gaia Collaboration, Weingrill, K., et al. 2023 (arXiv) (ADS)
- DOI: https://doi.org/10.1051/0004-6361/202347203
The Gaia Focused Product Release (FPR) Crowded Field Source catalogue consists of astrometry and photometry from engineering images taken in the Omega Centauri region. The sources are based on Service Interface Function (SIF) images of very dense regions in the sky. These sources build an add-on catalogue to the nominal Gaia catalogue. Nominal and SIF detections were not mixed to create these sources. These sources are thus obtained from SIF image detections only. Sources already present in the nominal catalogue were removed from the SIF add-on catalogue. The catalogue contains positions, parallaxes and proper motions for 526,457 new Gaia sources as derived from the SIF images (with 130 additional sources with positions only), and photometric information (mean G magnitude and flux) for these same 526,587 sources as derived from the SIF images.
| Period of observations? | 66 months of data |
|---|---|
| Complementary to Gaia DR3? | Yes |
| Reference epoch? | 2017.5 |
| Gaia DR3 crossmatches applicable? | No, this is fully new data |
| Gaia DR3 passbands applicable? | Yes, Gaia DR3 G-band only |
| Defined in the Gaia-CRF3 frame? | Yes |
| Gaia designation | Gaia FPR yyyy |
ESASky displays the Gaia FPR Crowded Field Source catalogue (called crowded_field_source in the Gaia archive). For a complete description of the Gaia FPR data release, please refer to the Gaia content and documentation pages. An overview can also be found in this page.
ESASky displays the following default columns from the Gaia FPR catalogue (note: more columns are available via the settings button or by right clicking in the ESASky data panel):
|
- Release: 2.0 (2007)
- Date of observations: From 1989 to 1993
- Source: ESA
- Reference: van Leeuwen 2007, A&A 474, 653
The Hipparcos-2 Catalogue is a new reduction of the data from the Hipparcos mission that improved up to a factor of 4 the accuracy of stars with Hp magnitude 8 or lower. It contains positions, parallaxes and proper motions for 118,218 stars. For more information on this catalogue, go to this page or to Vizier.
ESASky displays the following columns from the Hipparcos-2 catalogue:
| Column name | Units | Description |
| Name | - | Source name |
| Right Ascension | hh mm ss.ss | Right ascension of source (J2000) |
| Declination | dd mm ss.s | Declination of source (J2000) |
| Parallax | mas | Parallax of source |
| Delta Parallax | mas | Formal error on parallax |
| Proper motion in RA | mas/yr | Proper motion of source in the right ascension direction * COS(declination) |
| Delta Proper motion in RA | mas/yr | Statistical error of proper motion in RA*cos(Dec) |
| Proper motion in DEC | mas/yr | Proper motion of source in the declination direction |
| Delta Proper motion in DE | mas/yr | Statistical error of proper motion in Dec |
| Magnitude | mag | Hipparcos magnitude |
| Delta Magnitude | mag | Error on mean Hipparcos magnitude |
| B - V colour | mag | Colour index |
| V - I colour | mag | V - I Colour index |
TYCHO-2 CATALOGUE
- Release: 2.0 (2000)
- Date of observations: From 1989 to 1993
- Source: ESA
- Reference: Høg et al. 2000, A&A 355, L27
The Tycho-2 Catalogue is an astrometric reference catalogue containing positions, proper motions and two-colour photometry (BT and VT) for the 2.5 million brightest stars in the sky. The catalogue is based on observations made using the Hipparcos satellite star mapper and is constructed using the same observations that were used to create the original Tycho catalogue. Improved reduction techniques have resulted in a catalogue with significantly more entries and in improved precision. More information on the Tycho-2 catalogue can be found here and in Vizier.
ESASky displays the following columns from the Tycho-2 catalogue:
| Column name | Units | Description |
| Name | - | Source name |
| Right Ascension | hh mm ss.ss | Right ascension of source (J2000) |
| Declination | dd mm ss.s | Declination of source (J2000) |
| Proper motion in RA | mas/yr | Proper motion of source in the right ascension direction * COS(declination) |
| Delta Proper motion in RA | mas/yr | Statistical error of proper motion in RA*cos(Dec) |
| Proper motion in DEC | mas/yr | Proper motion of source in the declination direction |
| Delta Proper motion in DE | mas/yr | Statistical error of proper motion in Dec |
| BT magnitude | mag | Tycho-2 B magnitude |
| Delta BT magnitude | mag | Statistical error of BT |
| VT magnitude | mag | Tycho-2 V magnitude |
| Delta VT magnitude | mag | Statistical error of VT |
| Hip | - | Hipparcos number |
FOURTH integral IBIS/IGRI SOFT GAMMA-RAY SOURCE catalog
- Release: 4 (2010, updated 2016)
- Date of observations: From 2002 to 2010
- Reference: Bird et al. 2009, ApJ SS 186, 1; Bird et al. 2016, ApJ SS 223, 1
The IBIS/ISGRI Soft Gamma-Ray Source Catalog is an all-sky catalog based on INTEGRAL-IBIS observations performed during the first 1000 orbits of the satellite. The catalogue was released in 2009 and updated in 2016. It is constructed from all public good-quality data available from the mission launch in 2002 up to the end of 2010, and it includes 939 sources significantly detected in the 17-100 keV energy band, of which 120 are previously undiscovered soft gamma-ray emitters. For more information on this catalogue, read the above references, or go to Vizier. ESASky also provides a link to the Multi-messenger Online Data Analysis (MMODA) product gallery per source, when products are available in MMODA.
ESASky displays the following columns of this catalogue:
| Column name | Units | Description |
|---|---|---|
| Name | - | Source name |
| Right ascension | hh mm ss.ss | Right ascension of source (J2000) |
| Declination | dd mm ss.s | Declination of source (J2000) |
| Flux20-40 keV | mCrab | Flux in the 20-40 keV band |
| Flux40-100 keV | mCrab | Flux in the 40-100 keV band |
| Type | - | Object type |
| Significance | - | Maximum significance in a single map |
| Exposure | ksec | Exposure time |
xmm-newton catalogues
The following catalogues from the XMM-Newton mission are included in ESASky: 4XMM-DR13, 4XMM-DR13s, XMMSL2, XMM-SUSS5.0.
THE XMM-NEWTON EPIC SERENDIPITOUS SOURCE CATALOGUE (4XMM-DR13)
- Release: 4XMM_DR13 (2023)
- Date of observations: From 3 February 2000 to 31 December 2022
- Source: XMM-Newton Science Archive
- Reference: Webb et al. (2020)
The 4XMM-DR13 catalogue contains source detections drawn from 13,243 XMM-Newton EPIC observations, covering an energy interval from 0.2 keV to 12 keV. These observations were made between 2000 February 3 and 2022 December 31 and all datasets were publicly available by 2022 December 31, but not all public observations are included in this catalogue (see here for more information). Presently, only sources with QUALITY flag equals 0 or 1 (sources "good" or "with suspect parameters") are displayed in ESASky.
| Number of observations | 13,243 |
|---|---|
| Number of 'clean' observations | 10,895 |
| Sky coverage | 1328 sq.deg |
| Number of detections | 983,948 |
| Number of 'clean' detections (quality flag < 3) | 854,095 |
| Number of unique sources | 656,997 |
| Number of 'cleanest' extended detections (quality flag = 0, not in high background fields) | 20,971 |
| Number of detections with spectra | 353,821 |
| Number of detections with time series | 353,538 |
| Number of detections with probable constant time series (P < 1 × 10⁻⁵) | 8,029 |
ESASky displays the following columns of the 4XMM-DR13 catalogue by default:
| Column name | Units | Description |
|---|---|---|
| Name | - | Name of source |
| RA | hh mm ss.ss | Right ascension of source (J2000) |
| Dec | dd mm ss.s | Declination of source (J2000) |
| Flux | erg·cm-2·s-1 | Mean EPIC total flux in the 0.2-12.0 keV band |
| Flux Error | erg·cm-2·s-1 | EPIC Flux error in the 0.2-12.0 keV band |
| Flux0.5-1keV | erg·cm-2·s-1 | EPIC Flux in the 0.5-1.0 keV band |
| Flux Error0.5-1keV | erg·cm-2·s-1 | Error on the EPIC flux in the 0.5-1.0 keV band |
| Flux1-2keV | erg·cm-2·s-1 | EPIC flux in the 1.0-2.0 keV band |
| Flux Error1-2keV | erg·cm-2·s-1 | Error on the EPIC flux in the 1.0-2.0 keV band |
| Flux2-4.5keV | erg·cm-2·s-1 | EPIC flux in the 2.0-4.5 keV band |
| Flux Error2-4.5keV | erg·cm-2·s-1 | Error on the EPIC flux in the 2.0-4.5 keV band |
| Flux4.5-12keV | erg·cm-2·s-1 | EPIC flux in the 4.5-12.0 keV band |
| Flux Error4.5-12keV | erg·cm-2·s-1 | Error on the EPIC flux in the 4.5-12.0 keV band |
| Start Time | MJD | Mean total flux |
The 4XMM-DR13s XMM-NEWTON serendipitious source CATALOGUE from Overlapping observations (4XMM-DR13s)
- Release: 4XMM-DR13s (2023)
- Date of observations: From 1 February 2000 to 29 November 2022
- Source: XMM-Newton Science Archive
-
Reference: Traulsen et al. (2020)
The stacked catalogue 4XMM-DR13s has been compiled from 1,688 groups of 9,796 overlapping good-quality XMM-Newton observations. They were selected from the public observations taken between 2000 February 1 and 2022 November 29 and overlap by at least one arcminute in radius and are not affected by very high background emission. The catalogue contains 401,596 unique sources, 310,478 of them multiply observed, with positions and source parameters like fluxes in the XMM-Newton standard energy bands, hardness ratios, quality estimate, and information on inter-observation variability. For more details, go to the paper above or to this page.
| Number of stacks | 1,688 |
|---|---|
| Number of observations | 9,688 |
| Approximated sky coverage | 650 sq.deg |
| Approximated multiply observed sky area | 420 sq.deg |
| Number of sources | 401,596 |
| Number of sources with several contributing observations | 310,478 |
ESASky displays the following columns of the 4XMM-DR13s catalogue by default:
| Column name | Units | Description |
|---|---|---|
| Name | - | Name of source |
| IAU Name | - | IAU name of source |
| RA | hh mm ss.ss | Right ascension of source (J2000) |
| Dec | dd mm ss.s | Declination of source (J2000) |
| Flux | erg·cm-2·s-1 | EPIC flux in the 0.2-12.0 keV band |
| Flux Error | erg·cm-2·s-1 | 1-sigma Error on EPIC flux in the 0.2-12.0 keV band |
| N. Contrib. | - | Number of observations in which the source was fitted |
| N. Obs. | - | Number of observations involved in the stack |
| Start time | MJD | Date of the start of the observation |
| EP Ontime | s | Total good exposure time at the central position of the source |
| Extent | arcsec | Source extent radius |
| Extent err | arcsec | Error in the source extent radius |
| Flux var. | - | Largest difference between fluxes (in terms of sigma) |
the XMM-Newton SLEW CATALOGue 2.0
- Release: 2.0 (2017)
- Date of observations: From February 2000 to December 2013
- Source: XMM-Newton Science Archive
-
Reference: Saxton et al. (2008)
XMMSL2 is the second catalogue of X-ray sources found in slew data taken from the European Space Agency's (ESA) XMM-Newton observatory, and has been constructed by members of the XMM SOC and the EPIC consortium on behalf of ESA. This release uses results of work which has been carried out within the framework of the EXTraS project ("Exploring the X-ray variable and Transient Sky"), funded from the EU's Seventh Framework Programme under grant agreement no.607452.
XMMSL2 has been generated from 2,114 slews, executed between 2001-08-26 and 2014-12-31, revolutions 314 to 2,758. Not all slews made in this period have been used; slews with particularly high background throughout the slew or which gave processing problems have been rejected. A description of slew selection and initial processing is given here. The slews have been processed separately in three energy bands to form three distinct surveys which have been subsequently combined to form one catalogue. After correcting for overlaps between slews, 84% of the sky has now been covered.
The release includes two FITS files. A full catalogue (xmmsl2_total.fits.gz), containing 72,352 detections found with a likelihood of DET_ML>8 and a "clean" catalogue (xmmsl2_clean.fits.gz) where all known bad sources have been removed and where the detection limit has been raised to DET_ML>10.5 in general and DET_ML>15.5 for sources found in images with a higher than usual background. Efforts have been made to identify spurious detections and 3,017 have been flagged as such in the full catalogue
The default columns from this catalogue displayed in ESASky are the following:
| Column name | Units | Description |
|---|---|---|
| Name | - | Name of source |
| Right ascension | hh mm ss.ss | Right ascension of source (J2000) |
| Declination | dd mm ss.s | Declination of source (J2000) |
| Flux (0.2-12kev) | erg·cm-2·s-1 | Flux in the 0.2-12 keV band |
| Flux Error (0.2-12kev) | erg·cm-2·s-1 | Flux error in the 0.2-12 keV band |
| Flux (2-12kev) | erg·cm-2·s-1 | Flux in the 2-12 keV band |
| Flux Error (2-12kev) | erg·cm-2·s-1 | Fluxerror in the 2-12 keV band |
| Flux (0.2-2kev) | erg·cm-2·s-1this | Flux in the 0.2-2 keV band |
| Flux Error (0.2-2kev) | erg·cm-2·s-1 | Flux error in the 0.2-2 keV band |
The XMM-OM serendipitous ultraviolet source survey CATALOGUE (XMM-suss5.0)
- Release: 5.0 (2020)
- Date of observations: From February 2000 to February 2020
- Source: XMM-Newton Science Archive
-
Reference: Page et al. (2012)
The SUSS5.0 catalogue is a catalogue of sources serendipitously detected by the Optical Monitor (OM) on board the XMM-Newton observatory. It provides source positions, magnitudes and fluxes in six broad-band ultraviolet and optical filters for more than 5.9 million sources, as well as profile diagnostics and variability statistics.
| Number of observations | 10,628 |
|---|---|
| Number of entries | 8,863,922 |
| Number of unique sources | 5,965,434 |
| Number of sources with repeated observations | 1,120,754 |
The data processing was performed at the European Space Astronomy Centre (ESAC, Madrid, Spain) using the XMM Science Analysis Software system (SAS) version 18.0. In addition to covering a larger observation period, this fifth release includes flagging of sources affected by a patch of reduced sensitivity near the boresight, caused by erroneously V-filter exposures during an observation of Jupiter in July 2017 (revolution 3224). For more details on this release of the catalogue, go to this page.
These are the default columns from the SUSS5.0 catalogue displayed in ESASky:
| Column name | Units | Description |
|---|---|---|
| Name | - | Name of source |
| Observation ID | - | Observation ID number |
| Right ascension | hh mm ss.ss | Right ascension of source (J2000) |
| Declination | dd mm ss.s | Declination of source (J2000) |
| DPos | - | The statistical error on the source position as returned by the source detection software. |
| UVW1 Flux | erg·cm-2·s-1 | Flux in the UVW1 band |
| UVW2 Flux | erg·cm-2·s-1 | Flux in the UVW2 band |
| UVM2 Flux | erg·cm-2·s-1 | Flux in the UVM2 band |
| U Flux | erg·cm-2·s-1 | Flux in the U band |
| V Flux | erg·cm-2·s-1 | Flux in the V band |
| B Flux | erg·cm-2·s-1 | Flux in the B band |
Hubble Source Catalog (HSC)
- Release: 3.1 (June 2019)
- Date of observations: to October 2017
- Source: Space Telescope Science Institute (STScI)
-
Reference: Whitmore et al. 2016, ApJ, 151, 134
The Hubble Source Catalog is a combination of all the visit-based source lists in the Hubble Legacy Archive (HLA) into a single catalogue and is designed to optimize science from the Hubble Space Telescope by combining the tens of thousands of visit-based source lists in the HLA into a single master catalog.
The HSC v3 contains members of the WFPC2, ACS/WFC, WFC3/UVIS and WFC3/IR Source Extractor source lists from HLA version DR10 (data release 10). The cross-matching process involves adjusting the relative astrometry of overlapping images so as to minimize positional offsets between closely aligned sources in different images. After correction, the astrometric residuals of cross-matched sources are significantly reduced, with median errors less than 8 mas. The absolute astrometry is calibrated using Gaia DR1, Pan-STARRS, SDSS, and 2MASS as the astrometric backbone for initial corrections. In addition, the catalog includes source nondetections. The cross-matching algorithms and the properties of the initial (Beta 0.1) catalog are described in Budavari & Lubow (2012), and the Version 1 catalog is described in Whitmore et al. (2016).
Version 3 includes (see here for more details):
- There are approximately 25% more ACS source lists and almost twice as many WFC3 source lists compared with HSC v2.
- The source list photometric quality is significantly improved.
- Improved astrometric calibration is based on the Gaia DR1 catalog. Shifts up to 100 arcsec have been correctly identified. 94% of the fields have matches to an external astrometric reference catalog.
- The scatter in magnitudes is measured using the median absolute deviation (MAD) of the differences from the median magnitude for more robust estimates.
ESASky displays the following default columns from the Hubble Source Catalog:
| Column name | Units | Description |
|---|---|---|
| Match ID | - | The HSC match ID number. Details here |
| Target Name | - | Target name for one of the observations |
| Number Of Images | - | Number of images used in the match (column also called num_images) |
| Number Of Images Per Filter | - | Number of images used in the match per filter |
| RA | hh mm ss.ss | Right ascension for the match (J2000) |
| Dec | dd mm ss.s | Declination for the match (J2000) |
| Filters | - | Filter for the match, one filter per row. First part of the filter name corresponds to the instrument, where w3 = WPC3; w2 = WFPC2; a = ACS |
| Magnitude | mag | Median magnitude for the corresponding filter. |
| Magnitude error | mag | Median absolute deviation around the median magnitude. |
Note: There is a small positional offset (< 1") between the source coordinates from the HSC and their location on the HST HiPS maps. This is due to the fact that the HST HiPS were generated from HST data products, while the HSC was created from HLA data products, and there is a discrepancy between the astrometric solutions from both samples. An improved sample of HST HiPS will be produced soon.
See the Caveats page for caveats on the HSC.
All-Sky PLATO input catalogue (asPIC1.1)
- Release: 1.1 (September 2021)
- Date of observations: July 2014 to May 2016 (Gaia DR2)
- Source: VizieR (CDS): J/A+A/653/A98/, SSDC asPICtool, Space Telescope Science Institute (STScI)
-
Reference: Montalto, M. et al. (2021) A&A, 653, 98
The ESA PLAnetary Transits and Oscillations of stars (PLATO) mission will search for terrestrial planets in the habitable zone of solar-type stars. Because of telemetry limitations, PLATO targets need to be pre-selected. The all-sky PLATO input catalogue will be fundamental to selecting the best PLATO fields and the most promising target stars, deriving their basic parameters, analysing the instrumental performances, and then planning and optimising follow-up observations. This catalogue also represents a valuable resource for the general definition of stellar samples optimised for the search of transiting planets.
The first public release of the all sky PLATO Input catalogue (asPIC version 1.1) contains a total of 2,675,539 stars, among which are 2,378,177 FGK dwarfs and subgiants and 297,362 M dwarfs. It was produced using Gaia Data Release 2 (DR2) astrometry and photometry and 3D maps of the local interstellar medium. It provides derived reddening of the targets and estimates of stellar fundamental parameters (Teff, radius, mass) from astrometric and photometric measurements using a developed algorithm. For more information, see Montalto, M. et al. (2021) A&A, 653, 98.
ESASky provides access to the following catalogues from the Herschel mission: the Herschel-PACS Point Source Catalogue (HPPSC) and the Herschel-SPIRE Point Source Catalogue (HSPSC).
HERSCHEL-PACS POINT SOURCE CATALOGUE (HPPSC)
- Release: 1.0 (2017)
- Date of observations: from 2009 to 2013
- Source: Herschel Science Centre
- Reference: Explanatory Supplement
The Herschel-PACS Point Source Catalogue (HPPSC), released on 17th May 2017, contains about half million entries distributed over the three bands of the Photodetector Array Camera and Spectrometer (PACS) onboard Herschel, which mapped ~8% of the far-infrared sky. The broad-band filters were centred at 70, 100 and 160 μm, allowing an angular resolution of 5.6ʺ, 6.8ʺ and 11.3ʺ, respectively.
The catalogue consists of three tables, one per each of these bands. The table below summarises the columns from each table that are displayed in ESASky.
| Column name | Units | Description |
|---|---|---|
| Name | - | Name of source |
| Right Ascension | hh mm ss.ss | Right ascension of source (J2000) |
| Declination | dd mm ss.s | Declination of source (J2000) |
| Flux | mJy | Flux density |
| ΔFlux | mJy | Flux density error |
| FWHM_x Fit | arcsec | FWHM in x direction |
| FWHM_y Fit | arcsec | FWHM in y direction |
| S/N_S | - | Structure noise-based signal-to-noise ratio |
| S/N_R | - | Flux-based signal-to-noise ratio |
| elong flag | - | Elongation flag (0=circular) |
| edge flag | - | Edge flag (True/False) |
| blend flag | - | Blend flag (0=not blended) |
| warmat | - | Affected by warm attitude (True/False) |
| ssomap flag | - | Solar System Map flag (True/False) |
| Observation ID | - | First Observation ID from the list of observations that built the map |
For details on the HPPSC, and to get the full catalogues, go to this page.
HERSCHEL-SPIRE POINT SOURCE CATALOGUE (HSPSC)
- Release: 1.0 (2017)
- Date of observations: from 2009 to 2013
- Source: Herschel Science Centre
- Reference: Explanatory Supplement
The SPIRE Point Source Catalogue (SPSC) was released on 7th February 2017 jointly by the NASA Herschel Science Center and the ESA Herschel Science Centre. It contains more than 1.6 million entries extracted from a total 6878 observations in the sub-millimetre range made by the Spectral and Photometric Imaging Receiver (SPIRE) onboard Herschel.
The catalogue consists of three tables, one per each of the three SPIRE photometric bands, centred at 250, 350 and 500 microns (1199, 857 and 600 GHz, respectively). The table below summarises the columns from these three subcatalogues that are displayed in ESASky.
| Column name | Units | Description |
|---|---|---|
| Name | - | Name of source |
| Right Ascension | hh mm ss.ss | Right ascension of source (J2000) |
| Declination | dd mm ss.s | Declination of source (J2000) |
| SNR | - | Signal-to-noise ratio |
| Flux | mJy | TML flux density |
| ΔFlux | mJy | Propagated weighted error in the TML flux density |
| FluxDao | mJy | Daophot flux density |
| ΔFluxDao | mJy | Propagated weighted error in the Daophot flux density |
| FluxTM2 | mJy | TM2 flux density |
| ΔFluxTM2 | mJy | Propagated weighted error in the TM2 flux density |
| pntsrc flag | - | Point source flag |
| extsrc flag | - | Extended source flag |
| lowfwhm flag | - | Low FWHM flag |
| largegal flag | - | Large galaxy flag |
| mapedge flag | - | Map edge flag |
| ssocont flag | - | SSO contaminator flag |
For details on the different flux density measurements provided by the catalogue, refer to the Explanatory Supplement. To access the full SPSC catalogue and its Explanatory Supplement, go to this page.
ESASky provides access to the following catalogues from the Planck mission: PCCS2, Planck SZ2, PGCC
For a full description of the catalogues, go to this page or to the reference papers cited below.
second PLANCK CATALOGue OF COMPACT SOURCES (PCCS2)
- Release: 2.0 (2015)
- Date of observations: from 13th August 2009 to 3rd August 2013
- Source: Planck Legacy Archive
- Reference: Planck-2015-A35
The PCCS2 is a set of single-frequency source catalogues extracted from the Planck full-mission maps in intensity and polarization. These maps contain 48 months of data for the LFI channels, and 29 months of data for the HFI channels, therefore the flux densities derived from these maps are an average of the source emission over these two periods of time. For the channels 30-353 GHz, the catalogues also contain polarization flux densities and polarization angles for sources with a significance in polarization >99.99%.
The catalogue at 100 Ghz and above has been divided into two subcatalogues: the PCCS2, including all reliable detections (>80%), and PCCS2E, including sources located in sky regions where it was not possible to estimate their reliability.
|
Channel Frequency (Ghz) Wavelength (µm) |
30 28.4 10561 |
44 44.1 6807 |
70 70.4 4260 |
100 100.0 3000 |
143 143.0 2098 |
217 217.0 13.82 |
353 353.0 850 |
545 545.0 550 |
857 857.0 350 |
|---|---|---|---|---|---|---|---|---|---|
| Number of sources | 1,560 | 934 | 1,296 | 1,742 | 2,160 | 2,135 | 1,344 | 1,694 | 4,891 |
| Number of significantly polarized sources | 122 | 30 | 34 | 20 | 25 | 11 | 1 | - | - |
| Minimum polarized flux density (mJy) | 117 | 181 | 284 | 138 | 148 | 166 | 453 | - | - |
| Polarized flux density uncertainty (mJy) | 46 | 88 | 91 | 30 | 26 | 30 | 81 | - | - |
|
Channel Frequency (Ghz) Wavelength (µm) |
30 28.4 10561 |
44 44.1 6807 |
70 70.4 4260 |
100 100.0 3000 |
143 143.0 2098 |
217 217.0 13.82 |
353 353.0 850 |
545 545.0 550 |
857 857.0 350 |
|---|---|---|---|---|---|---|---|---|---|
| Number of sources | - | - | - | 2,487 | 4,139 | 16,842 | 22,665 | 31,068 | 43,290 |
| Number of significantly polarized sources | - | - | - | 43 | 111 | 325 | 666 | - | - |
| Minimum polarized flux density (mJy) | - | - | - | 121 | 87 | 114 | 348 | - | - |
| Polarized flux density uncertainty (mJy) | - | - | - | 52 | 44 | 55 | 178 | - | - |
The following table summarises the columns from the catalogues displayed in ESASky:
| Column name | Units | Description |
|---|---|---|
| Name | - | Name of source |
| Right ascension | hh mm ss.ss | Right ascension of source (J2000) |
| Declination | dd mm ss.s | Declination of source (J2000) |
| Frequency | GHz | Planck Frequency |
| Flux density | mJy | Channel flux density |
| Flux density error | mJy | Error in channel flux density |
| Extended Source Flag | - | Extended source flag, 0 if the source is compact and 1 if the source is extended. |
| Cat. Reliability | - | The highest reliability catalogue to which the source belongs. As the full catalogue reliability is >=80%, this is the lowest possible value in this column. |
SECOND planck sunyaev-zeldovitch catalogue (Psz2)
- Release: 2.0 (2015)
- Date of observations: from 13th August 2009 to 3rd August 2013
- Source: Planck Legacy Archive
- Reference: Planck-2015-A36
The Planck SZ catalogue is a nearly all-sky list of SZ detections obtained from the Planck data, derived from the HFI frequency channel maps after masking and filling the bright point sources (SNR>10) from the PCCS catalogues in those channels. It contains 1653 detection, of which 1203 are confirmed clusters with identified counterparts in external datasets.
The catalogue was constructed using three detection pipelines: two implementations of the matched multi-filter algorithm (MMF1 and MMF2) and a Bayesian algorithm called PowellSnakes (PwS). A union catalogue was constructed from the detections of all three pipelines. To avoid spurious detections due to foreground sources, a mask to remove Galactic dust, nearby galaxies and point sources was applied after the merging, leaving 83.7% of the sky.
The union catalogue contains the coordinates of a detection, its signal-to-noise ratio, an estimate of the total integrated Comptomization parameter Y and its uncertainty, as well as information on the generation and validation. If available, external identification of a cluster and its redshift is also provided. When more than one pipeline makes the same detection, the information is taken from the most significant detection. If the redshift is known, the SZ mass from the reference pipeline is provided.
The table below shows the columns from this catalogue displayed in ESASky:
| Column name | Units | Description |
|---|---|---|
| Name | - | Source name |
| Right Ascension | hh mm ss.ss | Right ascension of source (J2000) |
| Declination | dd mm ss.s | Declination of source (J2000) |
| Signal to noise | - | Signal-to-noise ratio of the detection |
| Redshift | - | Redshift of cluster |
| Sundyaev-Zeldovitch mass | 1014 MSun | Sundyaev-Zeldovitch mass proxy |
| Validation | - | External validation status |
planck catalogUE of galactic cold clumps (PGCC)
- Release: 2.0 (2015)
- Date of observations: from 13th August 2009 to 3rd August 2013
- Source: Planck Legacy Archive
- Reference: Planck-2015-A37
The PGCC containes 13,188 Galactic sources and 54 sources located in the Magellanic Clouds, all of them identified as cold sources in Planck data (sources colder than their environment). The sources are extracted from the Planck HFI 857, 545 and 353 GHz maps and the 3 THz IRIS map. A detection requires SNR > 4 in pixels in all Planck bands and a minimum angular distance of 5 arcmin to other detections.
The derived physical properties of the PGCC sources are: temperature, column density, physical size, mass, density, and luminosity. The sources span a temperature range from 5.8 to 20 K, and a variety of physical properties corresponding to many different types of objects, from dense cold cores to large molecular clouds.
These are the columns from the PGCC catalogue displayed in ESASky:
| Column name | Units | Description |
|---|---|---|
| Name | - | Name of source |
| Right Ascension | hh mm ss.ss | Right ascension of source (J2000) |
| Declination | dd mm ss.s | Declination of source (J2000) |
| Signal to Noise | - | Maximum S/N over the 857, 545 and 353 GHz Planck cold residual maps |
| Major FWHM | arcmin | FWHM along the major axis of the elliptical Gaussian |
| Major FWHM error | arcmin | Error in the major axis FWHM |
| Minor FWHM | arcmin | FWHM along the minor axis of the elliptical Gaussian |
| Minor FWHM error | arcmin | Error in the minor axis FWHM |
CATALOGUES FROM OTHER DATA PROVIDERS
2WHSP: A multi-frequency selected catalogue of high energy and very high energy gamma-ray blazars and blazar candidates
- Release: 2.0 (2017)
- Reference: Chang, D., et al., 2017, A&A, 598, 17
A multi-frequency selected catalogue of high energy and very high energy gamma-ray blazars and blazar candidates (2WHSP). This catalogue contains the largest and most complete list of High Synchrotron Peaked blazars (HSPs) available to date (in 2017), which is an expansion of the 1WHSP catalog of gamma-ray source candidates off the Galactic plane. A number of multi-wavelength surveys (in the radio, infrared and X-ray bands) have been cross-matched and applied selection criteria based on the radio to IR and IR to X-ray spectral slopes.
This table comprises the 2WHSP catalog, a multi-frequency catalog of HSP. It contains 1691 sources, 288 of which are newly identified HSPs, 540 are previously known HSPs, 814 are HSP candidates, 45 are HSP blazars taken from the 2FHL catalog, and 4 from TeVCat (http://tevcat.uchicago.edu).
Additional information can be found here.
Akari IRC Point Source Catalogue
- Release: 1.0 (2010)
- Date of observations: from May 2006 to August 2007
- Source: ISAS JAXA
- Reference: Ishihara, D., et al., 2010, A&A, 514, A1
The AKARI IRC Point Source Catalogue Version 1.0 provides positions and fluxes of 870,973 sources (844,649 sources in 9 micron band and 194,551 sources in 18 micron band) in the Mid-Infrared wavelengths.
The IRC scanned 96 / 97 percent of the entire sky in 9 / 18 micron band twice or more during the 16 months of the cryogenic mission phase. The Point Source Catalogue is the primary catalogue from the AKARI IRC survey. The catalogue is designed to have a uniform detection limit over the entire sky, based on the uniform source detection limit per scan observation. Redundant observations are used to increase the reliability of the detection.
The AKARI IRC Release Note documentation can be found here.
| Column name | Units | Description |
|---|---|---|
| Name | - | Name of source |
| Right Ascension | hh mm ss.ss | Right ascension of source (J2000) |
| Declination | dd mm ss.s | Declination of source (J2000) |
| Flux S9W | Jy | Flux density in S9W |
| Flux S9W error | Jy | Flux error in S9W |
| Flux L18W | Jy | Flux density in L18W |
| Flux L18W error | Jy | Flux error in L18W |
| Flag S9W | - | Bit flags data quality for S9W: Values are expressed in Hexadecimal format. 1: Period between first and last detection is less than a month 2: Saturated (not currently used) 4: use SAA (not currently used) 8: use edge events, flux underestimated |
| Flag L18W | - | Bit flags data quality for L18W: Values are expressed in Hexadecimal format. 1: Period between first and last detection is less than a month 2: Saturated (not currently used) 4: use SAA (not currently used) 8: use edge events, flux underestimated |
| Extended Flag S9W | - | Extended source flag for S9W: Set to 1 if MEAN_AB09 > 15.6 arcsec |
| Extended Flag L18W | - | Extended source flag for L18W: Set to 1 if MEAN_AB18 > 15.6 arcsec |
| Number of S9W Events | - | Number of events contributing to FLUX S9W |
| Number of L18W Events | - | Number of events contributing to FLUX L18W |
AllWISE SOURCE catalog
- Release: 1.0 (2013)
- Date of observations: from 2010 to 2011
- Source: Infrared Processing and Analysis Center (IPAC)
- Reference: Wright et al. 2010, Mainzer et al. 2011
The AllWISE Source Catalog provides astrometry and mid-infrared photometry in four bands (3.4, 4.6, 12 and 22 microns) for 747,634,026 objects detected on the deep AllWISE Atlas Intensity Images. It improves the photometry of discrete sources in all four bands with respect to the WISE Catalog. In addition, improved source variability metrics have been computed. Astrometry has also been improved thanks to the correction of the proper motion of the reference 2MASS stars for the 11 years between the two surveys.
The table below shows the columns of the AllWISE catalogue displayed by default in ESASky (more columns can be displayed via the settings button):
| Column name | Units | Description |
|---|---|---|
| Name | - | Name of source |
| RA (J2000) | hh mm ss.ss | Right ascension of source (J2000) |
| Dec (J2000) | dd mm ss.s | Declination of source (J2000) |
| ΔRA | arcsec | Error in right ascension |
| ΔDec | arcsec | Error in declination |
| W1 mag | mag | W1-band magnitude |
| ΔW1 mag | mag | Error in W1-band magnitude |
| W2 mag | mag | W2-band magnitude |
| ΔW2 mag | mag | Error in W2-band magnitude |
| W3 mag | mag | W3-band magnitude |
| ΔW3 mag | mag | Error in W3-band magnitude |
| W3 mag | mag | W3-band magnitude |
| ΔW4 mag | mag | Error in W4-band magnitude |
Refer to this page for more information on the WISE survey and this catalog.
CHANDRA SOURCE CATALOG (CSC2)
- Release: 2.0 (2019)
- Date of observations: from 1999 to 2014
- Source: Chandra X-Ray Center (CXC)
- Reference: Evans et al. 2010, ApJS 189, 37
The Chandra Source Catalog (CSC) is the definitive catalog of X-ray sources detected by the Chandra X-ray Observatory. By combining Chandra's sub-arcsecond on-axis spatial resolution and low instrumental background with consistent data processing, the CSC delivers a wide variety of uniformly calibrated properties and science ready data products for detected sources over four decades of flux. The second major release of the catalog, CSC 2.0, includes measured properties for 317,167 unique compact and extended X-ray sources in the sky, allowing statistical analysis of large samples, as well as individual source studies. Extracted properties are provided for 928,280 individual observation detections identified in 10,382 Chandra ACIS and HRC-I imaging observations released publicly through the end of 2014. CSC 2.0 includes—as an "alpha" release—photometric properties for 1,299 highly extended (≳30″) sources, together with surface brightness polygons for several contour levels. All can be retrieved, together with the full list of parameters available in the full catalog for each source, using CSCview. Go here for more information on the CSC.
| Column name | Units | Description |
|---|---|---|
| Name | - | Name of source |
| RA | hh mm ss.ss | Right ascension of source (J2000) |
| Dec | dd mm ss.s | Declination of source (J2000) |
| Flux ACIS | erg·cm-2·s-1 | ACIS broad band, b (0.5-7.0 keV), aperture-corrected net energy flux inferred from the source region aperture, best estimate derived from the longest block of a multi-band, flux-ordered Bayesian Block analysis of the contributing observations, and calculated by counting X-ray events (column also called flux_aper_b). |
| Lower Flux ACIS | erg·cm-2·s-1 | Lower 1 sigma (68.2%) Flux ACIS broad band, b (0.5-7.0 keV) confidence limit (column also called flux_aper_lolim_b). |
| Upper Flux ACIS | erg·cm-2·s-1 | Upper 1 sigma (68.2%) Flux ACIS broad band, b (0.5-7.0 keV) confidence limit (column also called flux_aper_hilim_b). |
| Flux HRC | erg·cm-2·s-1 | HRC wide band, w (~0.1-10.0 keV), aperture-corrected net energy flux inferred from the source region aperture, best estimate derived from the longest block of a multi-band, flux-ordered Bayesian Block analysis of the contributing observations, and calculated by counting X-ray events (column also called flux_aper_w). |
| Lower Flux HRC | erg·cm-2·s-1 | Lower 1 sigma (68.2%) Flux HRC wide band, w (~0.1-10.0 keV), confidence limit (column also called flux_aper_lolim_w) |
| Upper Flux HRC | erg·cm-2·s-1 | Upper 1 sigma (68.2%) Flux HRC wide band, w (~0.1-10.0 keV), confidence limit (column also called flux_aper_hilim_w) |
| Average Flux ACIS | erg·cm-2·s-1 | Aperture-corrected net energy flux inferred from the source region aperture, averaged over all contributing observations, and calculated by counting X-ray events; ACIS broad (0.5-7.0 keV) energy band (column also called flux_aper_avg_b). |
| Average Lower Flux ACIS | erg·cm-2·s-1 | Lower 1 sigma (68.2%) average Flux ACIS broad band, b (0.5-7.0 keV), confidence limit (column also called flux_aper_avg_lolim_b). |
| Average Upper Flux ACIS | erg·cm-2·s-1 | Upper 1 sigma (68.2%) average Flux ACIS broad band, b (0.5-7.0 keV), confidence limit (column also called flux_aper_avg_hilim_b). |
| Average Flux HRC | erg·cm-2·s-1 | Aperture-corrected net energy flux inferred from the source region aperture, averaged over all contributing observations, and calculated by counting X-ray events; HRC wide (~0.1-10.0 keV) energy band (column also called flux_aper_avg_w). |
| Average Lower Flux HRC | erg·cm-2·s-1 | Lower 1 sigma (68.2%) average Flux HRC wide band, w (~0.1-10.0 keV), confidence limit (column also called flux_aper_avg_lolim_w). |
| Average Upper Flux HRC | erg·cm-2·s-1 | Upper 1 sigma (68.2%) average Flux HRC wide band, w (~0.1-10.0 keV), confidence limit (column also called flux_aper_avg_hilim_w). |
| Major radius of error ellipse | arcsec | Major radius of the 95% confidence level position error ellipse (column also called err_ellipse_r0). |
| Minor radius of error ellipse | arcsec | Minor radius of the 95% confidence level position error ellipse (column also called err_ellipse_r1). |
| Position angle error ellipse | degrees | Position angle (referenced from local true north) of the major axis of the 95% confidence level error ellipse (column also called err_ellipse_ang). |
| Highest Flux Significance | - | Highest flux significance across all stacked observations and science energy bands (column also called significance). |
| Likelihood | - | Highest detection log-likelihood across all stacked observations and science energy bands (column also called likelihood). |
| Likelihood Classification | - | Highest detection likelihood classification across all stacked observations and science energy bands (column also called likelihood_class). |
| Confusion Flag | - | Source may be confused (source and/or background regions overlap in one or more contributing stacked observations; column also called conf_flag). |
| Extent Flag | - | Source is extended, or deconvolved source extent is inconsistent with a point source at the 90% confidence level in one or more observations and science energy bands (column also called extent_flag). |
| Source Saturation Flag | - | Source is saturated in all observations; source properties are unreliable (column also called sat_src_flag). |
| Source Streak Flag | - | Source is located on an ACIS readout streak in all observations; source properties may be affected (column also called streak_src_flag). |
| Variability Flag | - | Source displays flux variability within one or more observations, or between observations, in one or more energy bands (column also called var_flag). |
| Hardness Ratio Variability Flag | - | Source hardness ratios are statistically inconsistent between two or more observations (column also called var_inter_hard_flag). |
| Hard-Medium Hardness Ratio | - | ACIS hard (2.0-7.0 keV) - medium (1.2-2.0 keV) energy band hardness ratio (column also called hard_hm). |
| Lower Hard-Medium Hardness Ratio | - | ACIS hard (2.0-7.0 keV) - medium (1.2-2.0 keV) energy band hardness ratio (68% lower confidence limit; column also called hard_hm_lolim). |
| Upper Hard-Medium Hardness Ratio | - | ACIS hard (2.0-7.0 keV) - medium (1.2-2.0 keV) energy band hardness ratio (68% upper confidence limit; column also called hard_hm_hilim). |
| Medium-Soft Hardness Ratio | - | ACIS medium (1.2-2.0 keV) - soft (0.5-1.2 keV) energy band hardness ratio (column also called hard_ms). |
| Lower Medium-Soft Hardness Ratio | - | ACIS medium (1.2-2.0 keV) - soft (0.5-1.2 keV) energy band hardness ratio (68% lower confidence limit; column also called hard_ms_lolim). |
| Upper Medium-Soft Hardness Ratio | - | ACIS medium (1.2-2.0 keV) - soft (0.5-1.2 keV) energy band hardness ratio (68% upper confidence limit; column also called hard_ms_hilim). |
| ACIS Intra-Obs Variability Index | - | Intra-observation Gregory-Loredo variability index in the range [0, 10] for the ACIS broad band, b (0.5-7.0 keV). A low value indicates that the source region photon flux is constant between observations whereas a high value indicates that the source is very likely to be variable (column also called var_intra_index_b). |
| HRC Intra-Obs Variability Index | - | Intra-observation Gregory-Loredo variability index in the range [0, 10] for the wide band, w (~0.1-10.0 keV). A low value indicates that the source region photon flux is constant within an observation (highest value across all observations), whereas a high value indicate that flux is variable within the observation (column also called var_intra_index_w). |
| ACIS Inter-Obs Variability Index | - | Inter-observation variability index in the range [0, 10]: indicates whether the source region photon flux is constant between observations for the broad band, b (0.5-7.0 keV; column also called var_inter_index_b). |
| HRC Inter-Obs Variability Index | - | Inter-observation variability index in the range [0, 10]: indicates whether the source region photon flux is constant between observations for the wide band, w (~0.1-10.0 keV; column also called var_inter_index_w). |
| Hard-Medium Hardness Ratio Variability Prob | - | Inter-observation ACIS hard (2.0-7.0 keV) - medium (1.2-2.0 keV) energy band hardness ratio variability probability, which indicates whether the source is spectrally variable when these two bands are considered (column also called var_inter_hard_prob_hm). |
| Medium-Soft Hardness Ratio Variability Prob | - | Inter-observation ACIS medium (1.2-2.0 keV) - soft (0.5-1.2 keV) energy band hardness ratio variability probability, which indicates whether the source is spectrally variable when these two bands are considered (column also called var_inter_hard_prob_ms) |
| ACS Time | seconds | Total livetime for all ACIS imaging observations contributing to the Master Sources Table record of the source (column also called acs_time). |
| HRC Time | seconds | Total livetime for all HRC imaging observations contributing to the Master Sources Table record of the source (column also called hrc_time). |
eROSITA CATALOGUES
The following catalogues from eROSITA are included in ESASky: eFEDS main, eFEDS hard, etaCha main, etaCha hard.
eFEDS main catalogue
- Release: EDR (2021)
- Date of observations: 3-7 November 2019
- Source: eROSITA EDR catalogues
-
Reference: Brunner et al. 2022, A&A, 661, 1
The eROSITA X-ray telescope on board the Spectrum-Poentgen-Gamma (SPG) observatory combines a large field of view and a large collecting area in the energy range between ~0.2 and ~8.0 keV. This gives the telescope the capability to perform uniform scanning observations of large sky areas. SRG/eROSITA performed scanning observations of the ~140 square degree eROSITA Final Equatorial Depth Survey field (the eFEDS field) as part of its performance verification phase ahead of the planned four year of all-sky scanning operations. The observing time of eFEDS was chosen to slightly exceed the depth expected in an equatorial field after the completion of the all-sky survey. While verifying the capability of eROSITA to perform large-area uniform surveys and saving as a test and training dataset to establish calibration and data analysis procedures, the eFEDS survey also constitutes the largest contiguous soft X-ray survey at this depth to date, supporting a range of early eROSITA survey science investigations.
The eFEDS main catalogue contains X-ray sources detected in the 0.2-2.3 keV band using eSASS adopting a detection likelihood threshold of 5. The sources with detection likelihood larger than 6 are selected as the main eFEDS catalog (27910 sources). For more information see Brunner et al. 2022.
eFEDS hard catalogue
- Release: EDR (2021)
- Date of observations: 3-7 November 2019
- Source: eROSITA EDR catalogues
-
Reference: Brunner et al. 2022, A&A, 661, 1
The eROSITA X-ray telescope on board the Spectrum-Poentgen-Gamma (SPG) observatory combines a large field of view and a large collecting area in the energy range between ~0.2 and ~8.0 keV. This gives the telescope the capability to perform uniform scanning observations of large sky areas. SRG/eROSITA performed scanning observations of the ~140 square degree eROSITA Final Equatorial Depth Survey field (the eFEDS field) as part of its performance verification phase ahead of the planned four year of all-sky scanning operations. The observing time of eFEDS was chosen to slightly exceed the depth expected in an equatorial field after the completion of the all-sky survey. While verifying the capability of eROSITA to perform large-area uniform surveys and saving as a test and training dataset to establish calibration and data analysis procedures, the eFEDS survey also constitutes the largest contiguous soft X-ray survey at this depth to date, supporting a range of early eROSITA survey science investigations.
The Hard X-ray selected eFEDS catalogue contains sources detected in three bands (1: 0.2-0.6; 2: 0.6-2.3; 3: 2.3-5 keV) using eSASS adopting a detection likelihood threshold of 5. The sources with a 2.3-5 keV band detection likelihood greater than 10 and a zero extent likelihood were selected as the hard eFEDS catalogue (246 sources). For more information see Brunner et al. 2022.
eta Chamaeleontis main catalogue
- Release: EDR (2021)
- Date of observations: 16-18 November 2019
- Source: eROSITA EDR catalogues
-
Reference: Robrade et al. 2022, A&A, 661, 34
The eta Cha main catalogue is a catalogue of X-ray sources in the eta Chamaeleontis field scan observation (OBSID 300004). The nearby young open cluster eta Chamaeleontis was observed by eROSITA/SRG during its CalPV phase for 150 ks. The eROSITA data were taken in the field-scan mode, an observing mode of Spectrum-Roentgen-Gamma (SRG) that follows a rectangular grid-like pattern, here covering a 5x5 deg field with an exposure depth of about 5 ks. The known members were studied in X-rays and potential new members of the anticipated dispersed low-mass cluster population were searched for. For more information see Robrade et al. (2022).
eta Chamaeleontis hard catalogue
- Release: EDR (2021)
- Date of observations: 16-18 November 2019
- Source: eROSITA EDR catalogues
-
Reference: Robrade et al. 2022, A&A, 661, 34
The eta Cha hard catalogue is a catalogue of hard X-ray sources in the eta Chamaeleontis field scan observation (OBSID 300004). The nearby young open cluster eta Chamaeleontis was observed by eROSITA/SRG during its CalPV phase for 150 ks. The eROSITA data were taken in the field-scan mode, an observing mode of Spectrum-Roentgen-Gamma (SRG) that follows a rectangular grid-like pattern, here covering a 5x5 deg field with an exposure depth of about 5 ks. The known members were studied in X-rays and potential new members of the anticipated dispersed low-mass cluster population were searched for. For more information see Robrade et al. (2022).
FERMI CATALOGUES
The following catalogues from the Fermi mission are included in ESASky: 4FGL-DR2, 3FHL, 4LAC-DR2.
fermi large area telescope FOURTH SOURCE CATALOG - DATA RELEASE 2 (4FGL-DR2)
- Release: 4FGL-DR2 (2020)
- Date of observations: From 4 August 2008 to 2 August 2018
- Source: Fermi-LAT webpage
-
Reference: Abdollahi et al. 2020, Ballet et al. 2020
The Large Area Telescope (LAT) on board NASA's Fermi Gamma-ray Space Telescope was launched in June 2008 and surveys the entire sky every day. The Fermi Large Area Telescope Fourth Source Catalog (4FGL-DR2) presents 5,064 sources in the 50 MeV-1 TeV energy range. For more information go to the paper above or visit the Fermi-LAT webpage.
THIRD FERMI-LAT CATALOG OF HIGH-ENERGY SOURCES (3FHL)
- Release: 3FHL (2017)
- Date of observations: 2008 to 2015
- Source: Fermi-LAT webpage
-
Reference: Fermi-LAT collaboration 2017
The Third Catalog of Hard Fermi-LAT Sources (3FHL) reports the locations and spectra of sources significantly detected in the 10 GeV – 2 TeV energy range during the first 7 years of the Fermi mission using the Pass 8 event-level analysis. It contains 1556 objects characterized in the 10 GeV - 2 TeV energy range. For more information go to the paper above or visit the Fermi-LAT webpage.
Fourth Catalog of Active Galactic Nuclei detected by the LAT - data release 2 (4lac-dr2)
- Release: 4LAC-DR2 (2020)
- Date of observations: From 4 August 2008 to 2 August 2018
- Source: Fermi-LAT webpage
-
Reference: Ajello et al. 2020, Lott et al. 2020
The fourth catalog of active galactic nuclei (AGNs) detected by the Fermi Gamma-ray Space Telescope Large Area Telescope (4LAC) contains 2863 objects located at high Galactic latitudes derived from the 4FGL catalog.
GLADE+ Galaxy Catalog
- Release: GLADE+ (2022)
- Date of observations: from ###24 October 2011 to 27 May 2020
- Source: GLADE+
- Reference: Dálya et al. (2022) MNRAS, 514, 1403
GLADE+ is an extended version of the GLADE galaxy catalog for multimessenger searches with advanced gravitational-wave detectors. GLADE+ combines data from six separate but not independent astronomical catalogues: the GWGC, 2MPZ, 2MASS XSC, HyperLEDA, and WISExSCOSPZ galaxy catalogues, and the SDSS-DR16Q quasar catalogue. GLADE+ contains ~22.5 million galaxies and ~750,000 quasars. GLADE+ is complete up to a luminosity distance of ~44 Mpc in terms of the cumulative B-band luminosity of galaxies, and contains all of the brightest galaxies giving half of the total B-band luminosity up to ~95 Mpc. Considering the brightest galaxies giving half of the total luminosity in the W1-band, GLADE+ has nearly 90% completeness at even ~500 Mpc. Stellar masses and binary neutron star mergers for galaxies with W1 magnitudes have been derived. These parameters can help to rank the galaxies in a given gravitational wave localization volume, thereby possibly reducing the number of pointings and the total integration time needed to find the electromagnetic counterpart. The codes used for the stellar mass and and merger rate calculations can be found on Github. For more information see Dálya et al. (2022) and the GLADE+ website.
IceCube All-Sky Point-Source Events Catalog (2008 - 2018)
- Release: 1.0 (2021)
- Date of observations: from 2008 to 2018
- Source: IceCube Neutrino Observatory
- Reference: https://arxiv.org/abs/2101.09836 and IceCube collaboration 2020
IceCube has performed several searches for point-like sources of neutrinos. The events contained in the IceCube All-Sky Point-Source Events Catalog (2008 - 2018; Icecubepsc) make up the sample used in IceCube's 10-year time-integrated neutrino point source search. Events in the sample are track-like neutrino candidates detected by IceCube between April 2008 and July 2018.
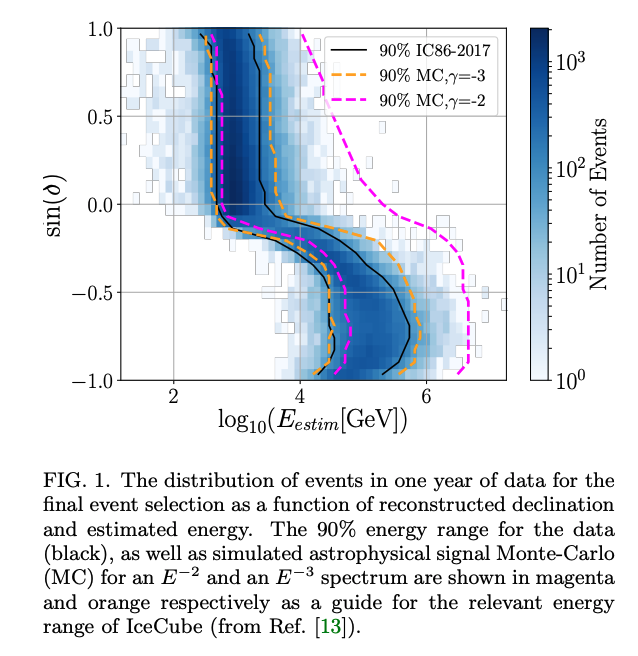
IMPORTANT NOTE: ESASky displays fewer events than those available in the IceCube All-Sky Point-Source Events Catalog in order to show a less crowded display. An energy cut has been applied to the data to remove most of the lower energy events, therefore, ESASky display events with energies of E>104 GeV in the Northern hemisphere and events with energies of E>105.8 GeV in the Southern hemisphere (approximately the top 1% events in energy; 26706 neutrino candidate events). See the below figure from the Icecube Collaboration (2021) publication (https://arxiv.org/abs/2101.09836) showing the distribution of events as a function of reconstructed declination and event energy:
For more information on the IceCube All-Sky Point-Source Events Catalog and to download the whole catalog (1.1 million events) please go to this page.
The table below shows the columns of the IceCube All-Sky Point-Source Events Catalog displayed by default in ESASky (more columns can be displayed via the settings button):
| Column name | Units | Description |
|---|---|---|
| Event Number | - | Name of source |
| RA (J2000) | hh mm ss.ss | Right ascension |
| Dec (J2000) | hh mm ss.ss | Declination |
| Error Radius | degrees | Positional Uncertainty |
| Event Time | YYYY-MM-DD hh:mm:ss.ss | Date/Time of the event |
| Event Energy | GeV | Reconstructed Energy of the Observed Muon Track |
LAMOST GENERAL catalogs (LAMOST DR9)
- Release: 9.0 (2023)
- Date of observations: from 24 October 2011 to 30 June 2021
- Source: LAMOST
- Reference: LAMOST DR9 Release Note
The Large Sky Area Multi-Object Fiber Spectroscopic Telescope (LAMOST) is a Chinese national scientific research facility operated by the National Astronomical Observatories, Chinese Academy of Sciences. It is a special reflecting Schmidt telescope with 4000 fibers in a field of view of 20 degrees. The LAMOST survey, initiated in 2012, provides flux - and wavelength-calibrated, sky-subtracted spectra in the wavelength range of 3700-9000 angstroms with a resolution of 1800 at 5500 angstroms for many types of astronomical objects. Since October 2018, LAMOST started the second stage survey program containing both low- and medium-resolution spectroscopic surveys, and the medium-resolution spectroscopic survey includes two surveys, i.e., the time-domain and the non time-domain surveys.
The ninth LAMOST data release (LAMOST DR9) includes observations until June 2021. The Low-Resolution spectroscopic survey (LRS) General Catalog contains 11,211,028 spectra, of which 10,893,354 are stars, 241,454 are galaxies, and 76,220 are QSOs. The Medium-Resolution spectroscopic survey (MRS) General Catalog contains 8,259,362 spectra, where there are 1,846,438 and 6,412,924 spectra for the non time-domain and time-domain surveys, respectively.
The following columns have been included in ESASky:
| Column name | Units | Description |
|---|---|---|
| Name | - | Target name |
| RA (J2000) | hh mm ss.ss | Right ascension of fiber pointing (J2000) |
| Dec (J2000) | dd mm ss.s | Declination of fiber pointing (J2000) |
| Observation ID | - | Observation ID |
| obsDate | yyyy-mm-dd | Target Observation Date |
| Class | - | Stellar spectral type |
| Subclass | - | Stellar subclass |
| Z | - | Redshift |
| Z Error | - | Redshift uncertainty |
| SNR U | - | Signal-to-noise ratio of u filter |
| SNR G | - | Signal-to-noise ratio of g filter |
| SNR R | - | Signal-to-noise ratio of r filter |
| SNR I | - | Signal-to-noise ratio of i filter |
| SNR Z | - | Signal-to-noise ratio of z filter |
| Mag Type | - | Target magnitude type |
| Mag 1 | mag | Associated magnitude 1 |
| Column name | Units | Description |
|---|---|---|
| Name | - | Target name |
| RA (J2000) | hh mm ss.ss | Right ascension of fiber pointing (J2000) |
| Dec (J2000) | dd mm ss.s | Declination of fiber pointing (J2000) |
| Observation ID | - | Observation ID |
| obsDate | yyyy-mm-dd | Target Observation Date |
| Band | - | Having two values of B and R, which represent B and R band spectra |
| snr | - | The median value of all pixel S/Ns in B band spectrum or R band |
| Radial Velocity R band | km/s | Radial velocity of R band spectra measured with 483 selected KURUCZ synthetic templates |
| Radial Velocity B band | km/s | Radial velocity of B band spectra measured with 483 selected KURUCZ synthetic templates |
In addition to the LRS and MRS General Catalogs, LAMOST DR9 provides many other catalogs, including stellar parameter catalogs, the Observed Plate Information Catalog, the Input Catalog and others. For now, these catalogs have not been integrated in ESASky. Refer to the LRS and MRS data product description pages for more information on this data release.
open universe for blazars V2.0
- Release: 2.0 (2019)
- Reference: Chang, Y. L. et al., 2020, A&C, 3000, 350, Giommi, P. et al., 2019, A&A, 631, 116
Open Universe for Blazars relies on a master list of blazars. The second version of this list was assembled by combining the 5BZCAT, the 3HSP, and the Fermi 4LAC catalogue.
For more information visit the Open Universe for Blazars webpage.
The second ROSAT all-sky survey source catalogue (2RXS)
- Release: 2.0 (2016)
- Date of observations: from June 1990 to August 1991
- Source: Max Planck Institute for Extraterrestrial Physics
- Reference: Boller et al. 2016
The second ROSAT all-sky survey source catalogue (2RXS) is the second publicly released ROSAT catalogue of point-like sources obtained from the ROSAT all-sky survey (RASS) observations performed with the position-sensitive proportional counter (PSPC) between June 1990 and August 1991, and is an extended and revised version of the bright and faint source catalogues. Utilizing the latest RASS processing, this catalog includes more than 135,000 X-ray detections in the 0.1-2.4 keV energy band down to a likelihood threshold of 6.5.
Additional information can be found here.
TWO-Micron All-Sky Survey (2MASS) catalog of point sources
- Release: All-sky (2003)
- Date of observations: from 1997 to 2001
- Source: Infrared Processing and Analysis Center (IPAC)
- Reference: Cutri et al. 2003
The Two-Micron All Sky Survey (2MASS) covered 99.998% of the sky in three near-infrared bands, J, H and Ks. The 2MASS Point Source Catalog (PSC) contains positional and photometric information for 470,992,970 point sources. Sources in this catalogue are detected in at least one band with S/N higher than 7, or in all three bands with S/N higher than 5. In addition, the source position must fulfil some conditions to ensure it is not a spurious detection or there is confusion between sources.
The table below shows the columns of the 2MASS catalogue displayed in ESASky (more columns can be displayed via the settings button):
| Column name | Units | Description |
|---|---|---|
| Name | - | Name of source |
| RA (J2000) | hh mm ss.ss | Right ascension of source (J2000) |
| DEC (J2000) | dd mm ss.s | Declination of source (J2000) |
| J mag | mag | J-band magnitude |
| ΔJ mag | mag | Error in J-band magnitude |
| H mag | mag | H-band magnitude |
| ΔH mag | mag | Error in H-band magnitude |
| Ks mag | mag | Ks-band magnitude |
| ΔKs mag | mag | Error in Ks-band magnitude |
See the IPAC 2MASS documentation for more details on this catalogue.
Legacy archive (HIPPARCOS):
The Hipparcos Catalogue (118,218 stars with 1 milliarcsec level astrometry) and the Tycho Catalogue (more than one million stars with 20-30 milliarcsec astrometry and two-colour photometry) were completed in August 1996 and its data products were released in June 1997. Further improved catalogues were made available to the science community later. This Galaxy charter mission has produced four major catalogues referred to as the Hipparcos-1 Catalogue, the Tycho-1 Catalogue, the Hipparcos-2 Catalogue, and the Tycho-2 Catalogue.
These are the 42 Hipparcos data products (catalogues and annexes) currently available via the ESASky legacy TAP query as a self-standing catalogue collection, providing a single unified method of accessing all Hipparcos/Tycho data products and their successors. You can access them using the Topcat tool, selecting the option "Table Access Protocol (TAP) Query" in the VO menu, and introducing the TAP url in the "Select Service" pane.
The summary of the 42 data products (or 59 tables) is shown in Table 1. Hipparcos-1 data products are complete except for identification charts and light-curve figures which can be found in the file Hip1-CDROMs-Volume17.zip in the HIPPARCOS_PUBLIC_DATA area on the ftp.cosmos.esa.int ftp server. Tycho-1 has been completed with the Epoch Photometry Annex B, and Hipparcos-2 and Tycho-2 with Intermediate Astrometry data products. The latter is considered an extension, as these data had never been published before. The Tycho Slit Response Functions (SRFs) that have been used in the Tycho-2 data processing can be found here and are described here.
Source:
Most tables have been obtained from the CDS/VizieR TAP service, where column labels and descriptions underwent curation by CDS/VizieR. The tables in boldface were downloaded from the VizieR ftp instead of TAP service. The data models for hipparcos1 tables #3-#6 were also obtained from the VizieR ftp (so they include CDS metadata curation), including as metadata descriptions both explanations and corresponding notes. For 14 tables, we constructed the corresponding data model from the original documentation, using the original Hipparcos column label naming convention and including as metadata descriptions the original Hipparcos explanations.
Since the Tycho-1 Epoch Photometry - Annex B data hosted at CDS/Vizier was severely corrupted, two tables in data product #32 marked with an asterisk) were recovered from original CD-ROMs kindly provided by Claus Fabricius, member of the Tycho consortium. Although still presenting a partial loss of the original data, fewer data records are affected by corruption.
Data products #19, #21, #22, #23, #29, #30, #31 and #36 were tables originally stacked together in rows mixing header and data records. For the sake of database ingestion, these data products have been split in their basic table structures, and the legacy_astro TAP serves them individually. Unique keys allow connecting the records back together.
Hipparcos-2 data products #25-#29 are served in two versions: a CDS/VizieR version (namespace hipparcos2_cds) and a Springer book DVD version (namespace hipparcos2_dvd). Hipparcos-2 intermediate astrometry is only available on the DVD and it is important that these intermediate data are only used together with the astrometric reference parameters coming from the main tables from the same DVD. The raw contents of the DVD can be found in the file Hip2-DVD-Book.zip in the HIPPARCOS_PUBLIC_DATA area on the ftp.cosmos.esa.int ftp server.
Metadata:
-
Sky coordinates RAdeg, DEdeg are provided in ICRS system in units of degrees, with epoch J1991.25 (average observing time for the Hipparcos mission), except for the Tycho-2 Intermediate Astrometry (J1992.0) and the Double Star Catalogue and Supplement and the Two-colour Photometry for Components of Hipparcos Doubles Catalogue, at observation epoch J2000.0.
-
Currently, our Legacy Archive TAP server does not preserve the data precision for trailing zeroes. To retrieve the table precision information, please refer to the original table data model section and table number in Hipparcos Vol 1: Introduction and Guide to the Data, provided in column #8
-
Question marks in the table descriptions are equivalent to dagger in the table data model shown in the documentation, meaning blank for undefined values.
-
Asterisk at the beginning of the column description and numbers in brackets at the end of descriptions refer to Notes in the Hipparcos Vol 1: Introduction and Guide to the Data
-
The original hipparcos1.hipoint and hipparcos1.hipjtran records have several occurrences of type overflow that have been replaced by "null" values.
-
For 6 Tycho tables, a Tycho identifier (ID) was created as an aggregate of the TYC numbers. It is constructed from the GSC region number (TYC1)[1,9537], the running number within the region (TYC2)[1,12119], and a component identifier (TYC3)[1,4], separated by a hyphen between them, e.g. TYC 1-13-1.
|
Data product # |
Catalogue |
Table Name |
Title |
Records |
Columns |
Data Model Reference |
|
1 |
Hipparcos-1 |
hipparcos1.hip_main |
The Hipparcos Main Catalogue |
118,218 |
78 |
S2.1, T2.1.1 |
|
2 |
Hipparcos-1 |
hipparcos1.h_dm_com |
Double and Multiples: Component solutions, Components |
24,588 |
38 |
S2.3, T2.3.2a |
|
3 |
Hipparcos-1 |
hipparcos1.h_dm_cor |
Double and Multiples: Component solutions, Correlations |
12,591 |
14 |
S2.3, T2.3.2b |
|
4 |
Hipparcos-1 |
hipparcos1.hip_dm_g |
Double and Multiples: Acceleration solutions |
2,622 |
15 |
S2.3, T2.3.3 |
|
5 |
Hipparcos-1 |
hipparcos1.hip_dm_v |
Double and Multiples: Variability Induced (VIM) solutions |
288 |
14 |
S2.3, T2.3.5 |
|
6 |
Hipparcos-1 |
hipparcos1.hip_dm_x |
Double and Multiples: Stochastic solutions |
1,561 |
5 |
S2.3, T2.3.6 |
|
7 |
Hipparcos-1 |
hipparcos1.him_dm_o |
Double and Multiples: Orbital solutions |
235 |
19 |
S2.3, T2.3.4a |
|
8 |
Hipparcos-1 |
hipparcos1.hip_va_1 |
Variability Annex: Periodic variables |
2,712 |
24 |
S2.4, T2.4.2 |
|
9 |
Hipparcos-1 |
hipparcos1.hip_va_2 |
Variability Annex: Unsolved variables |
5,542 |
22 |
S2.4, T2.4.2 |
|
10 |
Hipparcos-1 |
hipparcos1.solar_ha |
Solar System Annex: Astrometric catalogue |
5,609 |
10 |
S2.7, T2.7.5 |
|
11 |
Hipparcos-1 |
hipparcos1.solar_hp |
Solar System Annex: Photometric catalogue |
2,639 |
10 |
S2.7, T2.7.6 |
|
12 |
Hipparcos-1 |
hipparcos1.solar_t |
Solar System Annex: Tycho astrometry/photometry |
291 |
16 |
S2.7, T2.7.7 |
| 13 | Hipparcos-1 |
hipparcos1.hd_notes |
Hipparcos notes: Double and multiple systems | 2,622 | 7 | S2.11, T2.11.2 |
| 14 | Hipparcos-1 |
hipparcos1.hg_notes |
Hipparcos notes: General notes | 3,898 | 7 | S2.11, T2.11.2 |
| 15 | Hipparcos-1 |
hipparcos1.hp_notes |
Hipparcos notes: Photometric notes | 2,444 | 7 | S2.11, T2.11.2 |
| 16 | Hipparcos-1 | hipparcos1.hp_refs | References Hipparcos stars | 33,769 | 5 | S2.11, T2.11.2 |
| 17 | Hipparcos-1 |
hipparcos1.hp_auth |
References of hp_notes.doc | 4,335 | 3 | S2.11, T2.11.2 |
| 18 | Hipparcos-1 |
hipparcos1.dmsa_o |
References of hip_dm_o.dat | 118 | 5 | S2.3, T2.3.4b |
|
19 |
Hipparcos-1 |
hipparcos1.hip_i |
Hipparcos Intermediate Astrometry |
118,204 |
11 |
S2.8, T2.8.2 |
|
hipparcos1.hipabsc |
Hipparcos Intermediate Astrometry: Abcissa record |
7,226,006 |
12 |
S2.8, T2.8.3 |
||
|
20 |
Hipparcos-1 |
hipparcos1.hip_rgc |
Hipparcos Intermediate Astrometry: Reference great circle |
2,341 |
8 |
S2.8, T2.8.1 |
|
21 |
Hipparcos-1 |
hipparcos1.hip_j |
Hipparcos Transit Data |
37,368 |
15 |
S2.9, T2.9.1 |
|
hipparcos1.hipoint |
Hipparcos Transit Data: Pointing record |
37,368 |
29 |
S2.9, T2.9.2 |
||
|
hipparcos1.hipjtran |
Hipparcos Transit Data: Transit record |
4,276,420 |
21 |
S2.9, T2.9.3 |
||
|
22 |
Hipparcos-1 |
hipparcos1.hip_ep |
Hipparcos Epoch Photometry Annex |
118,204 |
15 |
S2.5, T2.5.1 |
|
hipparcos1.hiptrans |
Hipparcos Epoch Photometry Annex: Transit record |
13,724,288 |
6 |
S2.5, T2.5.2 |
||
|
23 |
Hipparcos-1 |
hipparcos1.hip_ep_e |
Hipparcos Epoch Photometry Annex Extension |
118,204 |
12 |
S2.5, T2.5.3 |
|
hipparcos1.hepetran |
Hipparcos Epoch Photometry Annex Extension: Transit record |
13,724,288 |
10 |
S2.5, T2.5.4 |
||
|
24 |
Hipparcos-1 |
hipparcos1.hip_ep_c |
Hipparcos Epoch Photometry Annex Extension: coincidence |
105,233 |
5 |
S2.5, T2.5.5 |
|
25 |
Hipparcos-2 |
hipparcos2_cds.hip2 hipparcos2_dvd.hip2 |
The Hipparcos Main Catalogue |
117,955 117,955 |
27 |
|
|
26 |
Hipparcos-2 |
hipparcos2_cds.hip7p hipparcos2_dvd.hip2_7p |
Double and Multiples: Seven-parameter solutions |
1,338 1,343 |
7 |
|
|
27 |
Hipparcos-2 |
hipparcos2_cds.hip9p hipparcos2_dvd.hip2_9p |
Double and Multiples: Nine-parameter solutions |
104 102 |
11 |
|
|
28 |
Hipparcos-2 |
hipparcos2_cds.hipvim hipparcos2_dvd.hip2_vim |
Double and Multiples: Variability-induced (VIM) solutions |
25 43 |
7 |
|
| 29 | Hipparcos-2 | hipparcos2_dvd.resrec_header | Hipparcos Intermediate Astrometry - Abcissa residuals: Header records | 117,955 | 9 | Table G.8 in Springer book (ReadMe) |
| hipparcos2_dvd.resrec_data | Hipparcos Intermediate Astrometry - Abcissa residuals: Data records | 13,678,867 | 9 | Table G.8 in Springer book (ReadMe) | ||
| hipparcos2_dvd.absrec_header | Hipparcos Intermediate Astrometry - Field transit records: Header records | 117,955 | 13 | Table G.9 in Springer book (ReadMe) | ||
| hipparcos2_dvd.absrec_data | Hipparcos Intermediate Astrometry - Field transit records: Data records | 13,678,867 | 28 | Table G.9 in Springer book (ReadMe) | ||
|
30 |
Tycho-1 |
tycho1.tyc_main |
The main part of Tycho Catalogue |
1,058,332 |
61 |
S2.2, T2.2.1 |
|
31 |
Tycho-1 |
tycho1.tyc_ep_header |
Tycho Epoch Photometry - Annex A: Header records |
34,446 |
18 |
S2.6, T2.6.1 (Readme) |
|
tycho1.tyc_ep_data |
Tycho Epoch Photometry - Annex A: Individual transit records |
6,760,543 |
18 |
S2.6, T2.6.2 (Readme) |
||
| 32 | Tycho-1 | tycho1.tyc_epo | Tycho Epoch Photometry - Annex B | 508,710 | 6 | I/239/ReadMe (Readme) |
| tycho1.tyc_epo_header* | Tycho Epoch Photometry - Annex B: Header records | 458,089 | 18 | S2.6, T2.6.1 (Readme) | ||
| tycho1.tyc_epo_data* | Tycho Epoch Photometry - Annex B: Individual transit records | 78,778,542 | 18 | S2.6, T2.6.2 (Readme) | ||
|
33 |
Tycho-2 |
tycho2.tyc2 |
The Tycho-2 Main Catalogue |
2,539,913 |
38 |
|
|
34 |
Tycho-2 |
tycho2.suppl_1 |
Tycho-2 Supplement-1 |
17,588 |
24 |
|
|
35 |
Tycho-2 |
tycho2.suppl_2 |
Tycho-2 Supplement-2 |
1,146 |
24 |
|
| 36 | Tycho-2 | tycho2.tyc_sc_header | Tycho Intermediate Astrometry - Sorted Identified Counts: Header records | 574,915,849 | 8 | Tycho2_SortedCounts_ReadMe.txt |
| tycho2.tyc_sc_para | Tycho Intermediate Astrometry - Sorted Identified Counts: Parasite records | 574,915,849 | 15 | Tycho2_SortedCounts_ReadMe.txt | ||
| tycho2.tyc_sc_data | Tycho Intermediate Astrometry - Sorted Identified Counts: Counts records | 574,915,849 | 7 | Tycho2_SortedCounts_ReadMe.txt | ||
|
37 |
Tycho-2 |
tycho2.tdsc_catalogue |
Main Tycho Double Star Catalogue |
98,482 |
38 |
|
|
38 |
Tycho-2 |
tycho2.tdsc_supplem |
Tycho Double Star Catalogue - Supplement |
4,777 |
38 |
|
|
39 |
Tycho-2 |
tycho2.tdsc_notes |
Tycho Double Star Catalogue - Notes |
149 |
5 |
|
|
40 |
Tycho-2 |
tycho2.colorphotds_catalogue |
Two-colour photometry for components of Hipparcos doubles |
9,473 |
15 |
|
| 41 | Tycho-2 | tycho2.tic2 |
Second Tycho Input Catalogue (TIC2) |
4,351,323 | 26 | TIC2_ReadMe.txt |
| 42 | Tycho-2 | tycho2.tic2_lut | Look-up table between Hipparcos/Tycho data products | 3,332,290 | 13 | LUT_ReadMe.txt |
Legacy archive (Cos-B):
-
Magnetic-core, wire-matrix, spark chamber gamma-ray detector (~30 MeV-5 GeV), eff. area 50 cm2 at 400 MeV
-
a 2-12 keV proportional scintillation counter mounted on the side of the gamma-ray detector
-
Extragalactic Gamma Rays
-
Resolved Galactic Sources
-
Gamma-Ray Pulsars
-
Binary Systems
-
Large Scale Galactic Emission
-
Localised Gamma-Ray Sources
The ESA Legacy Archive includes two tables produced by the Cos-B mission. The provenance of these tables is the HEASARC TAP.
|
# |
Resource |
Catalogue |
Records |
Columns |
Table Name |
Data Products |
|
1 |
cosb |
cosb.cosbmaps |
252 |
20 |
Cos-B Map Product Catalog |
datalink column (6 data products) |
|
2 |
cosb |
cosb.cosbraw |
65 |
20 |
Cos-B Photon Events Catalog |
event link column (1 data product) |
High level Products: The Cos-B data products consist of maps obtained from the 65 Cos-B observations made during the entire mission. There are 4 sets of maps per observation, extracted over different energy ranges. These energy ranges are:
- "low" (70-150 MeV),
- "medium" (150-300 MeV),
- "high" (300-5000 MeV),
- and "full" (50-7800 MeV).