
 Sign in
Gaia EDR3 - Structure of the Magellanic Clouds - Gaia
A dive into the Magellanic Clouds
The Magellanic Clouds are two dwarf galaxies orbiting our Milky Way. Being immersed in our own galaxy, there are so many stars to see (especially near the Galactic Centre) that we cannot probe very far in the optical. This makes it hard to see the full picture and to study our own galaxy as a whole. However, the Magellanic Clouds are relatively nearby (in astronomical terms) and are excellent study objects on structure and dynamics of galaxies, especially given their interaction with each other.
Although the Clouds are nearby when compared to most other galaxies in the universe, they are still located at a large distance and, though this presents a challenge for the Gaia astrometry, it also offers a great opportunity to evaluate the quality and properties of the new Gaia EDR3 data.
Astronomers from the Gaia Data Processing and Analysis Consortium (DPAC) have made a first attempt to study the Clouds based on the Gaia EDR3 data with the aim to verify its scientific quality. First a selection is made to isolate the stars of the Large Magellanic Cloud (LMC) and the Small Magellanic Cloud (SMC). A continuous stream of stars travels from the Small Magellanic Cloud to the Large Magellanic Cloud and is referred to as the Magellanic Bridge. The selection is chosen such that also the SMC is partly visible in the LMC selection, thus allowing to study the Magellanic Bridge as well.

Figure 1: The area of selection used for the Large Magellanic Cloud (LMC, left) and the Small Magellanic Cloud (SMC, right). Both regions overlap to allow studying the Magellanic Bridge between the galaxies. Image credit: ESA/Gaia/DPAC – CC BY-SA 3.0 IGO
The improved quality of the astrometry becomes clear from comparing both the parallaxes and proper motions in these areas. In Figure 2 one can find the comparison between Gaia Data Release 2 (Gaia DR2) and the new catalogue, Gaia Early Data Release 3 (Gaia EDR3), for the LMC. The systematic errors in the Gaia astrometry are significantly reduced with respect to Gaia DR2.
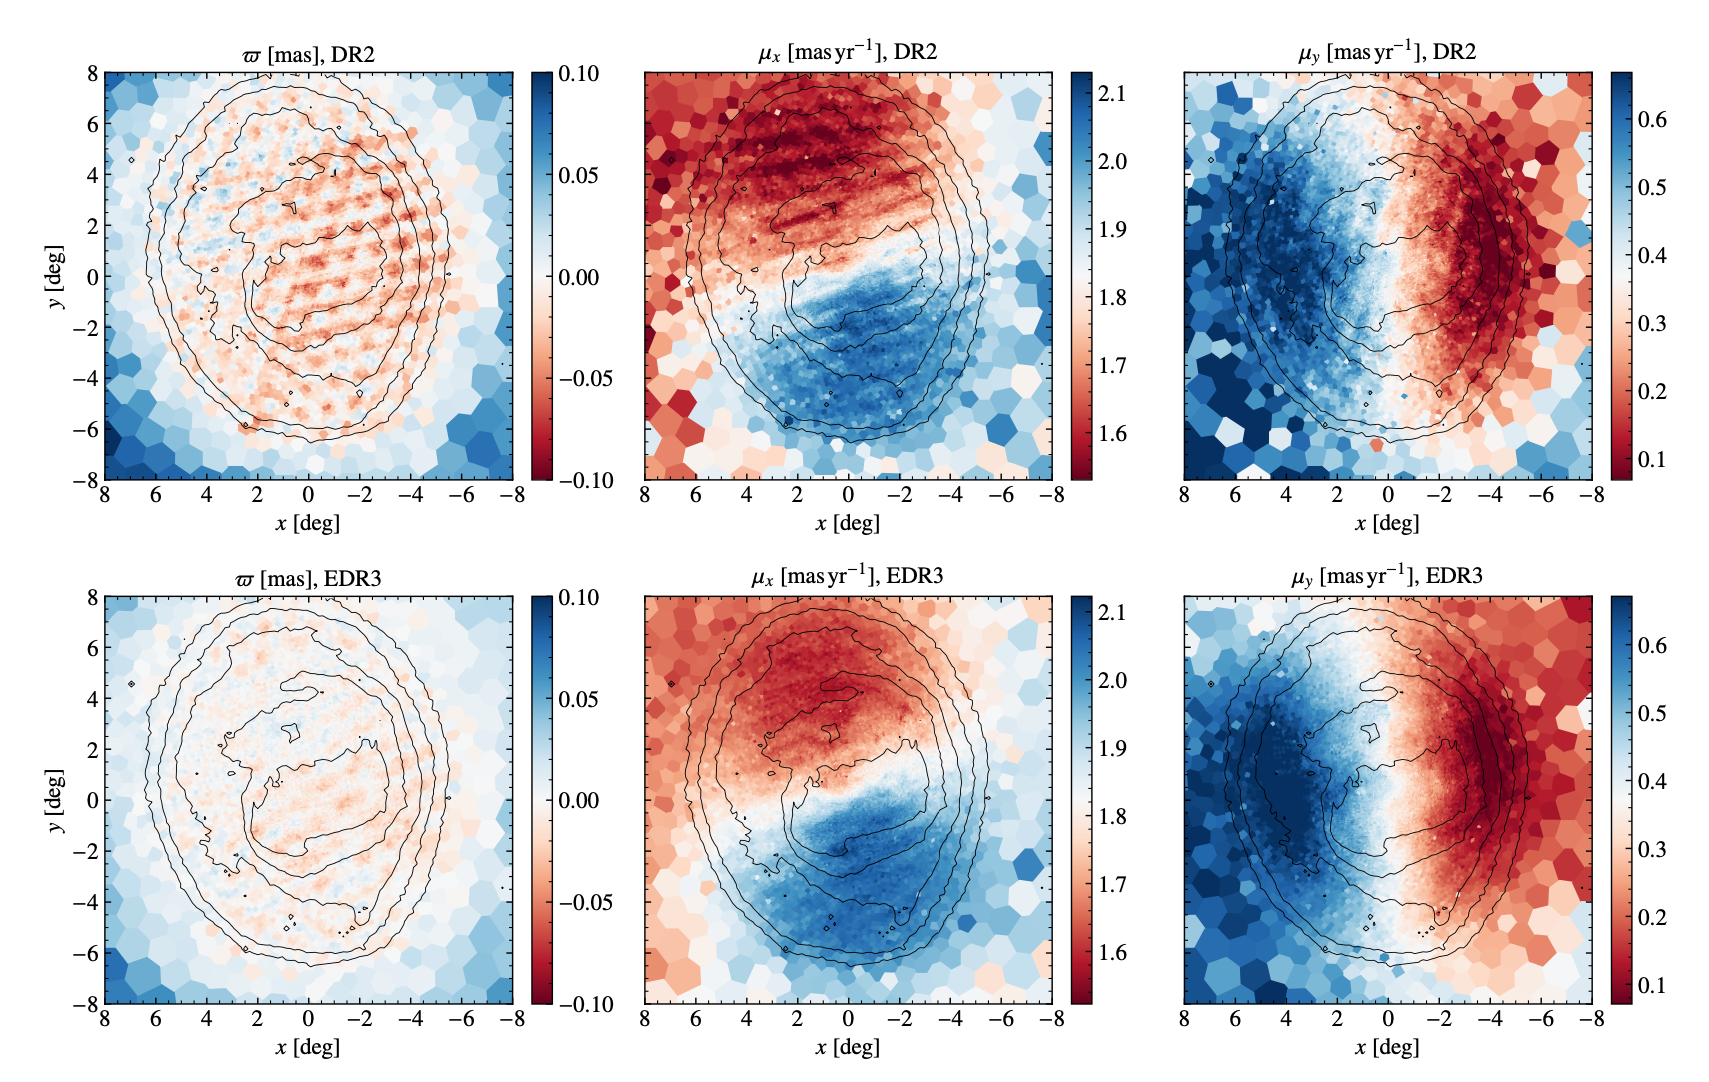
Figure 2: The parallax and proper motion errors in the Large Magellanic Cloud for Gaia DR2 (top row) and Gaia EDR3 (bottom row). The imprint of the astrometric systematic errors is significantly reduced in Gaia EDR3. Image credit: Gaia Collaboration, X. Luri, et al. A&A 2020.
Rather than taking an image of the entire Magellanic Clouds at once, Gaia repeatedly measures the properties of the stars that make up these clouds. A representation of the measurements of the motion of the individual stars around the centres of the Clouds is shown in Figure 3. Using the Line Integral Convolution technique, the proper motion field is visualised, while the brightness indicates the density of stars in that area.
|
|
|
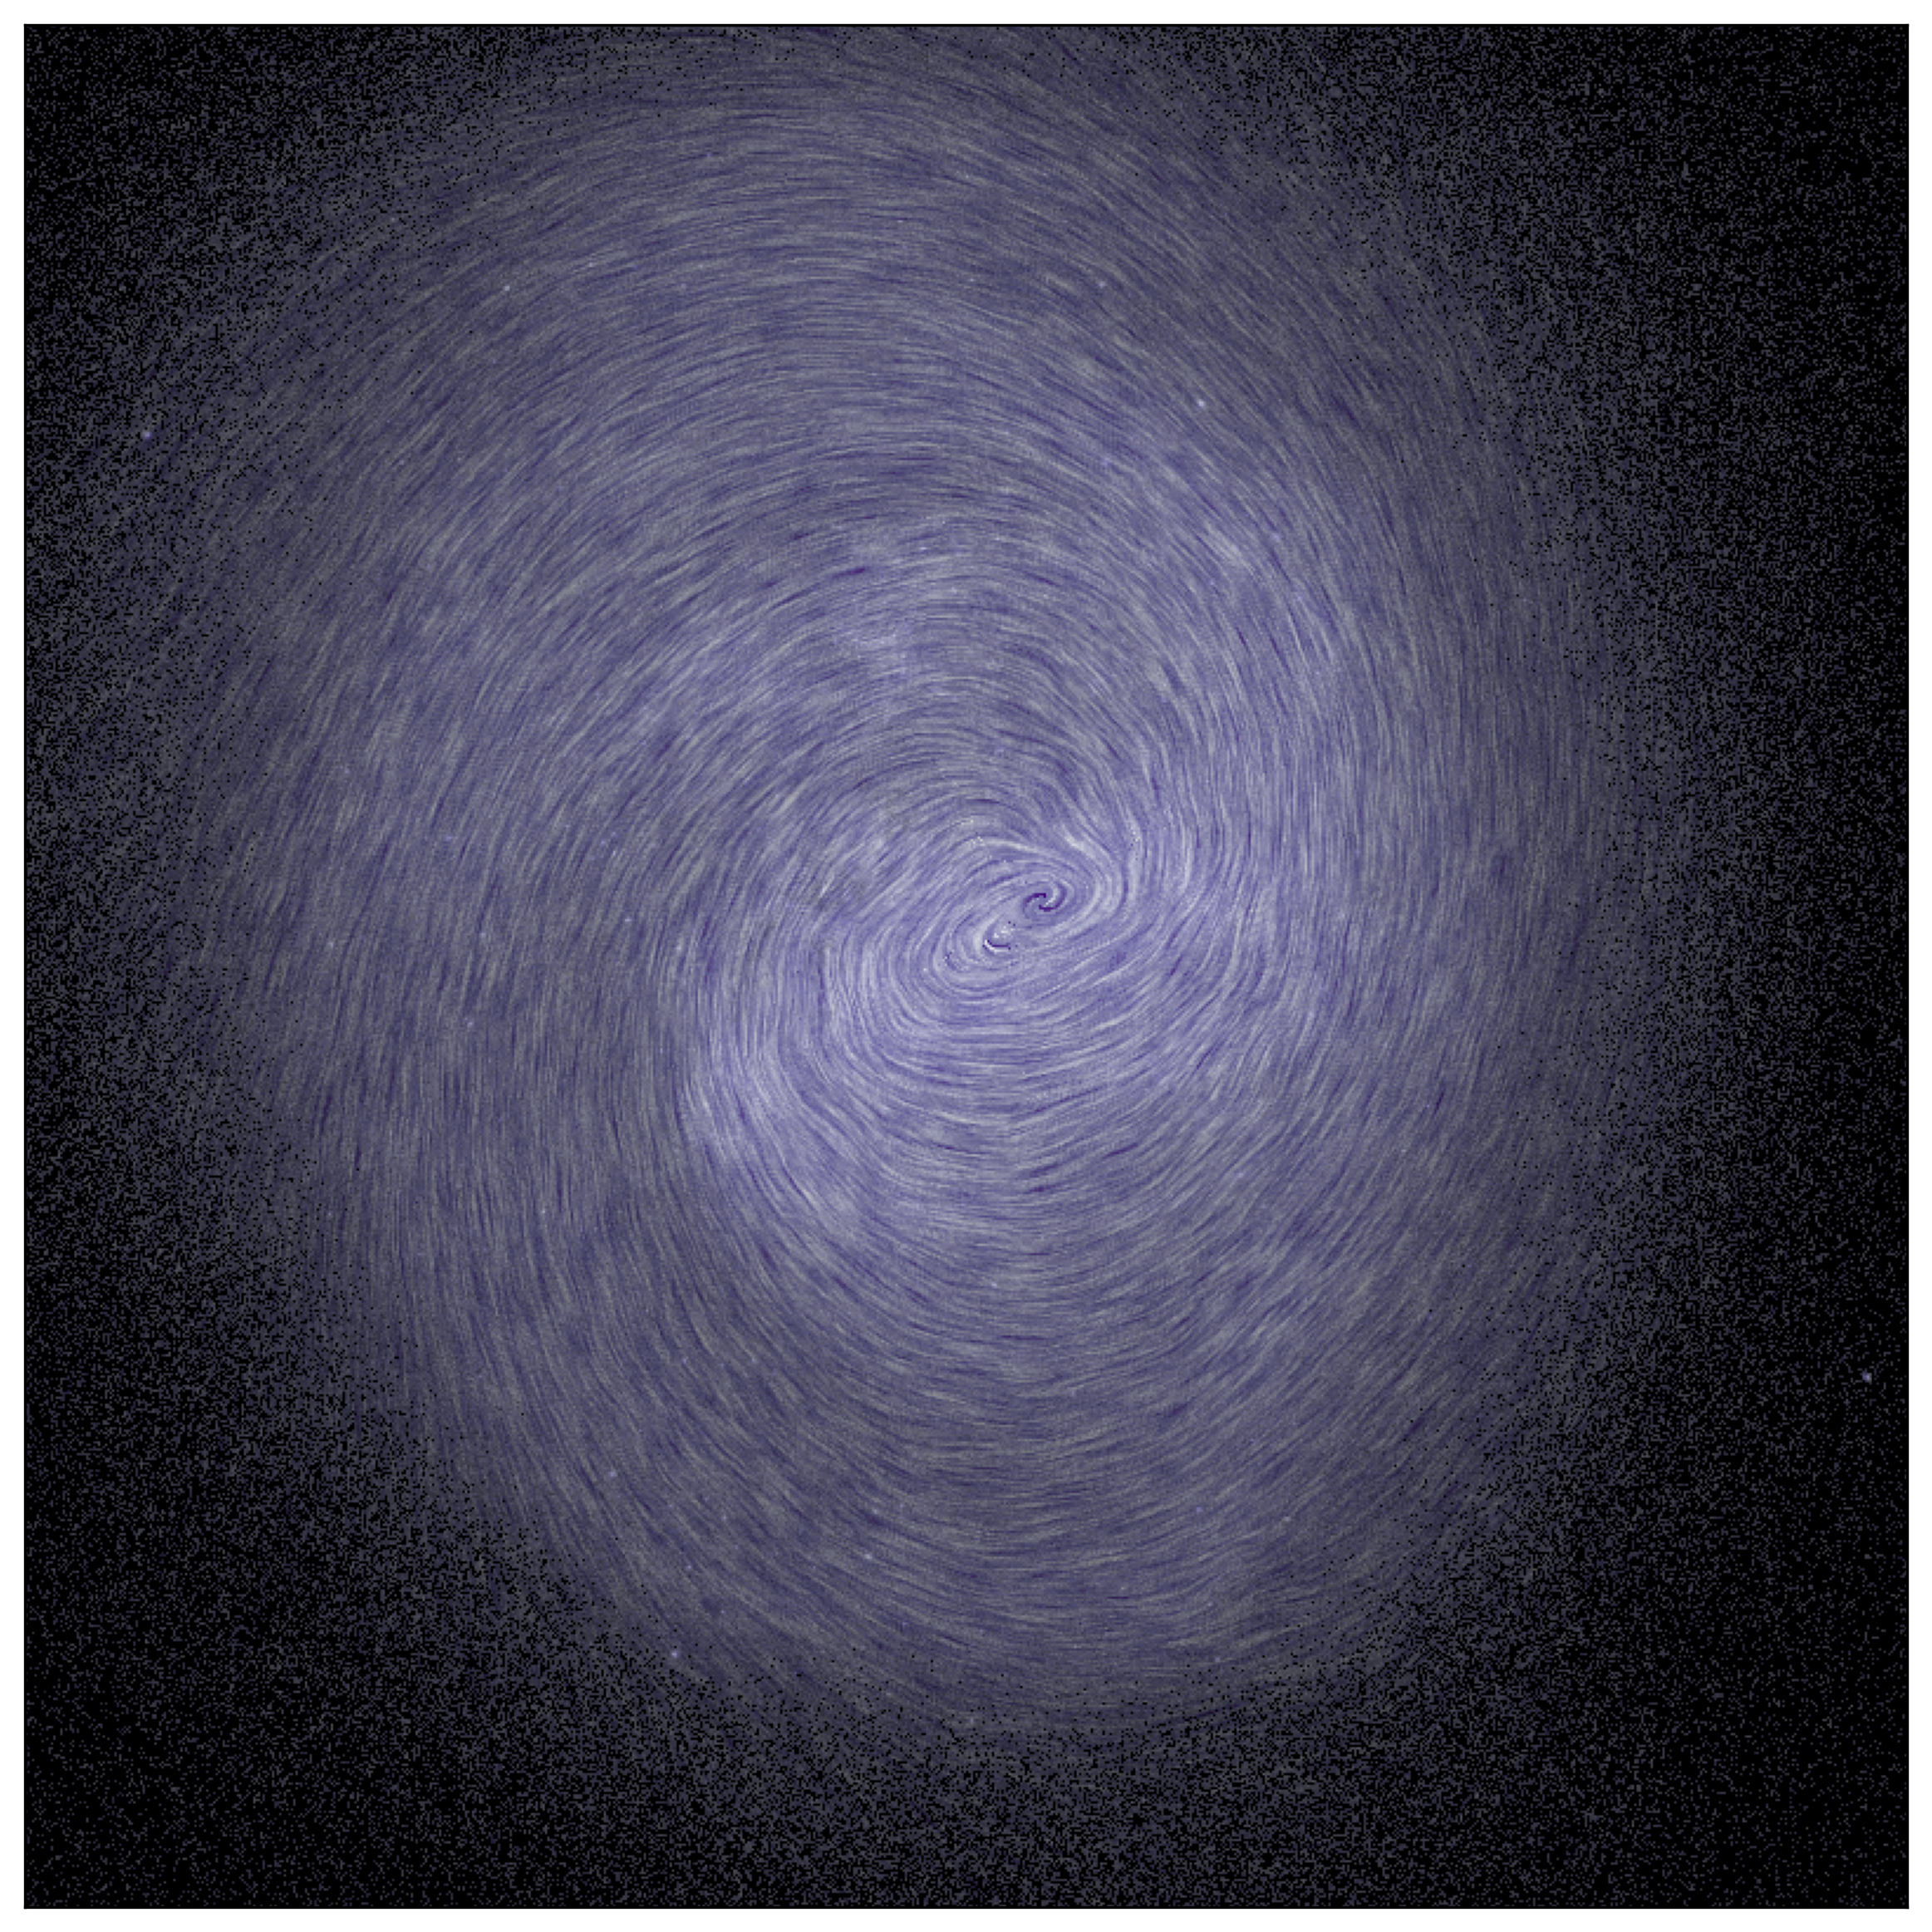
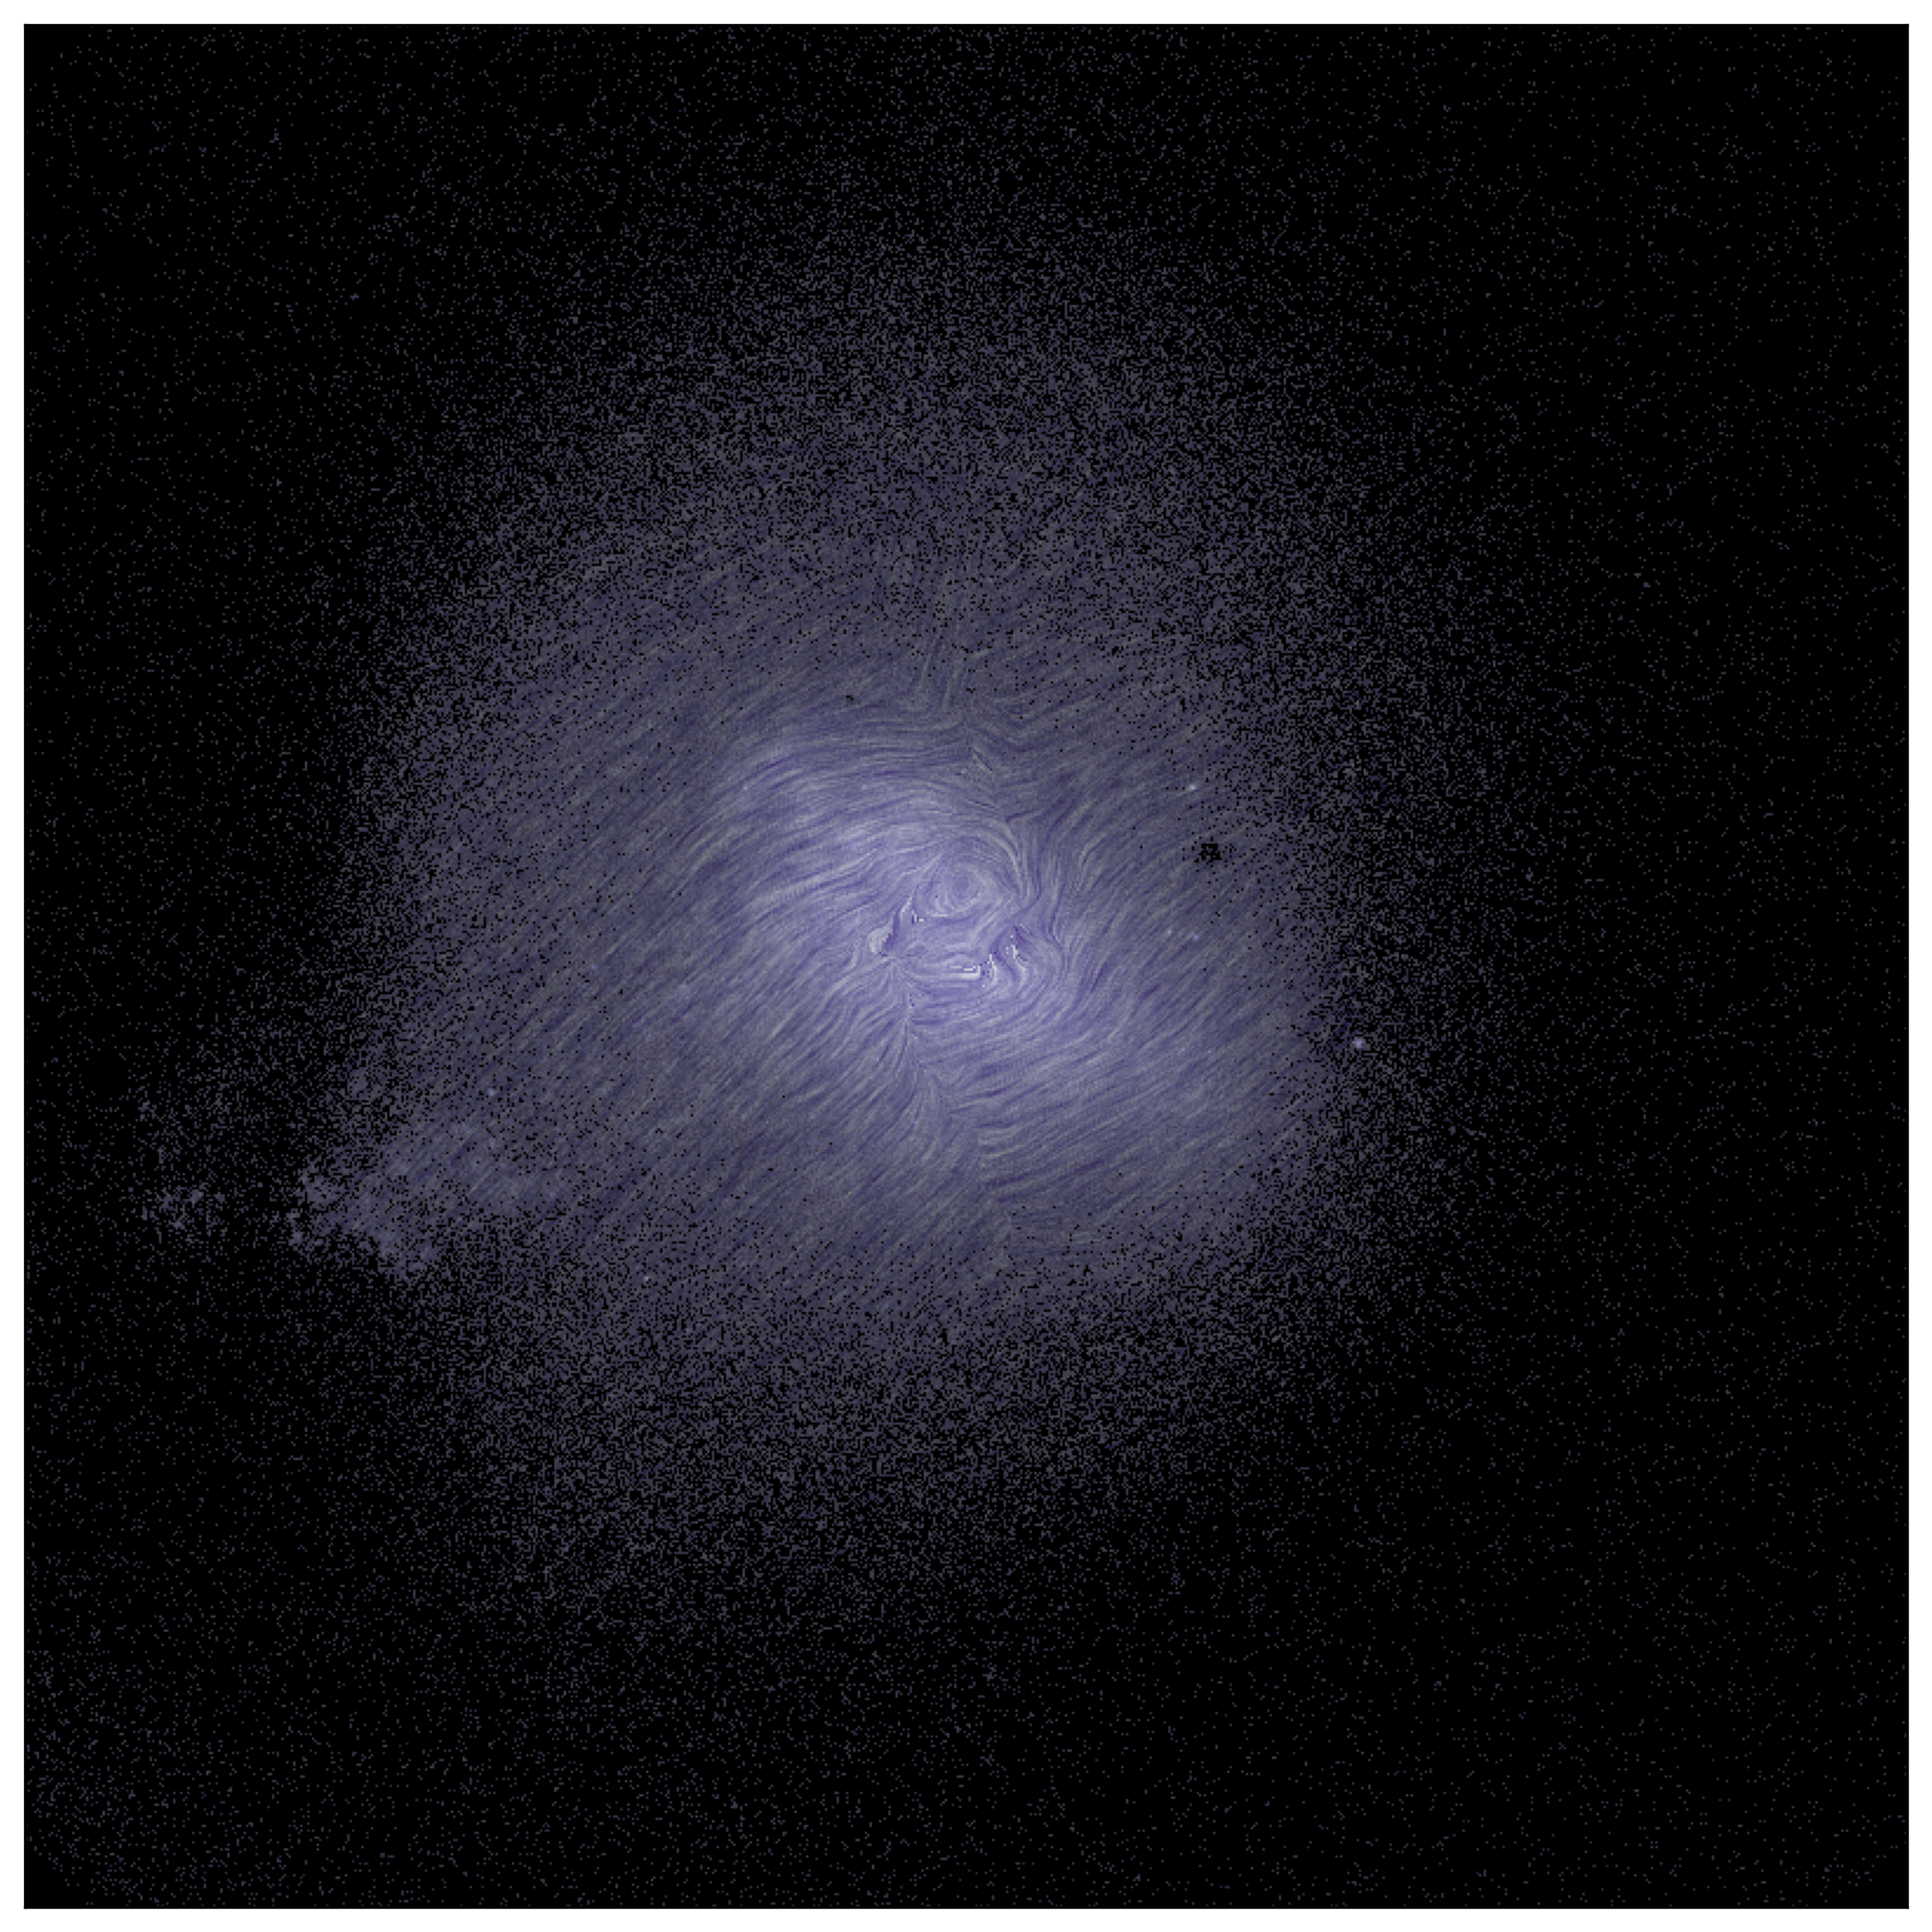
Figure 3: A visualisation of the rotation of the Magellanic Clouds (left LMC, right SMC) as traced by Gaia. The images show the proper motion distribution and density of the Large and Small Magellanic Clouds. The technique of line integral convolution is used to give an indication of the flow of stars in the galaxies. The areas with the higher density of stars on the sky are brighter in the image. Image credit: Gaia Collaboration, X. Luri, et al. A&A 2020
With the increased precision in the proper motions, the Gaia Collaboration was able to determine a new estimate for the rotational centre of the LMC (Figure 4). The centre derived from Gaia EDR3 is closer to the centre obtained from photometric studies and a bit further away from the measurement based upon the rotation of HI gas and the measurement based upon proper motions measured by the Hubble Space Telescope.
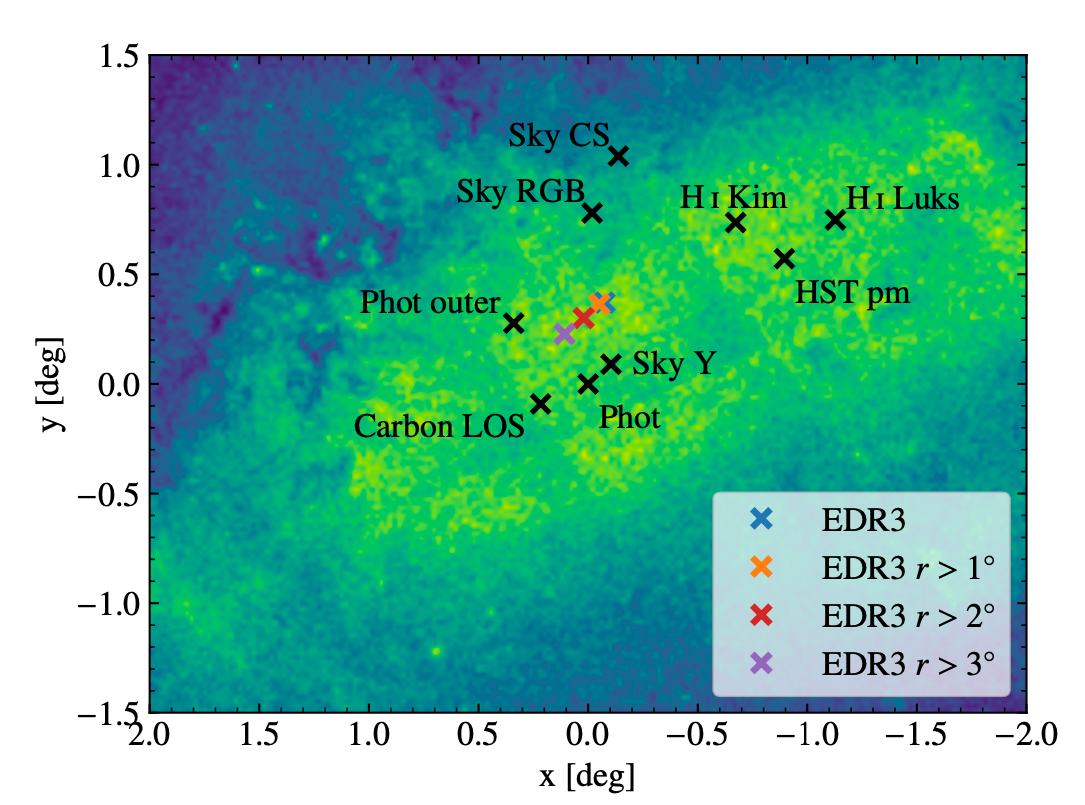
Figure 4: The rotational centre of the Large Magellanic Cloud, as computed from the Gaia EDR3 sample. Image credit: Gaia Collaboration, X. Luri, et al. A&A 2020.
A good measurement of the rotational centre of the LMC is key to study and model its kinematics. The newly computed centre thus allowed to refine other parameters, like the mean velocity, the inclination, and the orientation of the LMC.
To better understand the behaviour of both older and younger stars, a further sampling is made based on their position in the Colour Magnitude Diagram (CMD), used as a proxy of age. The availability of homogeneous photometry in Gaia EDR3 greatly helps to distinguish the various evolutionary phases.
|
|
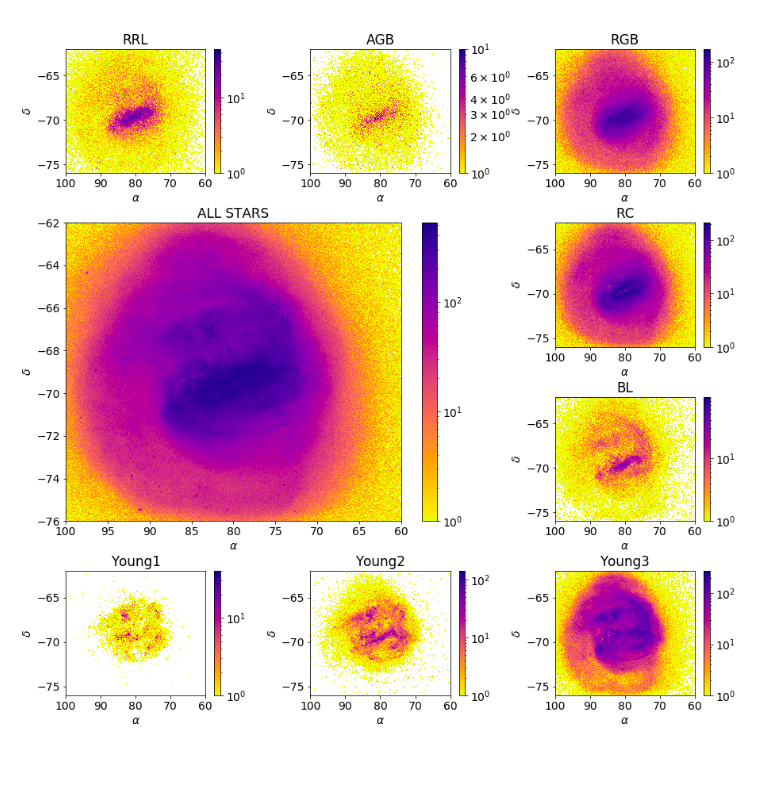 |
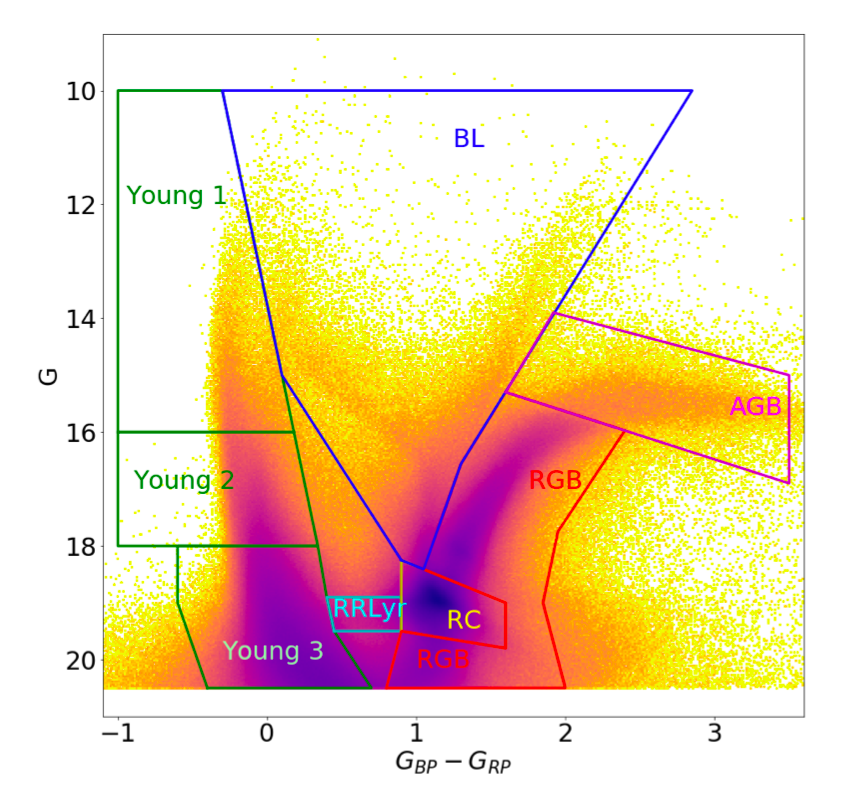
Figure 5: Populations of the LMC selection according to their evolutionary phase based on the Gaia EDR3 colour-magnitude diagram. Image credit: Gaia Collaboration, X. Luri, et al. A&A 2020
Based upon these populations, velocity maps have been created. It is the first time that the two planar components - the radial velocity and the azimuthal velocity - are derived for multiple stellar evolutionary phases in a galactic disk outside the Milky Way.
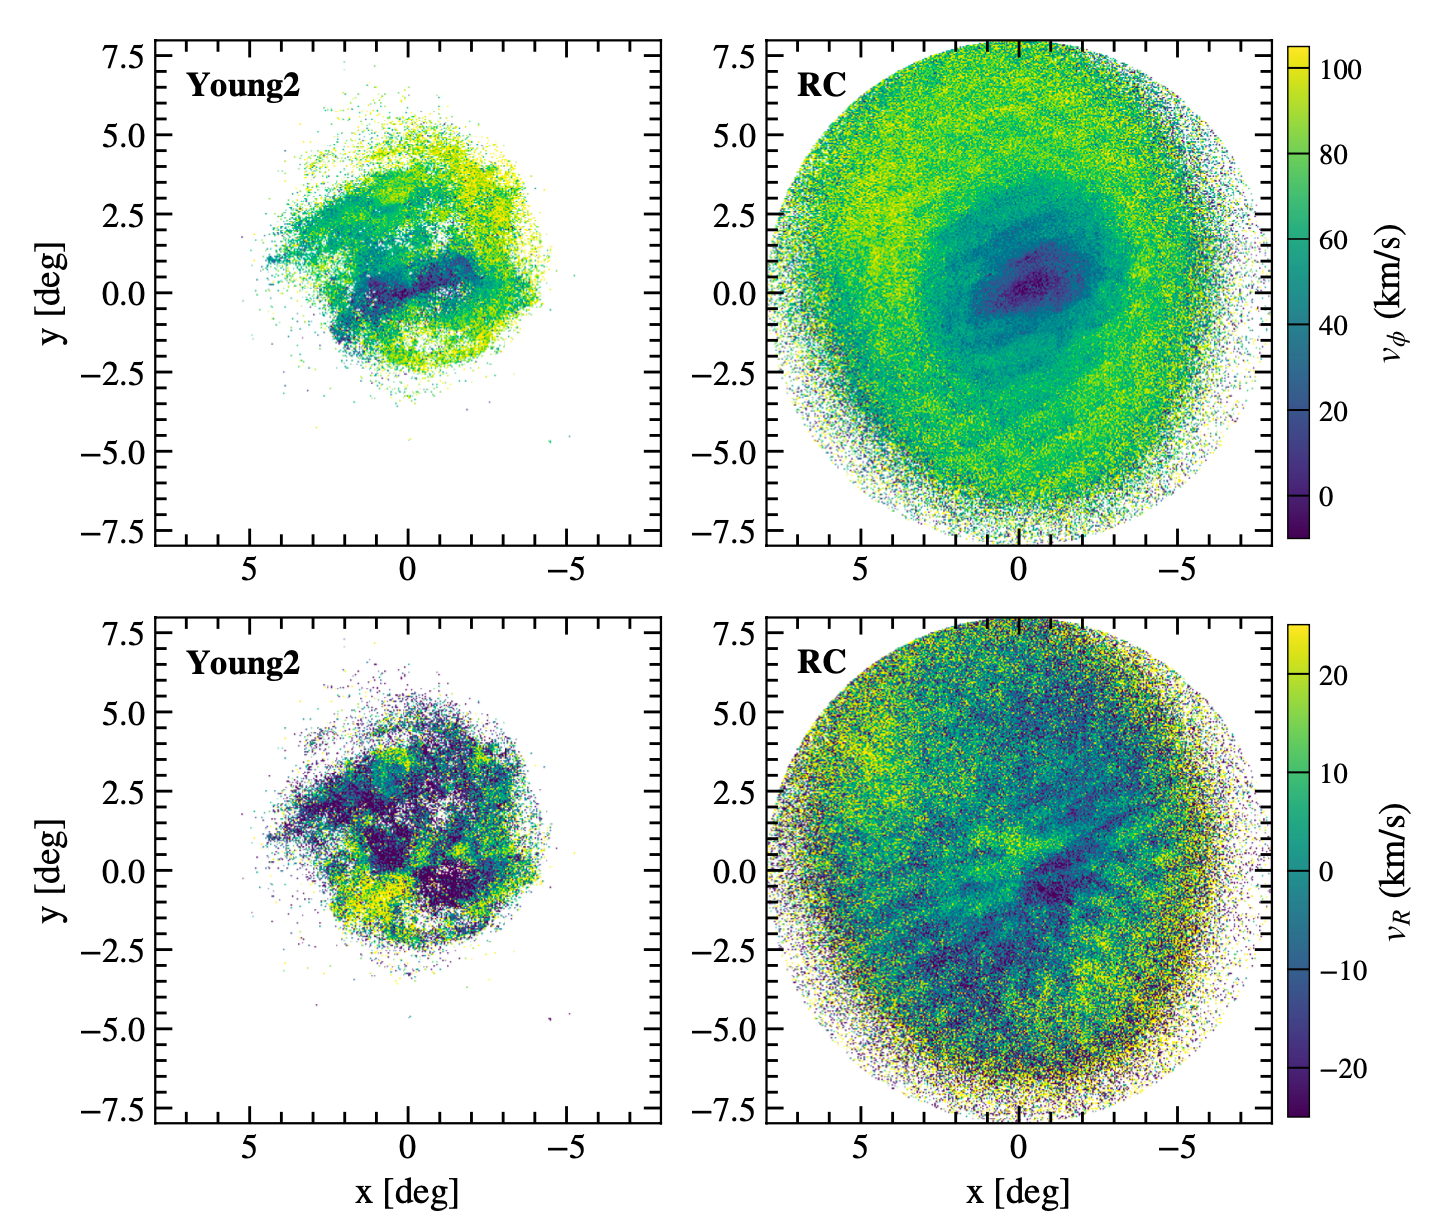
Figure 6: Velocity maps of the Large Magellanic Cloud tracing the differences in kinematics of the different populations. The top row represents the azimuthal velocity, and the higher the velocity, the lighter the colour becomes. From the more evolved sample on the right it is clearly seen that the outer band is lighter, which is expected as the rotational velocity is higher in an orbit further from the rotational centre. This pattern is less visible in the younger sample. The bottom row provides the velocity map for the radial velocity. Image credit: Gaia Collaboration, X. Luri, et al. 2020 A&A
When looking in detail at the interaction between the Magellanic Clouds, features stand out directly, without applying any statistical technique, thanks to the quality of the Gaia EDR3 data. The bridge clearly appears when looking at a population of young stars. With the use of the proper motions from Gaia EDR3, the flow of Red Clump stars from the SMC to the LMC is confirmed. Faint substructures (stellar streams) are visible in the halo of the Clouds. Together with the bridge, they are witnesses of the formation and evolution of the Clouds.
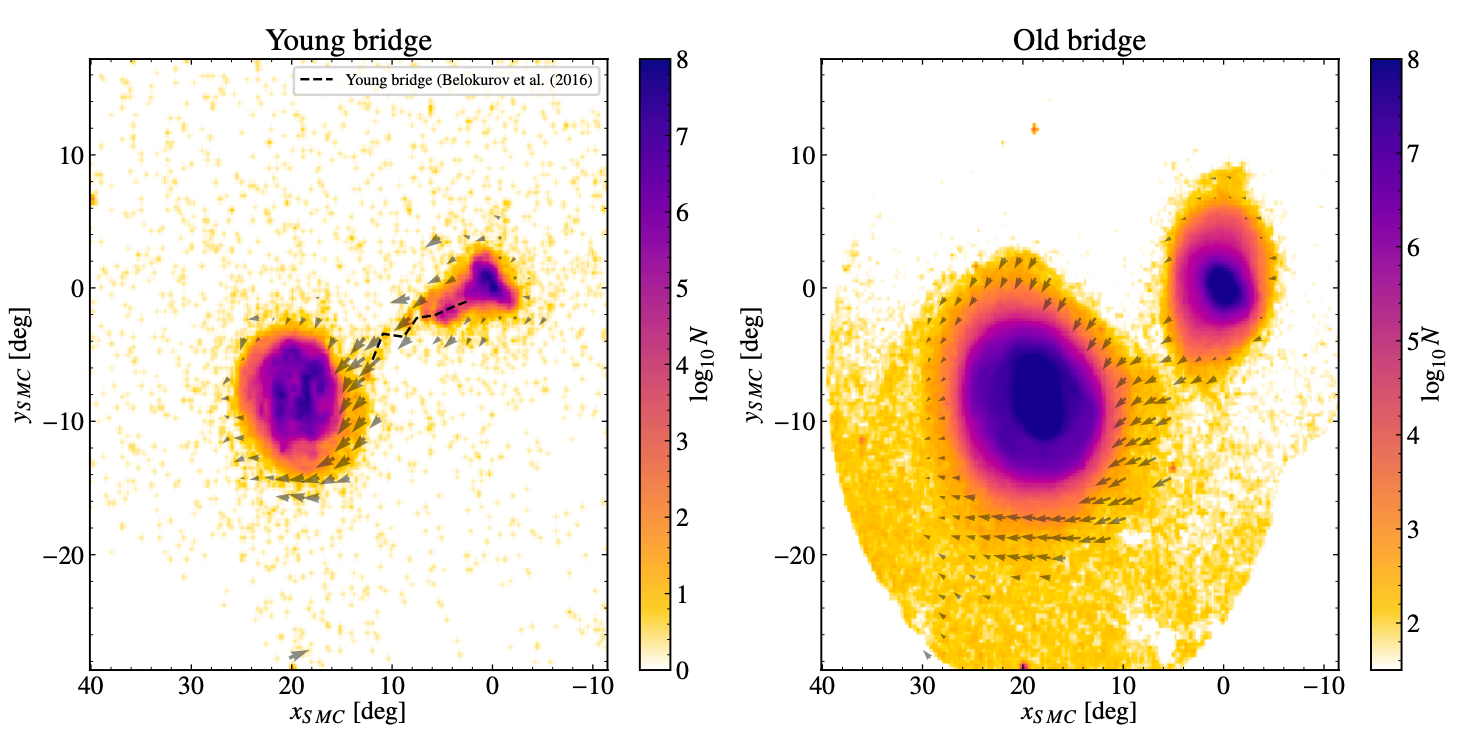
Figure 7: The vector fields of the proper motions in the Magellanic Clouds, for the young bridge on the left and the old bridge (based on red clump stars) on the right. Image credit: Gaia Collaboration, X. Luri, et al. 2020 A&A
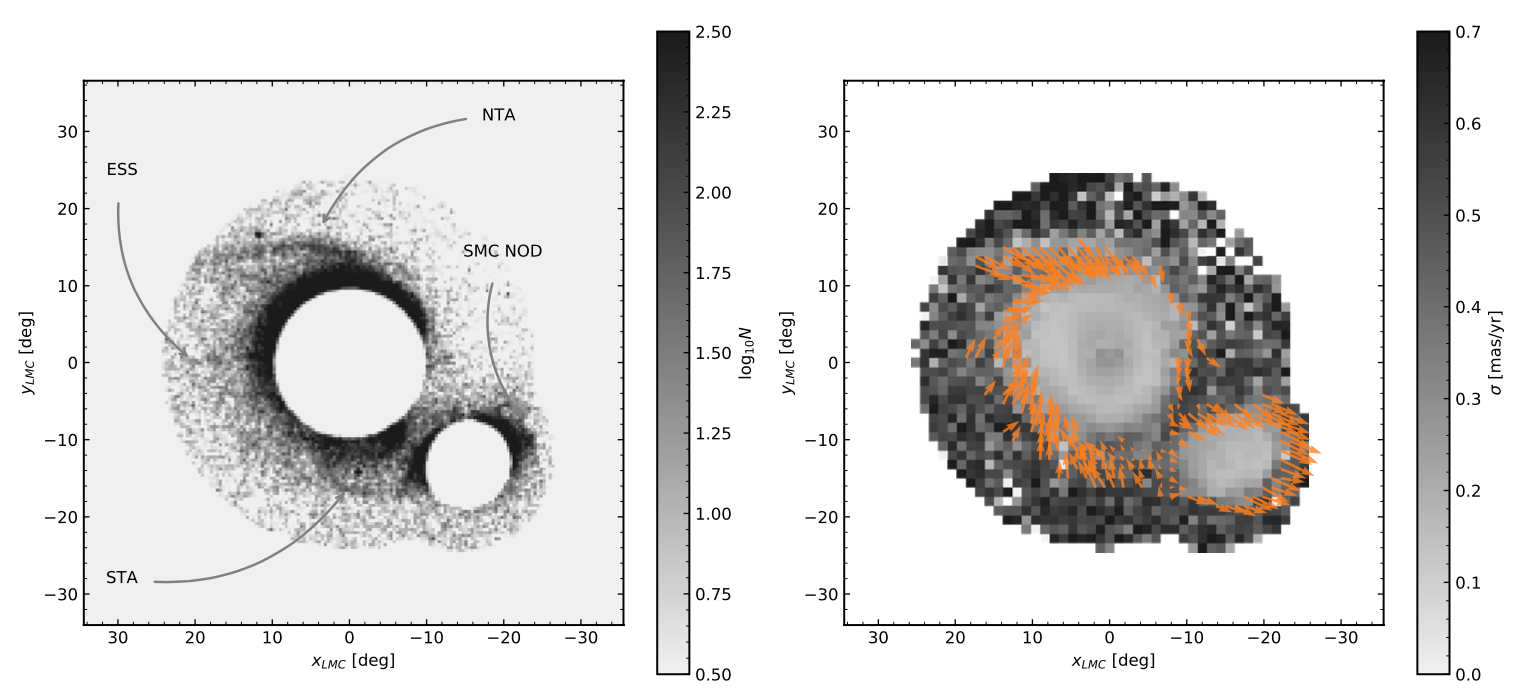
Figure 8: Annotated map with the names of the most notable substructures of the outskirts regions of the LMC/SMC (left) and total velocity dispersion map with the velocity vector field shown as orange arrows for the same regions (right). Image credit: Gaia Collaboration, X. Luri, et al. 2020 A&A
Video 1: A tour through the Magellanic Clouds highlighting some results from Gaia Early Data Release 3. Credit: ESA/Gaia/DPAC - CC BY-SA 3.0 IGO.
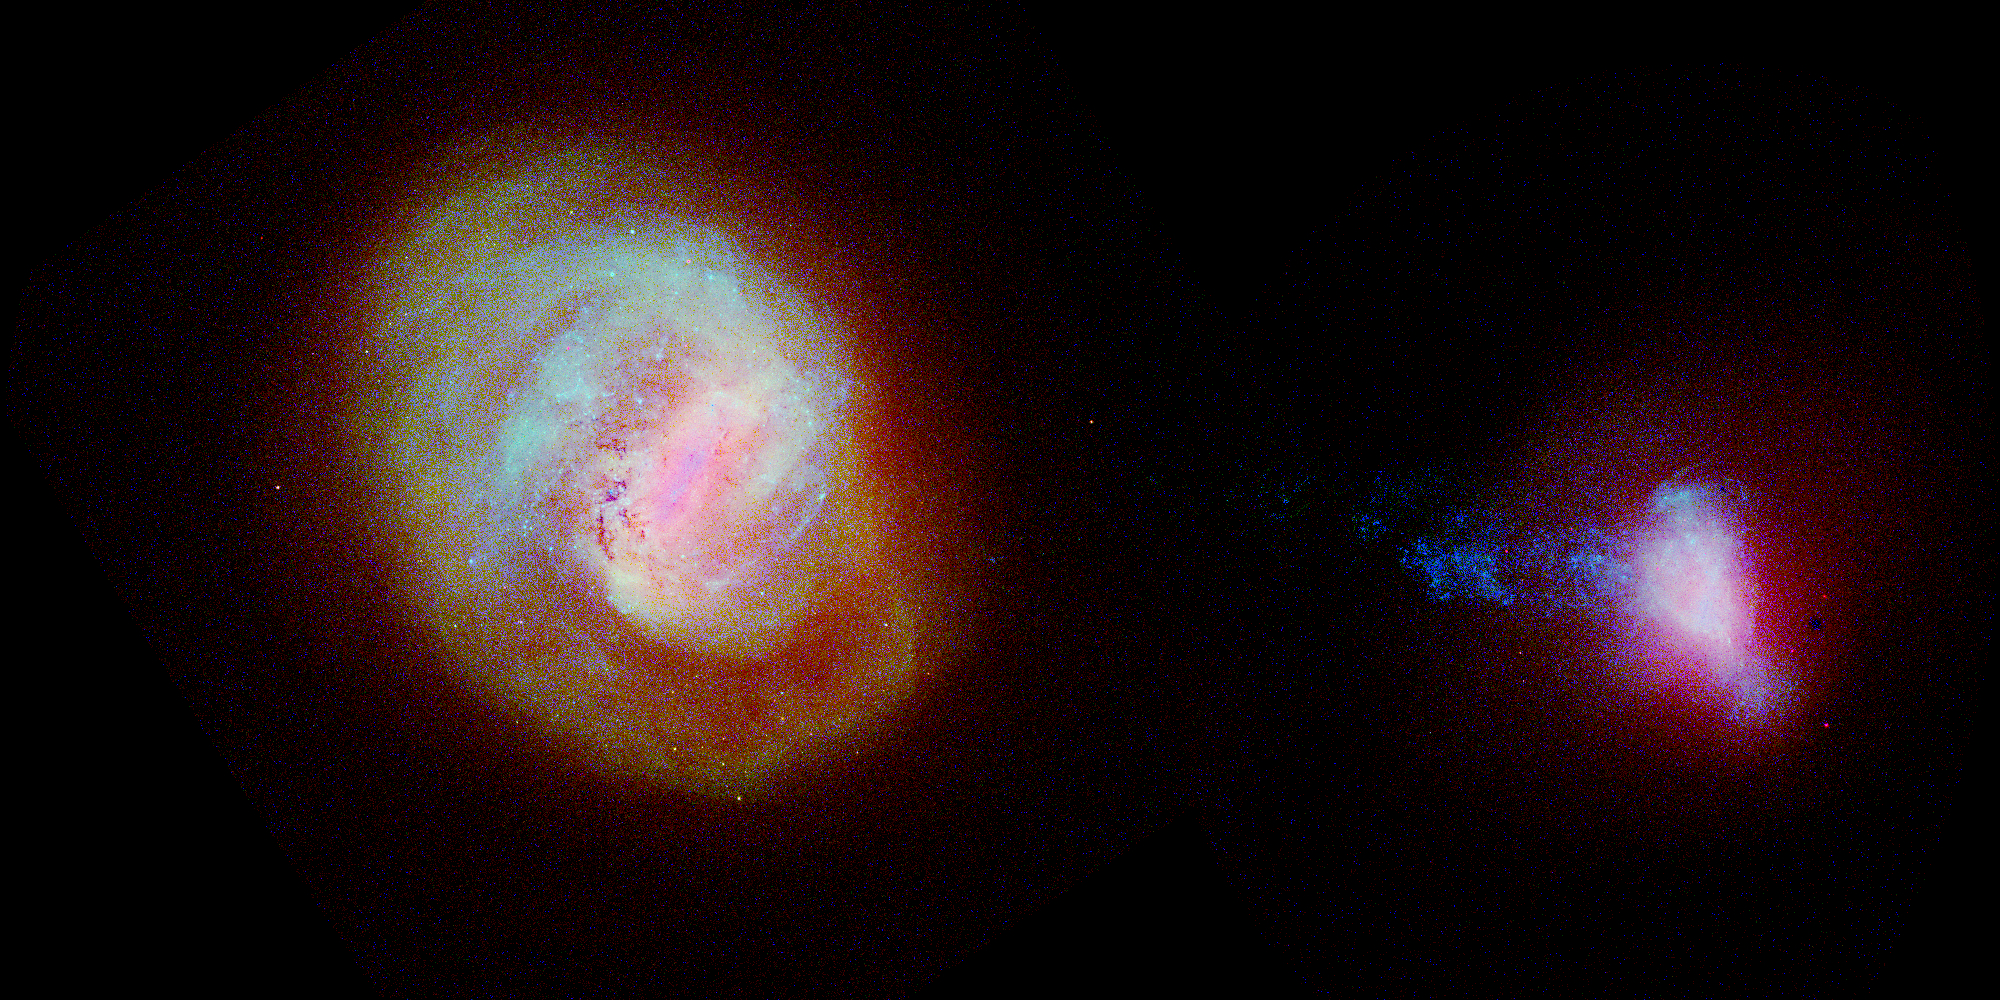
Figure 9. Large and Small Magellanic Clouds. Image credit: ESA/Gaia/DPAC - CC BY-SA 3.0 IGO.
Video 2: Antonella Vallenari - Credit: ESA/Gaia/DPAC
Further reading: Gaia Early Data Relesae 3: Structure and properties of the Magellanic Clouds by the Gaia Collaboration, X. Luri, et al. A&A 2020
Acknowledgements:
Figure 1: This image was created by Laurent Chemin. The data for the creation of these images was based upon the paper "Gaia Early Data Release 3: Structure and properties of the Magellanic Clouds" by Gaia Collaboration, X.Luri, et al. 2020 A&A.
Figure 3: These images were created by Paul McMillan (Lund University)
Video 1: This video was produced by Stefan Jordan and Toni Sagristà with Gaia Sky (http://www.zah.uni-heidelberg.de/gaia...). Based on Gaia Collaboration, X. Luri, et al.: "Gaia Early Data Release 3: structure and properties of the Magellanic Clouds", Astronomy and Astrophysics, 2020
Figure 9: These images were created by Laurent Chemin. The data for the creation of these images was based upon the paper "Gaia Early Data Release 3: Structure and properties of the Magellanic Clouds" by Gaia Collaboration, X.Luri, et al. 2020 A&A.
Video 2: This video was produced by Antonella Vallenari, Anthony Brown and Eduard Masana
Published 3 December - Credit: ESA/Gaia/DPAC
- Removed a total of (27) style text-align:center;
- Removed a total of (26) style text-align:justify;
- Removed a total of (2) style float:left;
- Removed a total of (2) style float:right;
- Removed a total of (2) border attribute.
- Removed a total of (2) cellpadding attribute.
- Removed a total of (2) cellspacing attribute.
- Converted a total of (2) youtube to youtube-nocookie.
More Gaia EDR3 stories on Cosmos
Following the journey of stars across the sky
The acceleration of the solar system with respect to the distant universe
A dive into the Magellanic Clouds
Gaia Catalogue of Nearby Stars
Gaia EDR3 releases on SCI.ESA.INT
Gaia's new data takes us to the Milky Way and beyond
Video release: Orbits of nearby stars around the galaxy
Video release: Measuring the acceleration of the Solar System with Gaia
Video release: Bridge of stars
Video release: Gaia's stellar motion for the next 1.6 million years
Image release: Gaia's stellar motion for the next 400 thousand years
Image release: Gaia's view of the Milky Way's neighbouring galaxies
Image release: Gaia's early data release 3 in numbers
Image release: The density of stars from Gaia's early data release 3 - equirectangular projection
Image release: The density of stars from Gaia's early data release 3
Image release: The colour of the sky from Gaia's early data release 3 - equirectangular projection
Image release: The colour of the sky from Gaia's early data release 3
Gaia EDR3 Release on ESA.INT
- Removed a total of (1) style float:right;