



































 Sign in
 Science & Technology

How to extract the Gaia ancillary data using datalink - Gaia Users
Help supportShould you have any question, please check the Gaia FAQ section or contact the Gaia Helpdesk |
- Removed a total of (1) style font-weight:normal;
- Removed a total of (1) style margin:0;
- Removed a total of (1) align=center.
- Removed a total of (1) border attribute.
DataLink Service
Authors: Héctor Cánovas and Jos de Bruijne
In each Gaia data release, the key parameters of all sources are stored in the gaia_source table that contains the (mean) astrometric, photometric, and radial-velocity data as well as astrophysical parameters. This table, along with the complementary tables for, for instance, variable stars or solar system objects, is accessible by means of the IVOA compliant TAP+ table access protocol that allows to explore astronomical datasets stored in relational data bases using the ADQL query language. In addition to the gaia_source table, Gaia DR3 includes vast amounts of non-tabular data such as mean spectra, epoch photometry, and Monte Carlo Markov Chain samples for millions of sources (while Gaia DR4 will include epoch astrometry and epoch photometry for the whole sample plus billions of mean and epoch spectra). Storing these non-tabular datasets as plain tables in a monolithic, relational data base is impractical. Instead, these products are hosted by a dedicated service designed to handle massive data requests that is accessible via the DataLink protocol. DataLink is a data access protocol compliant with the IVOA architecture that provides a linking mechanism between datasets offered by different services. In practice, it can be seen and used as a web service providing the list of additional data products available for each object outside the main catalogue(s).
Since the Archive upgrade to version 2.14 the VOTables generated by the Archive contain a new resource that facilitates the access to the DataLink products to IVOA compliant clients (like TOPCAT):
<RESOURCE type="meta" utype="adhoc:service" name="ancillary">
    <DESCRIPTION>Retrieve DataLink file containing ancillary data for source</DESCRIPTION>
    <PARAM name="standardID" datatype="char" arraysize="*" value="ivo://ivoa.net/std/DataLink#links-1.0"/>
    <PARAM name="accessURL" datatype="char" arraysize="*" value="https://gea.esac.esa.int/data-server/datalink/links"/>
    <PARAM name="contentType" datatype="char" arraysize="*" value="application/x-votable+xml;content=datalink"/>
    <GROUP name="inputParams">
         <PARAM name="ID"  datatype="char" arraysize="*" value="" ref="DESIGNATION"/>
    </GROUP>
</RESOURCE>
The entry point to the DataLink server is indicated by the "accessURL" parameter. To invoke the service and find out the resources associated to a given source it is necessary to combine the entry point with the target ID as:
https://gea.esac.esa.int/data-server/datalink/links?ID=Gaia+DR3+30343944744320
The output is a xml file not intended for humans but for IVOA-compliant clients. Opening this file with TOPCAT reveals the following content:
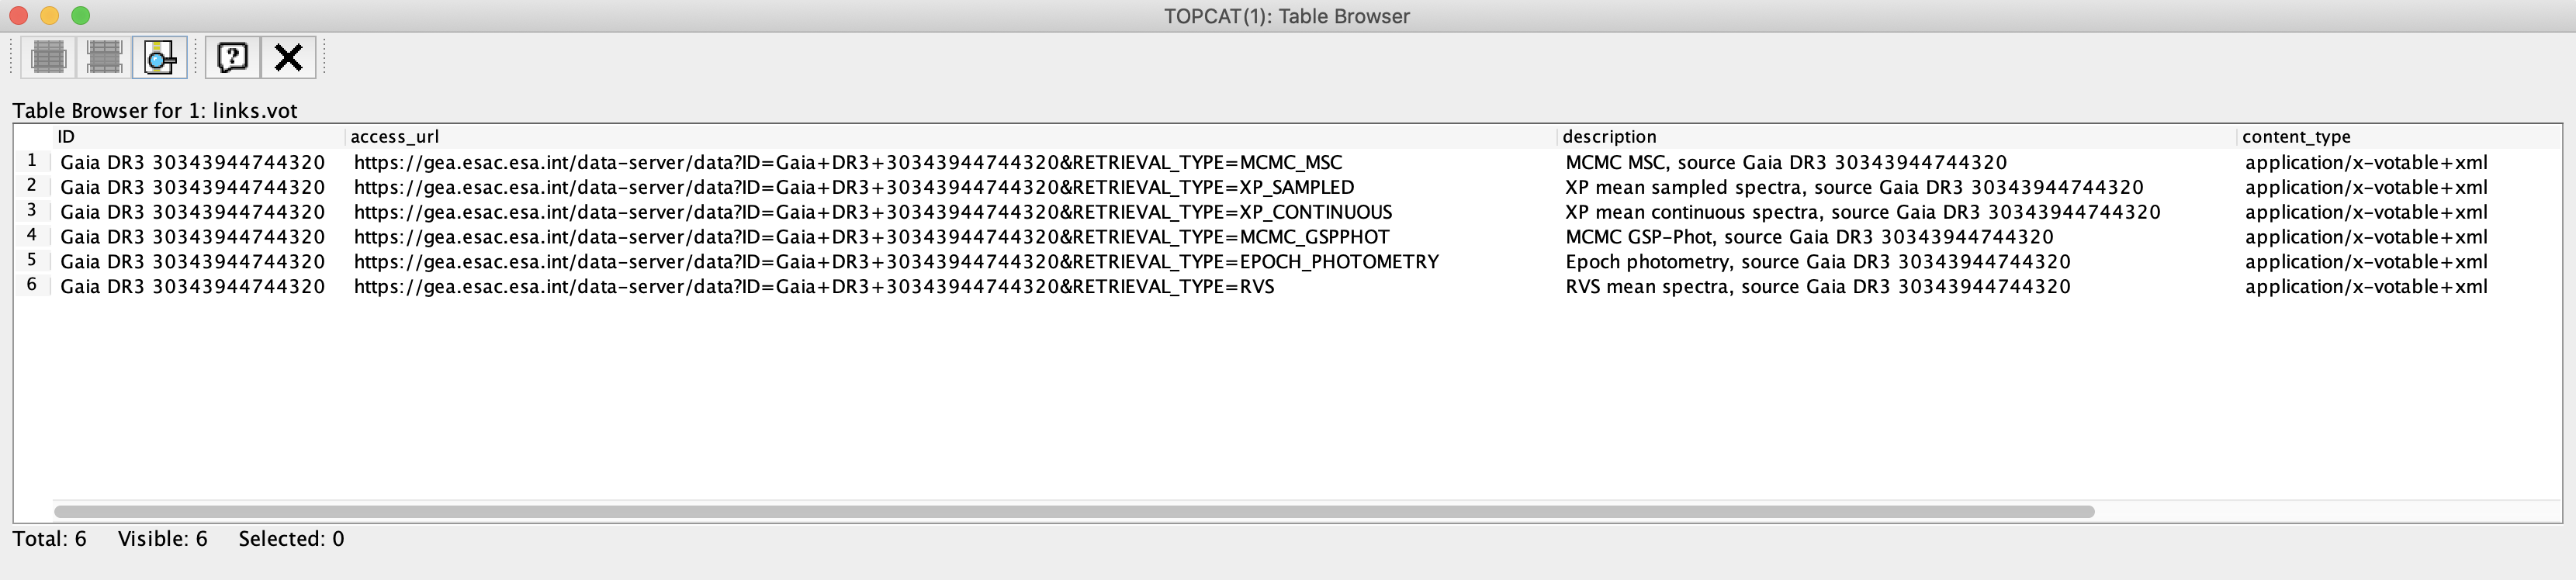
Figure 1: Content of the xml file generated by the DataLink service when invoked as explained above.
This file contains the URLs that give access to the DataLink products associated to the target source. For information about how to access to these products from the Gaia Archive web interface and programmatically, please see the DataLink: Access from the Archive GUI and the Command line access: DataLink tutorials, respectively. The structure and content of the DataLink products are described in the Datamodel Chapter in the Gaia DR3 documentation and DataLink products serialisation tutorial.
- Removed a total of (2) style text-align:center;
- Removed a total of (9) style text-align:justify;
- Removed a total of (1) style margin:0;
DataLink: Access from the Archive web interface
Authors: Héctor Cánovas, Jos de Bruijne, and Alcione Mora
Last update: 2024-12-10
The Gaia DR3 data release includes vast amounts of non-tabular data such as high- and low-resolution (mean) spectra, epoch photometry, and Monte Carlo Markov Chain samples for millions of sources. These products are made available through a dedicated service designed to handle massive data requests using the DataLink protocol. This intermediate-level tutorial introduces the concepts needed to retrieve these non-tabular products using the Gaia ESA Archive web interface via its Advanced (ADQL) form. The complementary DataLink: command line access and DataLink: Python access tutorials describe the programmatic access to these products using the Unix curl command-line utility and the Python package Astroquery.Gaia, respectively, while the DataLink products serialisation tutorial describes the structure of these products. In case of difficulties following this tutorial, please consult the DataLink service and Advanced (ADQL) tab tutorials.
Tutorial content:
1. How it works
As explained in the DataLink Service tutorial above, the DataLink protocol allows users to search for and retrieve DataLink products associated with a list of Gaia designations, or alternatively, with a combination of Gaia source IDs and Gaia data releases. Direct access to this service through the web interface is not possible. Instead, users must first execute an ADQL query that generates an output table containing the source_id and/or designation fields. Since the release of GACSv3.6, the output table metadata includes a Gaia release tag (e.g., "Gaia DR3" or "Gaia DR2"), which is automatically fetched by the Archive web interface when preparing the request to the DataLink server.
2. Basic use case
One of the simplest use cases is likely: "I want to search for the DataLink products associated with the output of this Gaia DR3 query." The ADQL query in the example below performs a cone search with a radius of 0.25 degrees (see the Query examples section for more complex queries):
SELECT DISTANCE(266.41683, -29.00781, ra, dec) AS separation, *
FROM gaiadr3.gaia_source WHERE DISTANCE(266.41683, -29.00781, ra, dec) < 0.25
ORDER BY separation ASC
The first step to retrieve the DataLink products associated with this sample is to click on the double chain ("paperclip") icon in the job list area of the Advanced (ADQL) form. In this case, an error message will appear, explaining that the query result contains 19,758 sources, exceeding the threshold of 5,000 sources imposed to prevent overloading the DataLink server. To resolve this, you can either reduce the cone search radius or, preferably, use the has_<datalink_product> fields available in the gaiadr3.gaia_source table as follows:
SELECT DISTANCE(266.41683, -29.00781,ra, dec) AS separation, *
FROM gaiadr3.gaia_source WHERE DISTANCE(266.41683, -29.00781, ra, dec) <0.25 AND
-- Retrieve only sources with associated DataLink products
has_epoch_photometry ='True' AND has_xp_sampled = 'True'
ORDER BY separation ASC
The output of this query contains just 26 sources, all of which have epoch photometry and both XP sampled and XP continuous spectra. Note: advanced users can use the job_upload mechanism to apply these filters to their previous queries. Clicking the double chain icon in the job list area again will launch the DataLink wizard, as shown in Fig. 1. This window lists all the available products associated with the sample generated by the previous query. One can retrieve only selected products (e.g., just RVS mean spectra) or download all products at once by clicking the "Save All Data" button. Note that, depending on the volume of data, preparing the dataset for download may take several minutes. In the DataLink wizard, one can also select different combinations of data structures and download formats (see the DataLink: products serialisation tutorial for details).
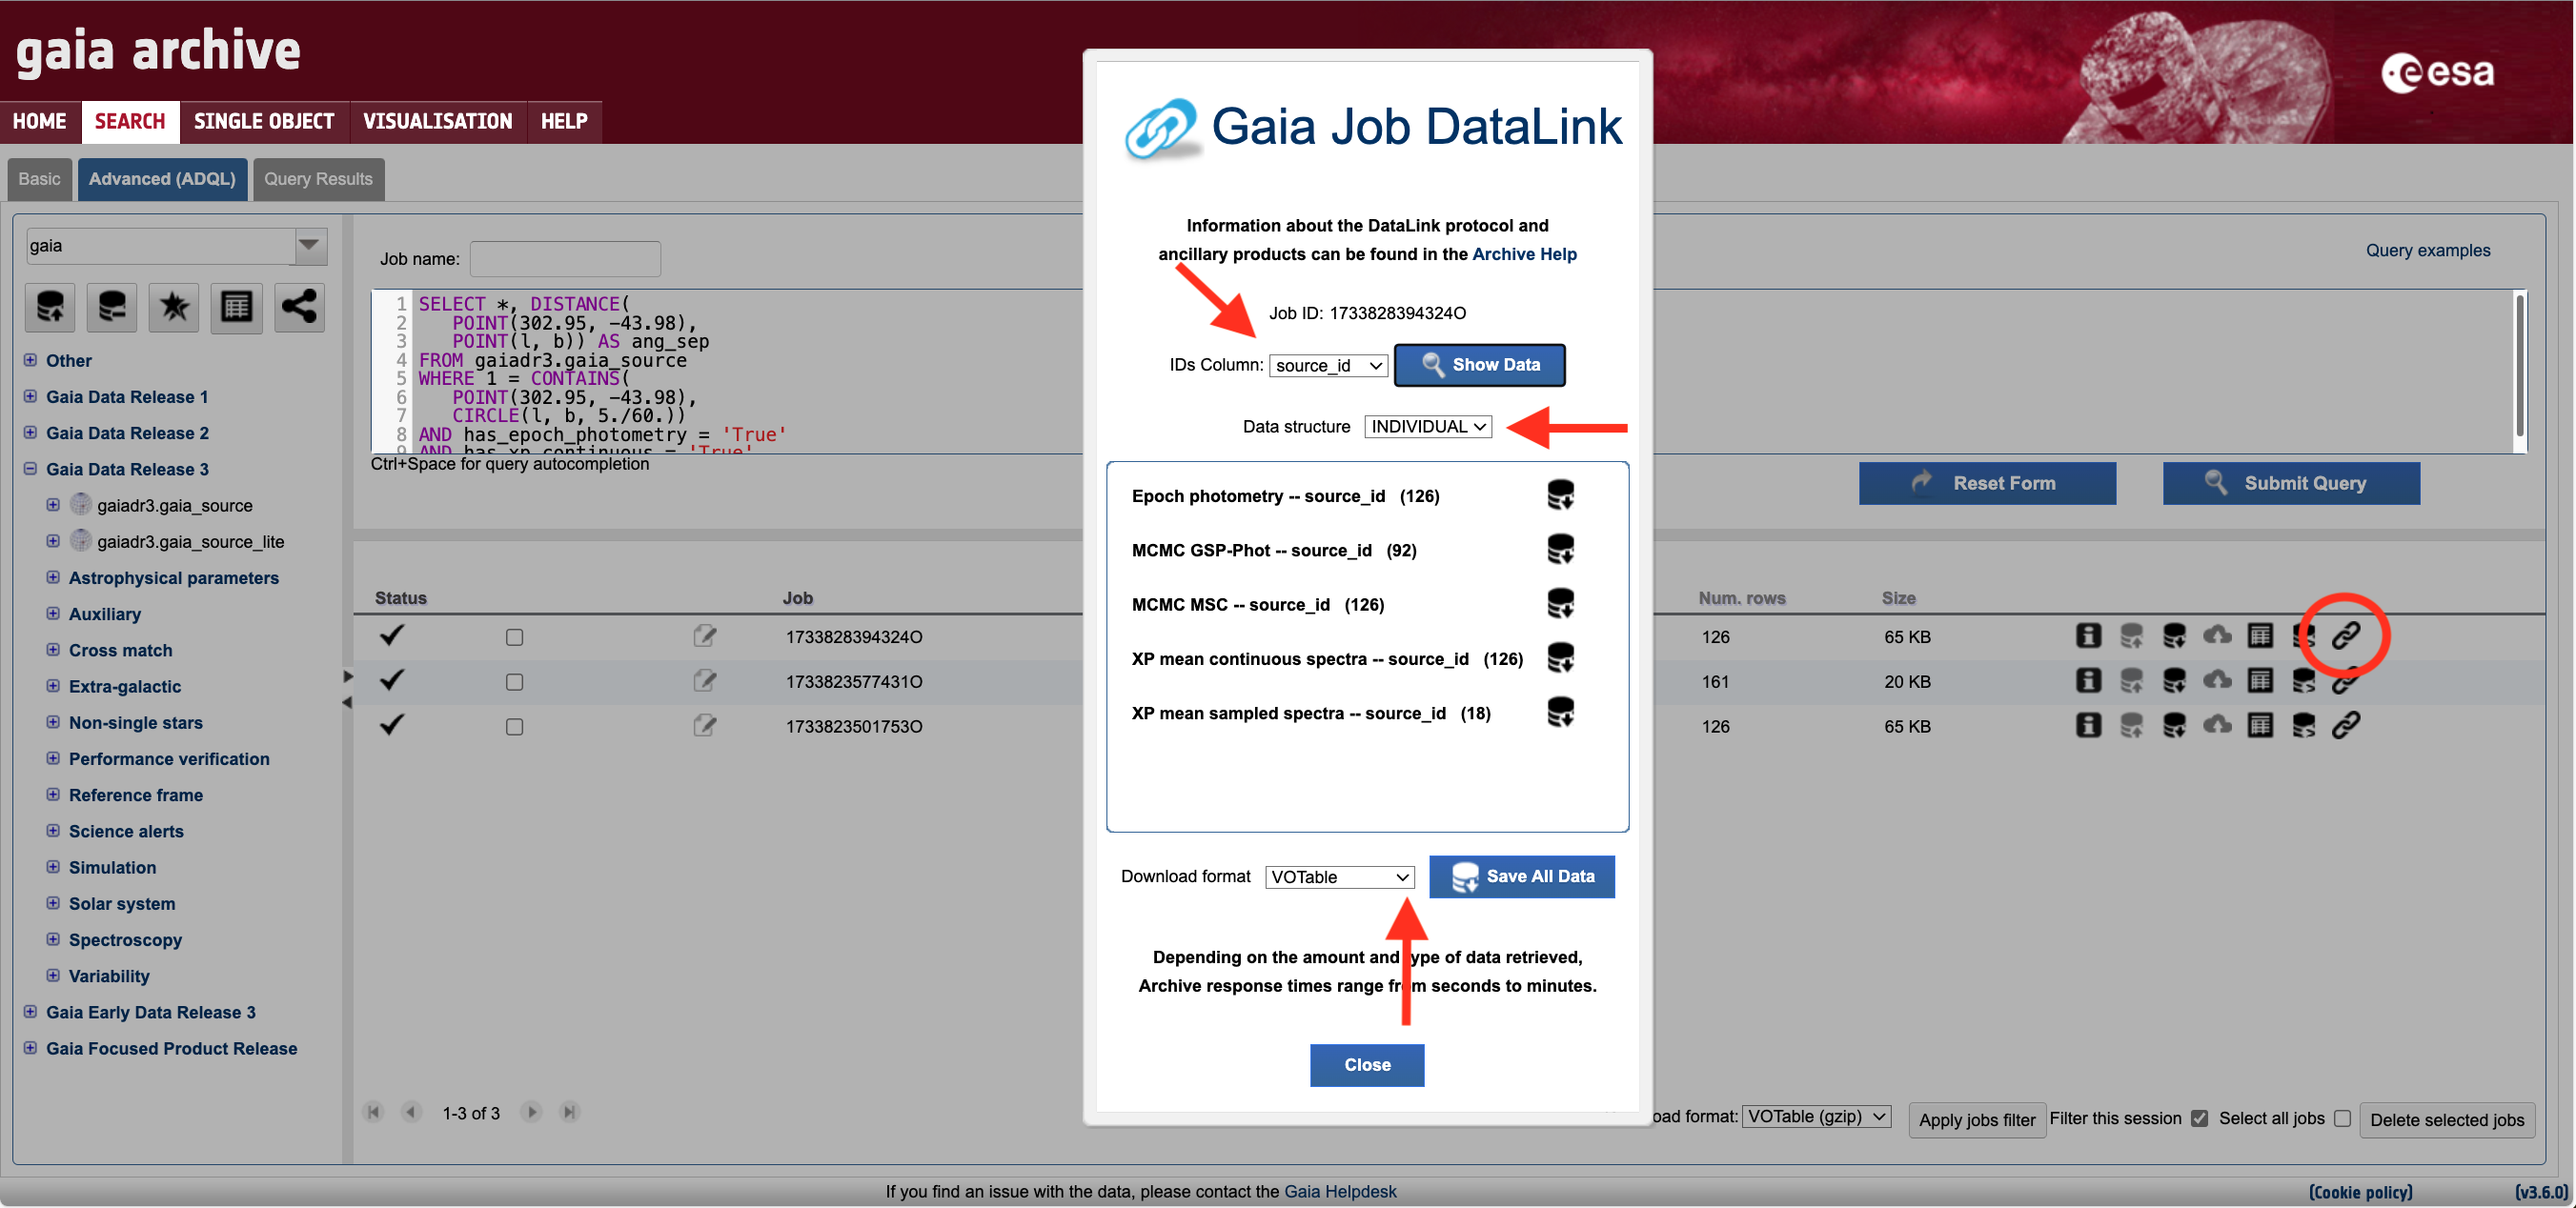
Figure 1: Screenshot of the Gaia ESA Archive web interface DataLink wizard that appears when clicking on the DataLink icon (double chain link encompassed by a red circle above) in the job lists area. The horizontal and vertical arrows point to the drop-down menus that allow to select the data structure (output serialisation) and file format of the files (see the DataLink: Products serialisation tutorial), respectively.
The phot_variable_flag field in the main Gaia DR2 catalogue (gaia_dr2.gaia_source) allows to extract only the sources that include DR2 epoch photometry. The Gaia DR2 equivalent of the previous Gaia DR3 ADQL query is therefore:
SELECT DISTANCE(266.41683, -29.00781, ra, dec) AS separation, *
FROM gaiadr2.gaia_source
WHERE DISTANCE(266.41683, -29.00781, ra, dec) < 0.25 AND
-- Retrieve only sources with associated DataLink products
phot_variable_flag = 'VARIABLE'
ORDER BY separation ASC
3. FPR tables
The Gaia Focused Product Release (FPR) contains 12 catalogues organised into five categories: "Crowded Fields," "Extra-galactic," "Solar System," "Spectroscopy," and "Variability." Among these, only the Extra-galactic (gaiafpr.lens_catalogue_name, gaiafpr.lens_observation, and gaiafpr.lens_outlier) and Variability (gaiafpr.vari_epoch_radial_velocity, gaiafpr.vari_long_period_variable, and gaiafpr.vari_rad_vel_statistics) tables include sources with associated DataLink products that were already published in Gaia Data Release 3. To access these products, it is necessary to JOIN these tables with any of the tables from Gaia Data Release 3 either using the JOB UPLOAD or the table upload mechanism in a two-step way, as shown in the example below:
SELECT TOP 10 * FROM gaiafpr.vari_epoch_radial_velocity
SELECT gaia.designation, fpr.*
FROM gaiadr3.gaia_source AS gaia
JOIN job_upload."job1733156356739I" AS fpr
  ON gaia.source_id = fpr.source_id
Once the output result has been generated, please proceed as explained in the Basic use case section above.
4. User tables
Another popular use case is: "I want to retrieve the DataLink products associated with my list of sources (either valid Gaia source IDs/designations or coordinates)". In this case, the first step is to upload a table with the list of sources to one's user space, as detailed in the Upload a user table tutorial. The second step is to combine that table with any of the catalogues included in Gaia Data Release 3 (or Gaia DR2 if your list of sources belong to this release). Depending on the uploaded data (either source IDs/designations or coordinates), the ADQL query used to combine the two tables will involve a JOIN or a cross-match operation, as detailed below.
4.1 List of sources
If the uploaded list of sources contains valid Gaia source IDs and/or designations, a JOIN operation (as also explained in the Joining Catalogues section of the Catalogue combination tutorial) can be used to combine the tables as follows:
SELECT my_table.*, gaia.source_id
FROM <user_name>.<uploaded_table_name> AS my_table
JOIN gaiadr3.gaia_source AS gaia
  ON my_table.selected_source_ids = gaia.source_id
In this example, the field containing valid Gaia DR3 source IDs in the uploaded table is named as selected_source_ids. Once the output of this query has been generated, please proceed as explained in the Basic use case section above.
4.2 List of coordinates
In this alternative case, the uploaded table contains a list of coordinates; therefore, a cross-match is needed to identify the counterparts in the Gaia catalogue. The Cross-matching two catalogues (basic) section included in the Catalogue combination tutorial explains in detail how to do this using different approaches. For simplicity and to avoid duplication, we provide an example below that applies a basic cross-match - without extra filters or epoch propagation - to a list of equatorial coordinates uploaded to the Archive user space.
SELECT my_table.*, gaia.source_id
FROM <user_name>.<uploaded_table_name> AS my_table
JOIN gaiadr3.gaia_source AS gaia
  ON DISTANCE(my_table.ra, my_table.dec, gaia.ra, gaia.dec) < 5. / 3600.
In this example, the cross-match radius is set to 5 arcseconds, and the fields containing the right ascension and declination coordinates (in the table uploaded by the user) are named ra and dec, respectively. Once the output of this query has been generated, please proceed as explained in the Basic use case section above.
- Removed a total of (2) style text-align:center;
- Removed a total of (22) style text-align:justify;
- Removed a total of (1) style margin:0;
datalink products serialisation
Authors: Héctor Cánovas, Jos de Bruijne, María Henar, Elena Racero, and Alcione Mora
Last update: 2024-12-10
The DataLink IVOA protocol implemented in the Gaia ESA Archive gives access to six different products (epoch photometry, medium- and low-resolution spectra, and probability density distributions for the different astrophysical parameters) available for a significant fraction of the sources included in the main Gaia DR3 table (gaia_dr3.gaia_source). These products are serialised according to different data models, and all of them can be retrieved in multiple file formats as well as multiple data structures. This document describes the contents (both data and metadata) of the DataLink products in the various serialisations generated by the Archive. Further information about the implementation of the DataLink protocol in the Archive is briefly described in the DataLink Service, while the Datalink: Command line access and the DataLink: Access from the web interface describe how to retrieve the DataLink products through the Archive web interface and programmatically, respectively. This other tutorial shows how to use the Astroquery.Gaia Python package to download these products.
The DataLink products served by the Archive (and the data models applied to serialise them) are listed below:
|
Product |
Retrieval type |
Short description |
Data model |
Data release |
|---|---|---|---|---|
|
EPOCH_PHOTOMETRY |
Light curve for a given object in the G, BP, and RP bands. |
DR3 & DR2* | ||
|
MCMC_GSPPHOT |
Monte-Carlo Markov Chain (MCMC) samples for the posterior probability distribution of all parameters derived from the General Stellar Parametrizer from Photometry (GSP-Phot). Some 2000 random MCMC samples are provided for (1) all sources brighter than G=12 mag, (2) a random subset of 1% of the sources fainter than G=12 mag. For all other sources fainter than G=12, the sample size is 100 (the last 100 samples in the MCMC). |
DR3 | ||
|
MCMC_MSC |
Monte-Carlo Markov Chain (MCMC) samples for the posterior probability distribution of all parameters derived from the Multiple Star Classifier (MSC). Some 100 random MCMC samples are provided for each source. |
DR3 | ||
|
XP_CONTINUOUS |
Time-averaged (mean) BP/RP spectra based on the continuous representation in basis functions (see this Chapter). |
DR3 | ||
|
XP_SAMPLED |
Time-averaged (mean) BP/RP externally-calibrated and sampled spectra are provided for a subset of all sources. All spectra are sampled to the same set of absolute wavelength positions, which can be found in the xp_merge table. |
DR3 | ||
|
RVS |
Time-averaged (mean) RVS normalised and sampled spectra are provided for a subset of all sources. |
IVOA spectrum | DR3 |
(*) The DR2 serialisation follows the IVOA Times Series Cube serialisation.
The serialisation of each product is detailed in the following sections.
Tutorial content:
1. retrieval parameters
1.1 Data Structure
This parameter defines the structure of the file that is being prepared for download. There are two possible options:
- INDIVIDUAL (default): one single file per product per selected source(s), with the data serialised in tabular format (one element per table cell).
- RAW: one single file per product, with the data for multiple sources serialised in a tabular format (one or more elements per table cell).
The latter format is the one used internally by the DPAC consortium, and it is documented in the Gaia Data Release 3 documentation (see the Datamodel description chapter).
Since GACS 3.6, the COMBINED data structure has been deprecated. In practise, this structure can be described as a collection of vertically stacked data serialised in the INDIVIDUAL structure.
1.2 Download FILE Format
Available file download formats are:
- VOTable (both binary and plain-text formats, .xml extension)
- FITS
- CSV
- *ECSV (Enhanced Character Separated Values)
The VOTable, FITS, and ECSV file formats provide the table fields and metadata with column descriptions, UCDs, UTYPEs, and units when applicable. The CSV file format only includes the column names.
1.3. output file naming
The data structure and download format define the names of the retrieved files as follows:
|
Data structure |
File name (data for 1 source) |
File name (data for multiple sources) |
|---|---|---|
|
INDIVIDUAL: One file per requested source |
< RETRIEVAL_TYPE >-<DESIGNATION>.<xml/fits/csv/ecsv> |
< RETRIEVAL_TYPE >-<DESIGNATION_1>.<xml/fits/csv/ecsv>, ...., < RETRIEVAL_TYPE >-<DESIGNATION_n>.<xml/fits/csv/ecsv> |
|
RAW: One file with all requested sources |
< RETRIEVAL_TYPE >-<DESIGNATION>.<xml/fits/csv/ecsv> | XP_SAMPLED_RAW.<xml/fits/csv/ecsv> |
By default, the ouput data is downloaded as a compressed .gzip file. However, some internet browsers like, for instance, Safari, automatically expand these files (without asking the user). Note that the file name is agnostic to the data structure selected when retrieving ancillary data associated with a single source.
2. Data Models
The data model for the products serialised in the INDIVIDUAL data structure is described in the following subsections. FOr the sake of simplicity, only the content that differs from the DPAC (RAW) datamodel is detailed below.
2.1 EPOCH PHOTOMETRY
Since GACS 3.6, the INDIVIDUAL serialisation of the epoch photometry follows the IVOA Time Series: Annotation of light curves in VOTable (Case #1). For reference, the previous serialisation is detailed in the Archive Help historical content. The "source_id" and "solution_id" information is provided in the file metadata (as PARAM elements in the VOTable format), and all the table fields are described in the DPAC (RAW) data model except for the "rejected_by_photometry" and "<band>_other_flags" fields detailed below:
|
Field |
Data type |
UCD |
Description |
|---|---|---|---|
|
rejected_by_photometry |
boolean |
meta.code.status |
Rejected by DPAC photometric processing. This Boolean field is set to False if there is no flux or flux_error in the G band (g_transit_flux or g_transit_flux_error == NULL or NaN). |
|
g_other_flags |
long |
meta.code.status |
Additional processing flags. This field contains extra information on the data used to compute the fluxes and their quality. It provides debugging information that may be safely ignored for many general purpose applications. The field is a collection of binary flags, whose values can be recovered by applying bit shifting and masking operations.
|
| bp_other_flags | long | meta.code.status |
|
| rp_other_flags | long | meta.code.status |
|
Example Python code to extract the Boolean flags encoded in the "g_other_flags" bitmask:
from astropy.table import Table
epoch   = Table.read('EPOCH_PHOTOMETRY-Gaia DR3 5616512450772689536.xml')
bitmask = epoch['g_other_flags'].tolist()
# Decode photometry_flag_sm_reject:
bit_pos      = 0
ind_flag_dec = [bool((inp >> bit_pos) & 1) for inp in bitmask]
# Decode photometry_flag_af2_unavailable:
bit_pos      = 15 ind_flag_dec = [bool((inp >> bit_pos) & 1) for inp in bitmask]
2.2 MCMC's: GSP-PHOT & MSC samples
Both the serialisation of the MCMC GSP-Phot samples and the MCMC MSC samples follows the DPAC data model, with the only exceptions being the "nsamples" field that is not included and the array serialisation (the array columns are flattened to one value per entry). No metadata is added into the file header, and all the information is repeated through the output table so each row is self-contained.
2.3 XP CONTINUOUS spectra
The XP Continuous mean spectra are serialised without deviations from the original DPAC data model for any data structure. The table metadata contains neither units nor UTYPEs.
2.4 XP SAMPLED mean spectra and rvs mean spectra
The INDIVIDUAL serialisation of the XP sampled mean spectra and the RVS mean spectra follows the IVOA Spectra Data Model. In the table below, the rows in white and green background indicate the fields included in the table metadata and data, respectively. Note that, due to the 8-characters length limit imposed by the FITS format to the keyword names, the (added) table metadata parameters are re-named when serialising this product in FITS format. None of the metadata fields is included in the files generated in .csv format, which follows a particular serialisation (similar to the DPAC RAW serialisation but including a wavelength column).
|
Field (VOTable) |
Field (FITS) |
Unit |
Data type |
UCD |
UTYPE |
|---|---|---|---|---|---|
|
SOURCEID |
long |
meta.id;src |
spec:Target.Name |
||
|
SOLUTION |
long |
meta.version |
|
||
|
NTRANSIT |
int |
|
|
||
|
NCCDS |
int |
|
|
||
|
NDEBLEND |
int |
|
|
||
|
spatialLocation** |
POS |
deg |
double[] |
pos.eq |
spec:Char.SpatialAxis.Coverage.Location.Value |
|
TimeAxisCoverageLocation |
REFEPOCH |
yr |
double |
time.epoch |
spec:Char.TimeAxis.Coverage.Location.Value |
|
TimeAxisCoverageBoundsExtent |
EPOCHEXT |
yr |
double |
time.duration |
spec:Char.TimeAxis.Coverage.Bounds.Extent |
|
spectralAccuracyStatError |
WAVEERRO |
nm |
double |
stat.error;em.wl |
spec:Char.SpectralAxis.Accuracy.StatError |
|
spectralLocation |
- |
nm |
double |
instr.bandpass |
spec:Char.SpectralAxis.Coverage.Location.Value |
|
spectralCoverageBoundsExtent |
WAVEEXTE |
nm |
double |
instr.bandwidth |
spec:Char.SpectralAxis.Coverage.Bounds.Extent |
|
spectralCoverageBoundsStart |
WAVESTAR |
nm |
double |
stat.min |
spec:Char.SpectralAxis.Coverage.Bounds.Start |
|
spectralCoverageBoundsStop |
WAVEEND |
nm |
double |
stat.max |
spec:Char.SpectralAxis.Coverage.Bounds.Stop |
|
SpatialExtent |
APERTURE |
deg |
double |
instr.fov |
spec:Spectrum.Char.SpatialAxis.Coverage.Bounds.Extent |
|
DataModel |
DATAMODE |
string |
|
spec:Spectrum.DataModel |
|
|
Publisher |
PUBLISHE |
string |
meta.curation |
spec:Curation.Publisher |
|
|
Title |
TITLE |
string |
|
spec:DataID.Title |
|
|
SpectralAxisUcd |
- |
string |
|
spec:Spectrum.Char.SpectralAxis.Ucd |
|
|
SpectralAxisUnit |
SPECTRAL |
string |
|
spec:Spectrum.Char.SpectralAxis.Unit |
|
|
FluxAxisUcd |
FLUXAXIS |
string |
|
spec:Spectrum.Char.FluxAxis.Ucd |
|
|
FluxAxisUnit |
|
string |
|
spec:Spectrum.Char.FluxAxis.Unit |
|
|
wavelength |
|
nm |
double |
em.wl |
spec:Data.SpectralAxis.Value |
|
flux*** |
|
[None]/ [W.m**-2.nm**-1] |
float |
phot.flux;em.opt.I |
|
|
flux_error*** |
|
[None]/ [W.m**-2.nm**-1] |
float |
stat.error;phot.flux;em.opt.I |
|
(*) The combined_transits, combined_ccds, and deblended_ccd PARAM elements are only present in the RVS mean spectra.
(**) XP sampled mean spectra flux and flux_error units are [W.m**-2.nm**-1], while the RVS mean spectra is normalised and hence its flux and flux_error have no units.
(***) The spatial location contains the ra and dec fields included in the XP sampled mean spectra and RVS mean spectra.
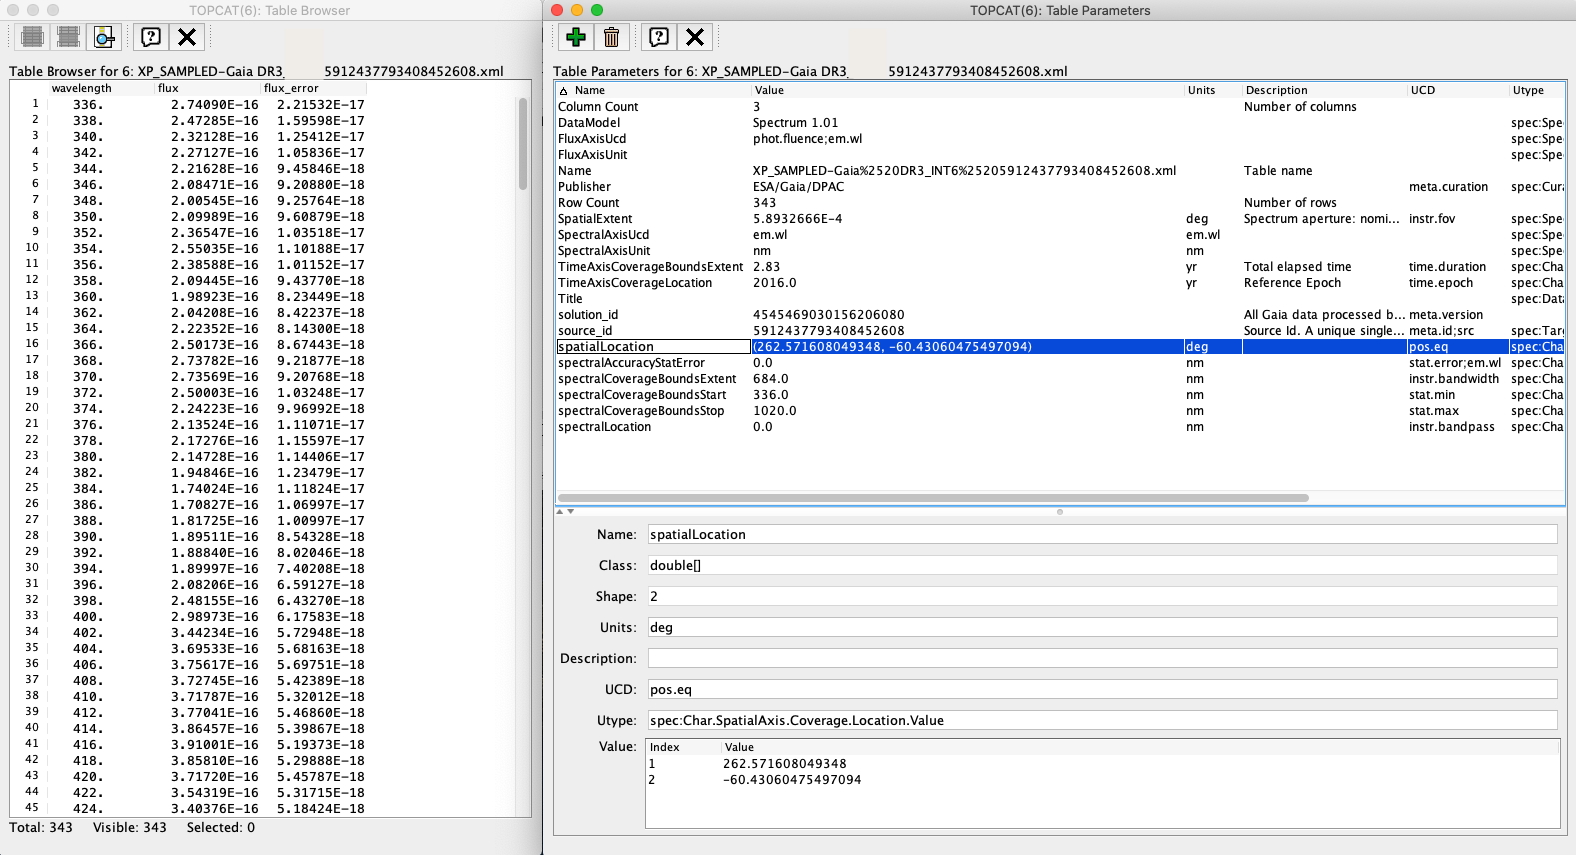
Figure 1: excerpt from the XP Sampled Spectrum table and metadata as shown by TOPCAT.
- Removed a total of (216) style text-align:center;
- Removed a total of (22) style text-align:justify;
- Removed a total of (1) style margin:0;
- Removed a total of (4) align=center.
- Removed a total of (4) border attribute.
- Removed a total of (2) cellpadding attribute.
- Removed a total of (2) cellspacing attribute.
- Removed a total of (1) style display:none;
Datalink: python access
Authors: Héctor Cánovas and Jos de Bruijne
Last update: 2024-12-10
The main goal of the Jupyter Notebook displayed below is to teach how to retrieve and inspect the DataLink products using the Astroquery.Gaia Python package. This code has been tested in Python >= 3.10, using the Astroquery.Gaia 0.4.8.dev9604. At the moment of publishing this tutorial, this version is not yet available via the popular "pip install" or "conda install" commands. Instead, it has to be retrieved from the Astroquery Github repository and then installed locally (as explained in the "Building from source" section in the main Astroquery documentation page). This Jupyter notebook and the complementary Tutorial - Programmatic download of large datasets through DataLink notebook are included in this zip file that also contains a yaml file that can be used to create a conda environment with all dependencies needed to execute it (as explained in the conda documentation page).

Tutorial: Retrieve (all) the DataLink products associated to a sample
Release number: v1.1 (2024-12-10)
Applicable Gaia Data Releases: Gaia EDR3, Gaia DR3
Author: Héctor Cánovas Cabrera; hector.canovas@ext.esa.int
Summary:
This code shows how to retrieve the different DataLink products from an input list of Gaia DR3 sources. These products are serialised in two different data structures:
- INDIVIDUAL (that follows the IVOA data model recommendations whenever possible), and
- RAW (the internal format used by the Gaia collaboration.
Both data structures contain virtually the same information. This notebook shows how to access to the data and metadata of the products retrieved in INDIVIDUAL data structure. For simplicity, the files are downloaded in VOTable format (to have an overview of the serialisation options of the DataLink products served by the Gaia ESA Archive please read the DataLink products serialisation tutorial).
Useful URLs:
- Questions or suggestions
- Tutorials, documentation, and more
- Known issues in the Gaia data
- Gaia data credits and acknowledgements
- GaiaXPy: GaiaXPy is a Python library to facilitate handling Gaia BP/RP spectra as distributed from the Gaia archive.
- Astropy: VOTable XML handling
from astroquery.gaia import Gaia
import matplotlib.pyplot as plt
def plot_e_phot(inp_table, colours  = ['green', 'red', 'blue'], title = '', fontsize = 12, show_legend = True, show_grid = True, figsize = [20,5]):
              ""
              "Epoch photometry plotter. 'inp_table' MUST be an Astropy-table object."
              ""
              fig       = plt.figure(figsize=figsize)
              time_zero = 2455197.5 # See: https://gea.esac.esa.int/archive/documentation/GDR3/Gaia_archive/chap_datamodel/sec_dm_photometry/ssec_dm_epoch_photometry.html#epoch_photometry-g_transit_time
              xlabel    = f'JD date [TCB - {time_zero}]'
              ylabel    = f'magnitude'
              plt.gca().invert_yaxis()
              plt.plot(inp_table['g_transit_time'], inp_table['g_transit_mag'], 'o', label = 'G',  color = 'green')
              plt.plot(inp_table['bp_obs_time'],    inp_table['bp_mag'],        'o', label = 'BP', color = 'blue')
              plt.plot(inp_table['rp_obs_time'],    inp_table['rp_mag'],        'o', label = 'RP', color = 'red')
              make_canvas(title = title, xlabel = xlabel, ylabel = ylabel, fontsize= fontsize, show_legend=show_legend, show_grid = show_grid)
              plt.show()
def plot_sampled_spec(inp_table, color = 'blue', title = '', fontsize = 14, show_legend = True, show_grid = True, linewidth = 2, figsize = [20,5], show_plot = True):
              ""
              "RVS & XP sampled spectrum plotter. 'inp_table' MUST be an Astropy-table object."
              ""
              if show_plot:
              fig      = plt.figure(figsize=figsize)
              xlabel   = f'Wavelength [{inp_table["wavelength"].unit}]'
              ylabel   = f'Flux [{inp_table["flux"].unit}]'
              plt.plot(inp_table['wavelength'], inp_table['flux'], '-', linewidth = linewidth)
              make_canvas(title = title, xlabel = xlabel, ylabel = ylabel, fontsize= fontsize, show_legend=False, show_grid = show_grid)
              if show_plot:
                 plt.show()
def make_canvas(title = '', xlabel = '', ylabel = '', show_grid = False, show_legend = False, fontsize = 12):
              ""
              "Create generic canvas for plots"
              ""
              plt.title(title,    fontsize = fontsize)
              plt.xlabel(xlabel,  fontsize = fontsize)
              plt.ylabel(ylabel , fontsize = fontsize)
              plt.xticks(fontsize = fontsize)
              plt.yticks(fontsize = fontsize)
              if show_grid:
                 plt.grid()
              if show_legend:
                 plt.legend(fontsize = fontsize*1.25)
Gaia.login()
Download data sample
The query below retrieves a random sample of Gaia (E)DR3 sources having all types of DataLink products.
query = f"SELECT source_id, ra, dec, pmra, pmdec, parallax \
            FROM gaiadr3.gaia_source \
            WHERE has_epoch_photometry = 'True' \
            AND has_xp_sampled = 'True'\
            AND has_rvs = 'True' \
            AND has_mcmc_msc = 'True' \
            AND has_mcmc_gspphot = 'True' \
            AND random_index between 0 and 200000"
job     = Gaia.launch_job_async(query)
results = job.get_results()
print(f'Table size (rows): {len(results)}')
results
Download DataLink Products: INDIVIDUAL
The example below retrieves ALL available DataLink products for the input sample of Gaia Source IDs. This option significantly increases the total download time, and here it is selected only for teaching purposes. If you are not interested in downloading all products we recommend you to specify the DataLink product in retrieval_type.
The downloaded files can be stored locally by specifying the output file directory via the output_file option in the load_data method below. Note that:
- The DataLink products are stored in a .gz compressed directory. To avoid errors, this shoud be considered when naming the output file, e.g.,
output_file = 'datalink_output.gz' - The individual files will also be saved in the same directory from where this notebook is being launched. This is a known bug and we are working to fix it.
retrieval_type = 'ALL'          # Options are: 'EPOCH_PHOTOMETRY', 'MCMC_GSPPHOT', 'MCMC_MSC', 'XP_SAMPLED', 'XP_CONTINUOUS', 'RVS', 'ALL'
data_structure = 'INDIVIDUAL'   # Options are: 'INDIVIDUAL' and 'RAW'
data_release   = 'Gaia DR3'     # Options are: 'Gaia DR3' (default), 'Gaia DR2'
datalink = Gaia.load_data(ids=results['source_id'], data_release = data_release, retrieval_type=retrieval_type, data_structure = data_structure, verbose = False)
dl_keys  = [inp for inp in datalink.keys()]
dl_keys.sort()
print()
print(f'The following Datalink products have been downloaded:')
print('-' * 160)
for dl_key in dl_keys:
   print(f' * {dl_key}')
Detailed content
The DataLink products are stored inside a Python Dictionary. Each element (key) of the dictionary consist in a 1-element list that contains a VOTable XML file. This file contains both useful data and metadata that can be examined as explained below (see for details the DataLink: Products serialisation tutorial). The example below shows how to inspect (and plot) the content of different products - feel free to play with the code to explore the different options available.
Note that the time unit for the epoch photometry product is Barycentric JD in TCB −2455197.5 (day) (see the corresponding DataModel chapter)
dl_key   = dl_keys[0]           # Select an element from the dl_keys() list displayed above
votable  = datalink[dl_key][0]  # Select the first (and only) element of the list

# Display VOTable metadata ================
print(f'File metadata:')
print('-' * 160)
for item in votable.iter_fields_and_params():
    print(item)

# Display VOTable data ====================
print(f'File data:')
print('-' * 160)
votable_data = votable.to_table()
display(votable_data[0:3])

source_id = votable.get_field_by_id('source_id').value

if 'EPOCH_PHOTOMETRY' in dl_key:
   title     = f'Epoch photometry Gaia DR3 {source_id}'
   plot_e_phot(votable_data, colours  = ['green', 'red', 'blue'], title = title, fontsize = 12, show_legend = True, show_grid = True, figsize = [20,5])
else:
   if 'RVS' or 'XP_SAMPLED' in dl_key:
        title     = f'Spectra: Gaia DR3 {source_id}'
        plot_sampled_spec(votable_data, title = title, fontsize = 12, show_legend = True, show_grid = True, figsize = [20,5], linewidth= 3)

- Removed a total of (1) align=right.
Tutorial - Programmatic download of large datasets through DataLink
Authors: Héctor Cánovas and Jos de Bruijne
Last update: 2024-12-10
The main goal of the Jupyter Notebook displayed below is to teach how to retrieve large amounts (data for more than 5000 sources) of DataLink products using the Astroquery.Gaia Python package. This code has been tested in Python >= 3.10, using the Astroquery.Gaia 0.4.8.dev9604. At the moment of publishing this tutorial, this version is not yet available via the popular "pip install" or "conda install" commands. Instead, it has to be retrieved from the Astroquery Github repository and then installed locally (as explained in the "Building from source" section in the main Astroquery documentation page). This Jupyter notebook and the complementary DataLink: Python access notebook are included in this zip file that also contains a yaml file that can be used to create a conda environment with all dependencies needed to execute it (as explained in the conda documentation page).
Tutorial: Download DataLink products for >5000 sources
Release number: v1.1 (2024-12-10)
Applicable Gaia Data Releases: Gaia EDR3, Gaia DR3
Author: Héctor Cánovas Cabrera; hector.canovas@ext.esa.int
Summary:
This Jupyter Notebook allows to overcome the Gaia Archive DataLink products download threshold (5,000 sources) by first splitting an input source list into multiple chunks of 500 sources each. Our tests show that:
- retrieving the data in chunks is at least three times faster (exact values depend on the selected product and file format) than retrieving the data individually (one call per product per source ID), and
- varying the chunk sizes between 50 and 1,000 sources has negligible impact in the total download time.
In this tutorial, we set:
- the chunk size to 500 elements (source IDs),
- the data structure to INDIVIDUAL, and
- the format to VOTable
See the DataLink: products serialisation tutorial for info about the data structures and formats served by the Gaia Archive. This complementary tutorial shows how to download and inspect all the different DataLink products via Astroquery.Gaia for a small sample of sources.
Useful URLs:
from astropy.table import Table
              from astroquery.gaia import Gaia
              import matplotlib.pyplot as plt
def chunks(lst, n):
              ""
              "Split an input list into multiple chunks of size =< n"
              ""
              for i in range(0, len(lst), n):
                 yield lst[i:i + n]

def plot_e_phot(inp_table, colours  = ['green', 'red', 'blue'], title = '', fontsize = 12, show_legend = True, show_grid = True, figsize = [20,5]):
              ""
              "Epoch photometry plotter. 'inp_table' MUST be an Astropy-table object."
              ""
              fig       = plt.figure(figsize=figsize)
              time_zero = 2455197.5 # See: https://gea.esac.esa.int/archive/documentation/GDR3/Gaia_archive/chap_datamodel/sec_dm_photometry/ssec_dm_epoch_photometry.html#epoch_photometry-g_transit_time
              xlabel    = f'JD date [TCB - {time_zero}]'
              ylabel    = f'magnitude'
              plt.gca().invert_yaxis()
              plt.plot(inp_table['g_transit_time'], inp_table['g_transit_mag'], 'o', label = 'G',  color = 'green')
              plt.plot(inp_table['bp_obs_time'],    inp_table['bp_mag'],        'o', label = 'BP', color = 'blue')
              plt.plot(inp_table['rp_obs_time'],    inp_table['rp_mag'],        'o', label = 'RP', color = 'red')
              make_canvas(title = title, xlabel = xlabel, ylabel = ylabel, fontsize= fontsize, show_legend=show_legend, show_grid = show_grid)
              plt.show()

def plot_sampled_spec(inp_table, color = 'blue', title = '', fontsize = 14, show_legend = True, show_grid = True, linewidth = 2, figsize = [20,5], show_plot = True):
              ""
              "RVS & XP sampled spectrum plotter. 'inp_table' MUST be an Astropy-table object."
              ""
              if show_plot:
              fig      = plt.figure(figsize=figsize)
              xlabel   = f'Wavelength [{inp_table["wavelength"].unit}]'
              ylabel   = f'Flux [{inp_table["flux"].unit}]'
              plt.plot(inp_table['wavelength'], inp_table['flux'], '-', linewidth = linewidth)
              make_canvas(title = title, xlabel = xlabel, ylabel = ylabel, fontsize= fontsize, show_legend=False, show_grid = show_grid)
              if show_plot:
                 plt.show()

def make_canvas(title = '', xlabel = '', ylabel = '', show_grid = False, show_legend = False, fontsize = 12):
              ""
              "Create generic canvas for plots"
              ""
              plt.title(title,    fontsize = fontsize)
              plt.xlabel(xlabel,  fontsize = fontsize)
              plt.ylabel(ylabel , fontsize = fontsize)
              plt.xticks(fontsize = fontsize)
              plt.yticks(fontsize = fontsize)
              if show_grid:
              plt.grid()
              if show_legend:
              plt.legend(fontsize = fontsize*1.25)
Gaia.login()
Execute ADQL Query
The query below retrieves data for 5100 sources that have associated all the DataLink products offered in Gaia DR3.
query = "SELECT TOP 5100 source_id, ra, dec, parallax from gaiadr3.gaia_source \
            WHERE has_epoch_photometry = 'True' AND \
            has_mcmc_gspphot = 'True' AND \
            has_mcmc_msc = 'True' AND \
            has_xp_sampled = 'True' AND \
            has_rvs = 'True'"
job     = Gaia.launch_job_async(query)
results = job.get_results()
results[0:5]
Download Datalink Products
Warning: The load_data method allows to retrieve all types of DataLink products (epoch photometry, MCMC's, and spectra) in one single call (see below). However, selecting this option when attempting to retrieve DataLink products for large (>1000) amount of sources can severely delay the dataset preparation on the server side, and even result in a download error. Therefore, we strongly recommend to select one a product at a time in this case.
Split the input list into several chunks containing =<500 elements each, and store the data locally
Notes:
- The total download time of the example below is ~200 seconds.
- The DataLink products are stored inside gzip compressed files named as "datalink_output_
.zip"
chunk_size   = 500
ids          = results['source_id']
ids_chunks   = list(chunks(ids, chunk_size))
datalink_all = []
print(f'* Input list contains {len(ids)} source_IDs')
print(f'* This list is split into {len(ids_chunks)} chunks of <= {chunk_size} elements each')
retrieval_type = 'RVS'        # Options are: 'EPOCH_PHOTOMETRY', 'MCMC_GSPPHOT', 'MCMC_MSC', 'XP_SAMPLED', 'XP_CONTINUOUS', 'RVS'
data_structure = 'INDIVIDUAL' # Options are: 'INDIVIDUAL' and 'RAW'.
data_release   = 'Gaia DR3'   # Options are: 'Gaia DR3' (default), 'Gaia DR2'
datalink_all   = []
ii = 0
for chunk in ids_chunks:
   ii = ii + 1
   print(f'Downloading Chunk #{ii}; N_files = {len(chunk)}')
   datalink  = Gaia.load_data(ids=chunk, data_release = data_release, retrieval_type=retrieval_type, format = 'votable', data_structure = data_structure, dump_to_file=True)
   datalink_all.append(datalink)
Merge chunks into one single object (Python dictionary)
datalink_out = datalink_all[0]

for inp_dict in datalink_all[1:]:
   datalink_out.update(inp_dict)

keys = list(datalink_out.keys())
print(f'* The merged dictionary contains {len(keys)} elements')
# Examine and display data for one selected element
index = 0

votable  = datalink_out[keys[0]][0]                      # Select the first (and only) element of the list

# Display VOTable metadata ================
print(f'File metadata:')
print('-' * 160)
for item in votable.iter_fields_and_params():
   print(item)

# Display VOTable data ====================
print(f'File data:')
print('-' * 160)
votable_data = votable.to_table()
display(votable_data[0:3])

source_id = votable.get_field_by_id('source_id').value

title     = f'Spectra: Gaia DR3 {source_id}'
plot_sampled_spec(votable_data, title = title, fontsize = 12, show_legend = True, show_grid = True, figsize = [20,5], linewidth= 3)

- Removed a total of (1) align=right.