
 Sign in
Picture Gallery - Planck
Planck Image Gallery
Below are a selection of useful images extracted from the Planck papers. If you use any of these images in a publication, please reference the corresponding paper and acknowledge "ESA and the Planck Collaboration". For more images, please visit the Multimedia Gallery of Planck.
2018 results
|
Figure
|
Short description
|
|---|---|
 |
The 2018 Planck maps in Intensity, from 30 to 857 GHz [July 2018] |
 |
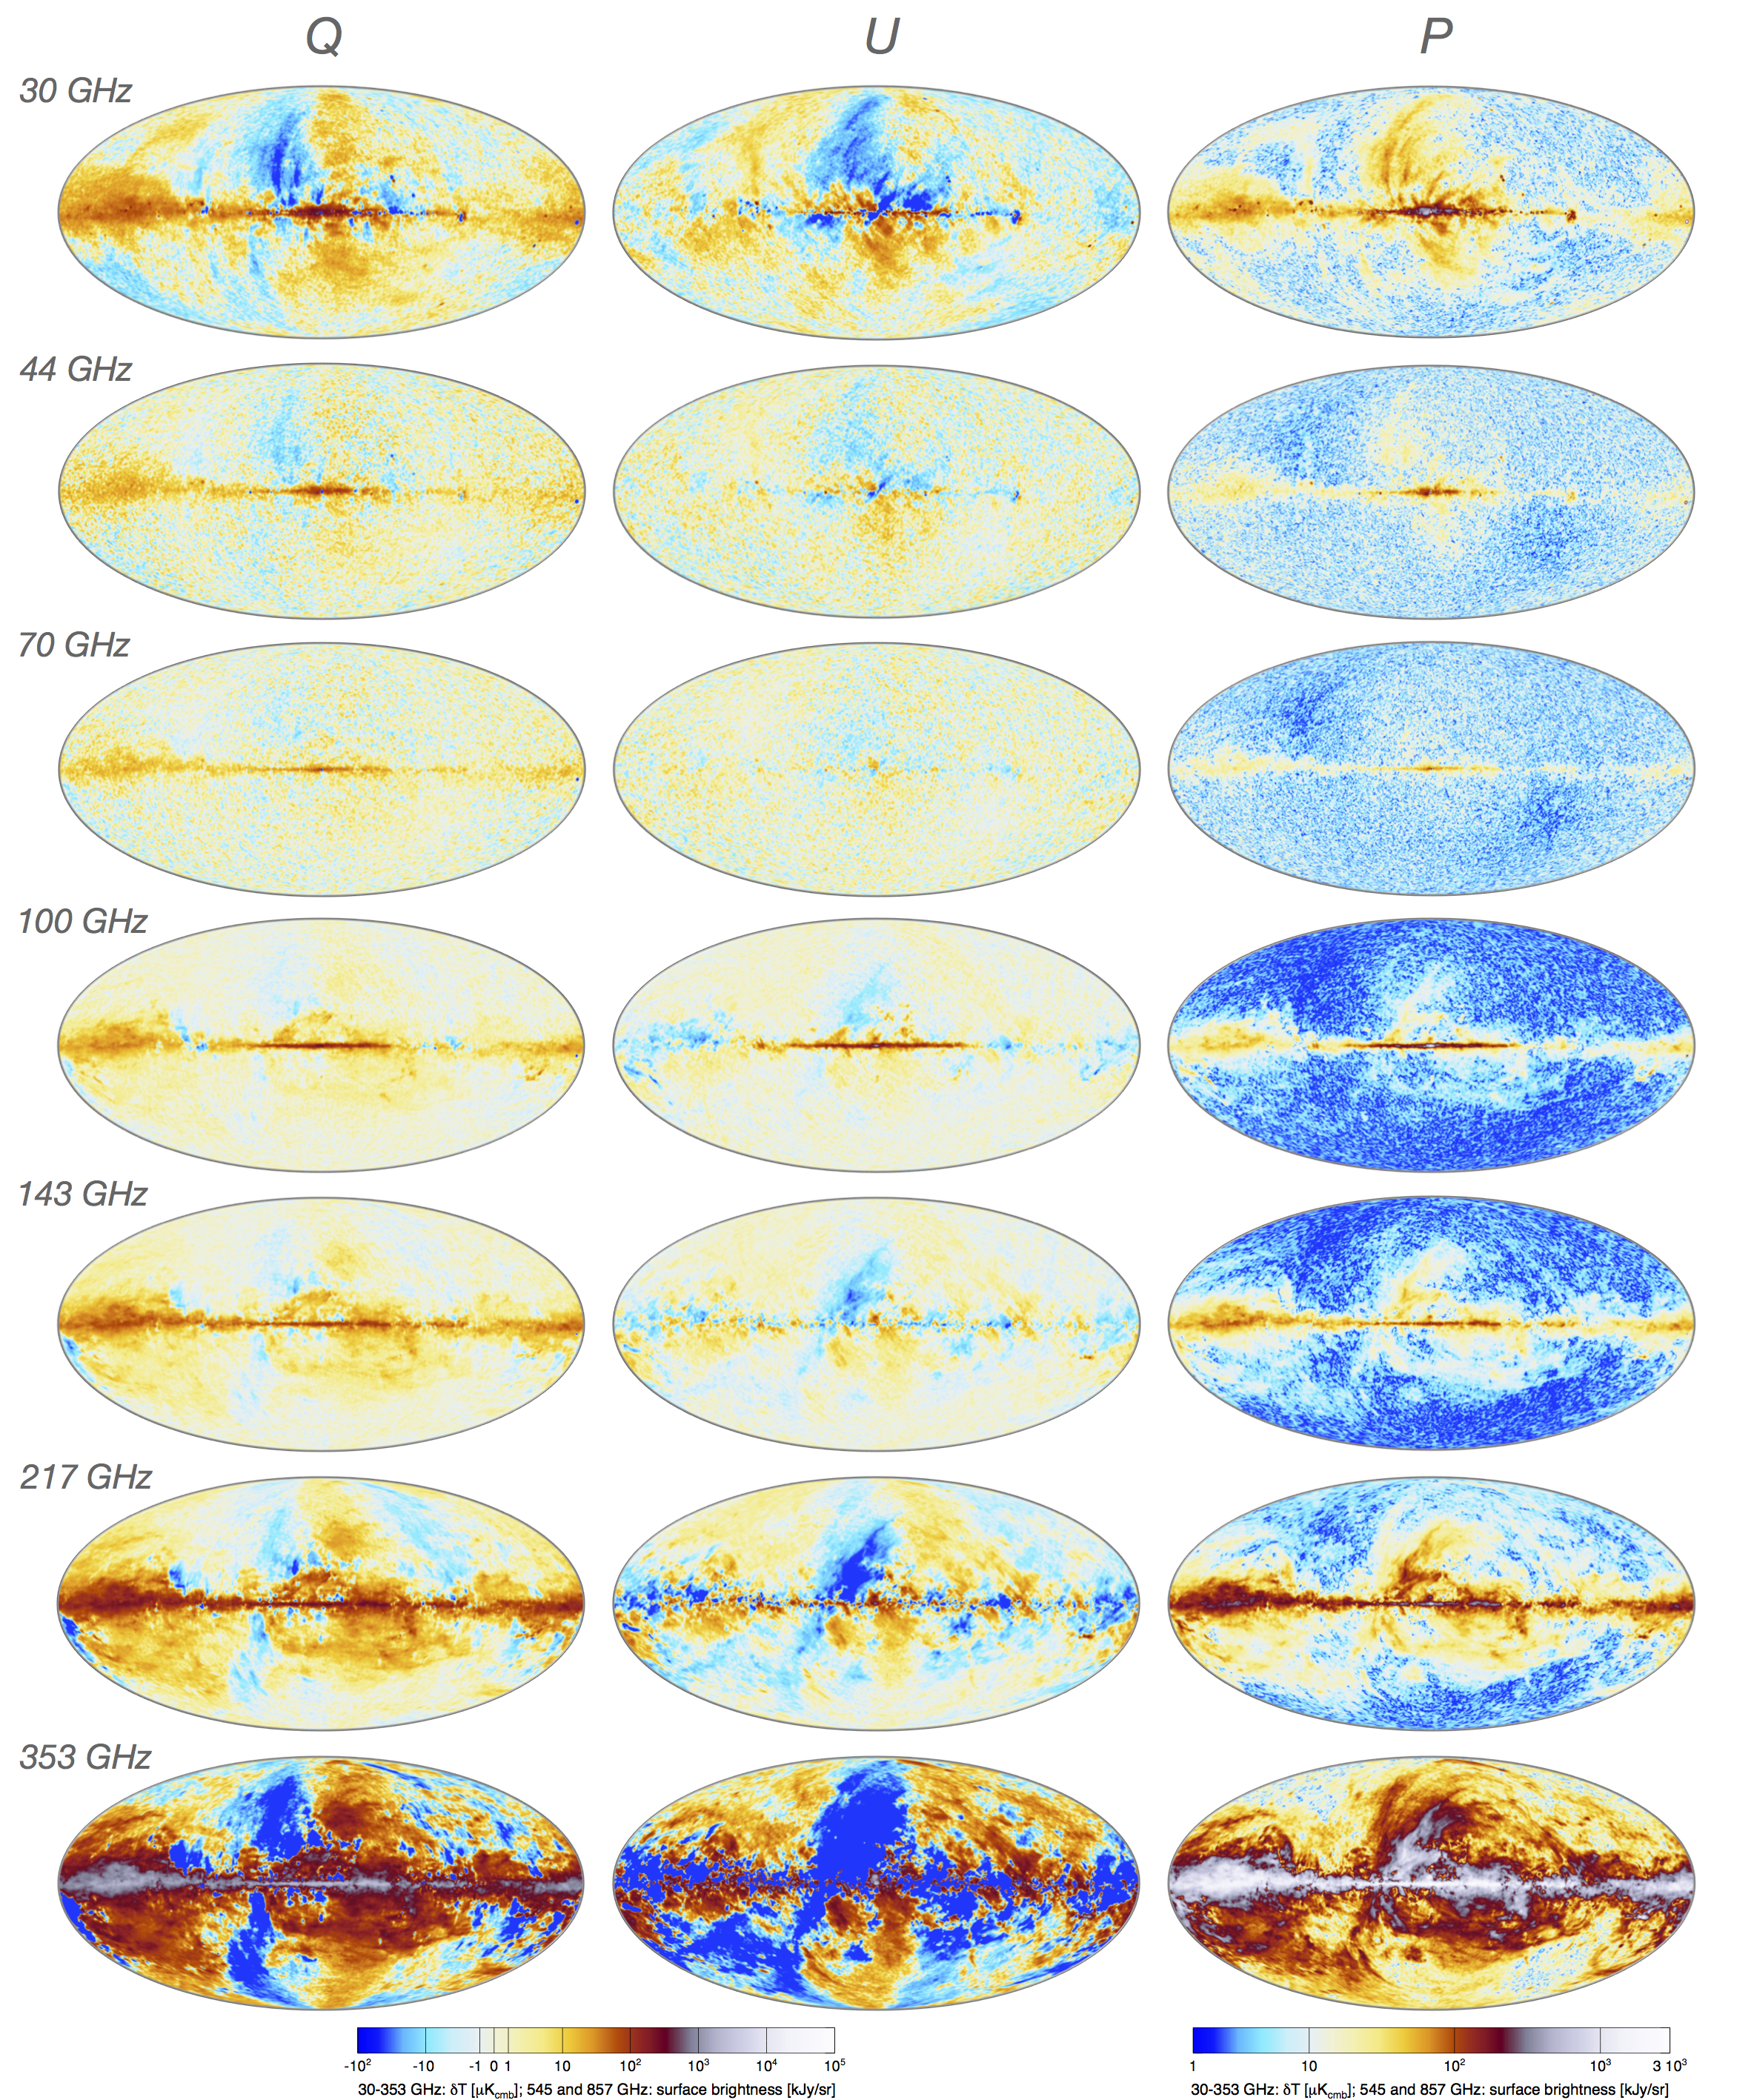
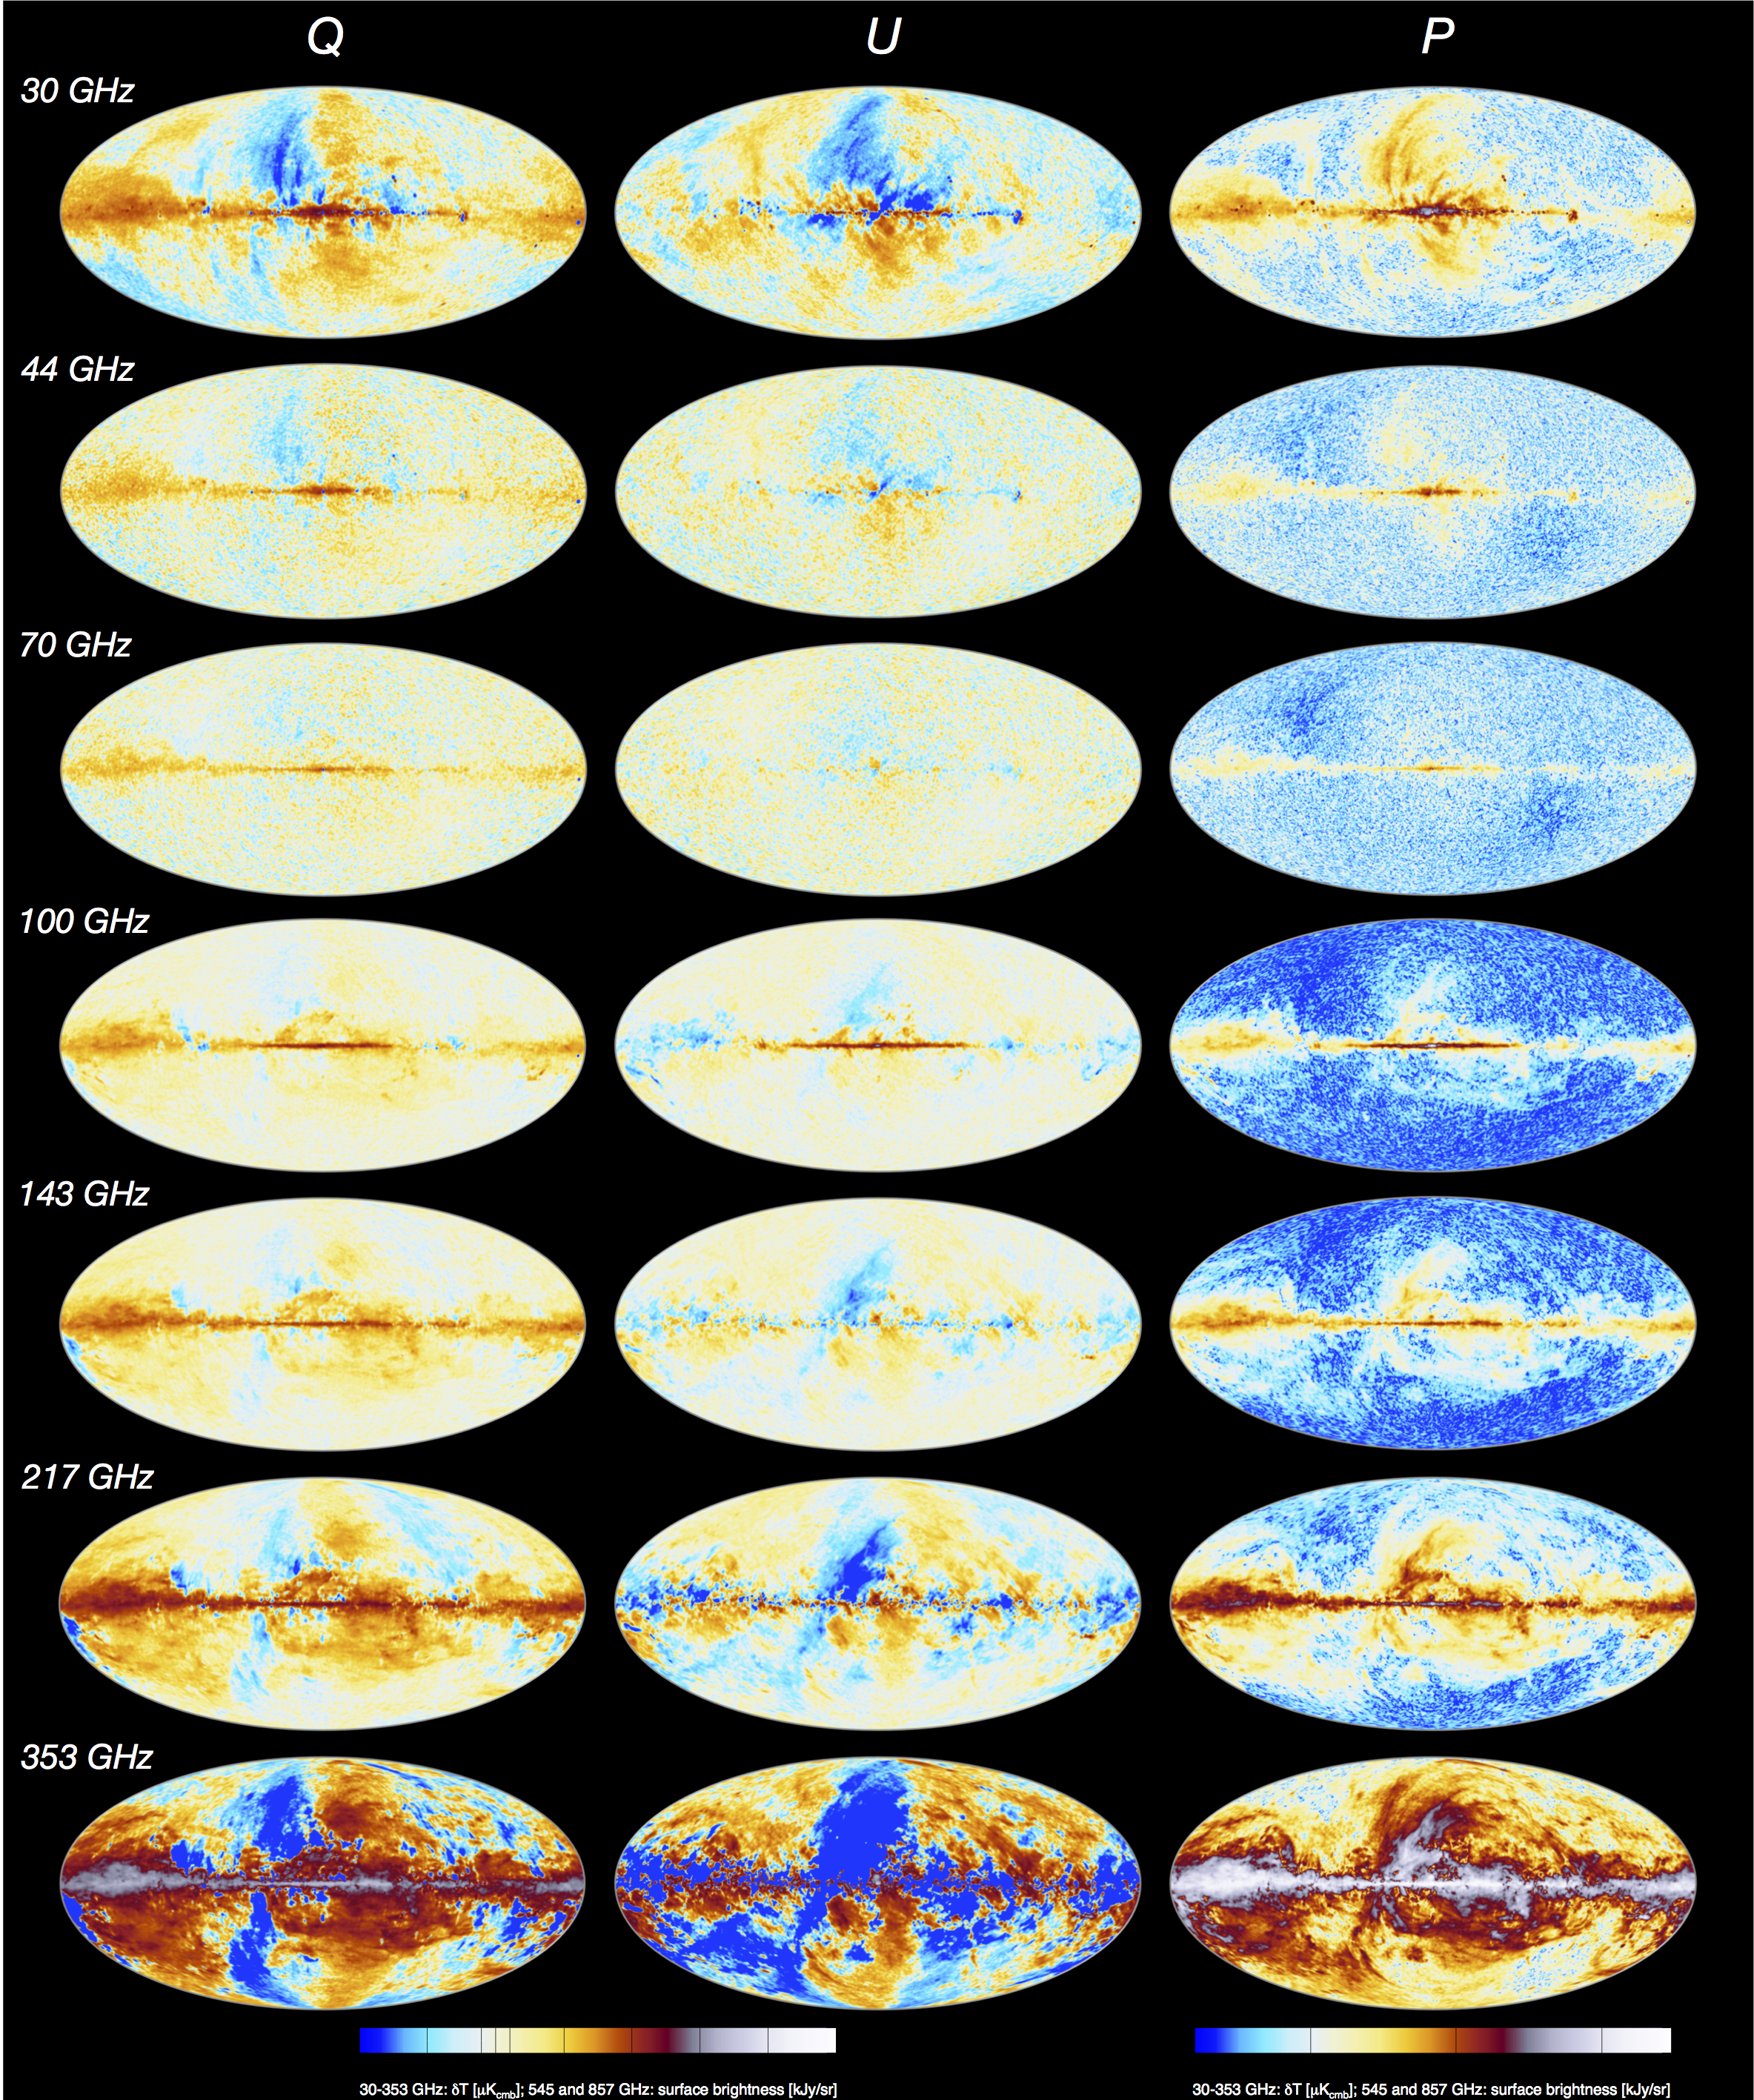
The 2018 Planck maps in polarization (Stokes Q, U, and polarized amplitude P) [July 2018] |
 |
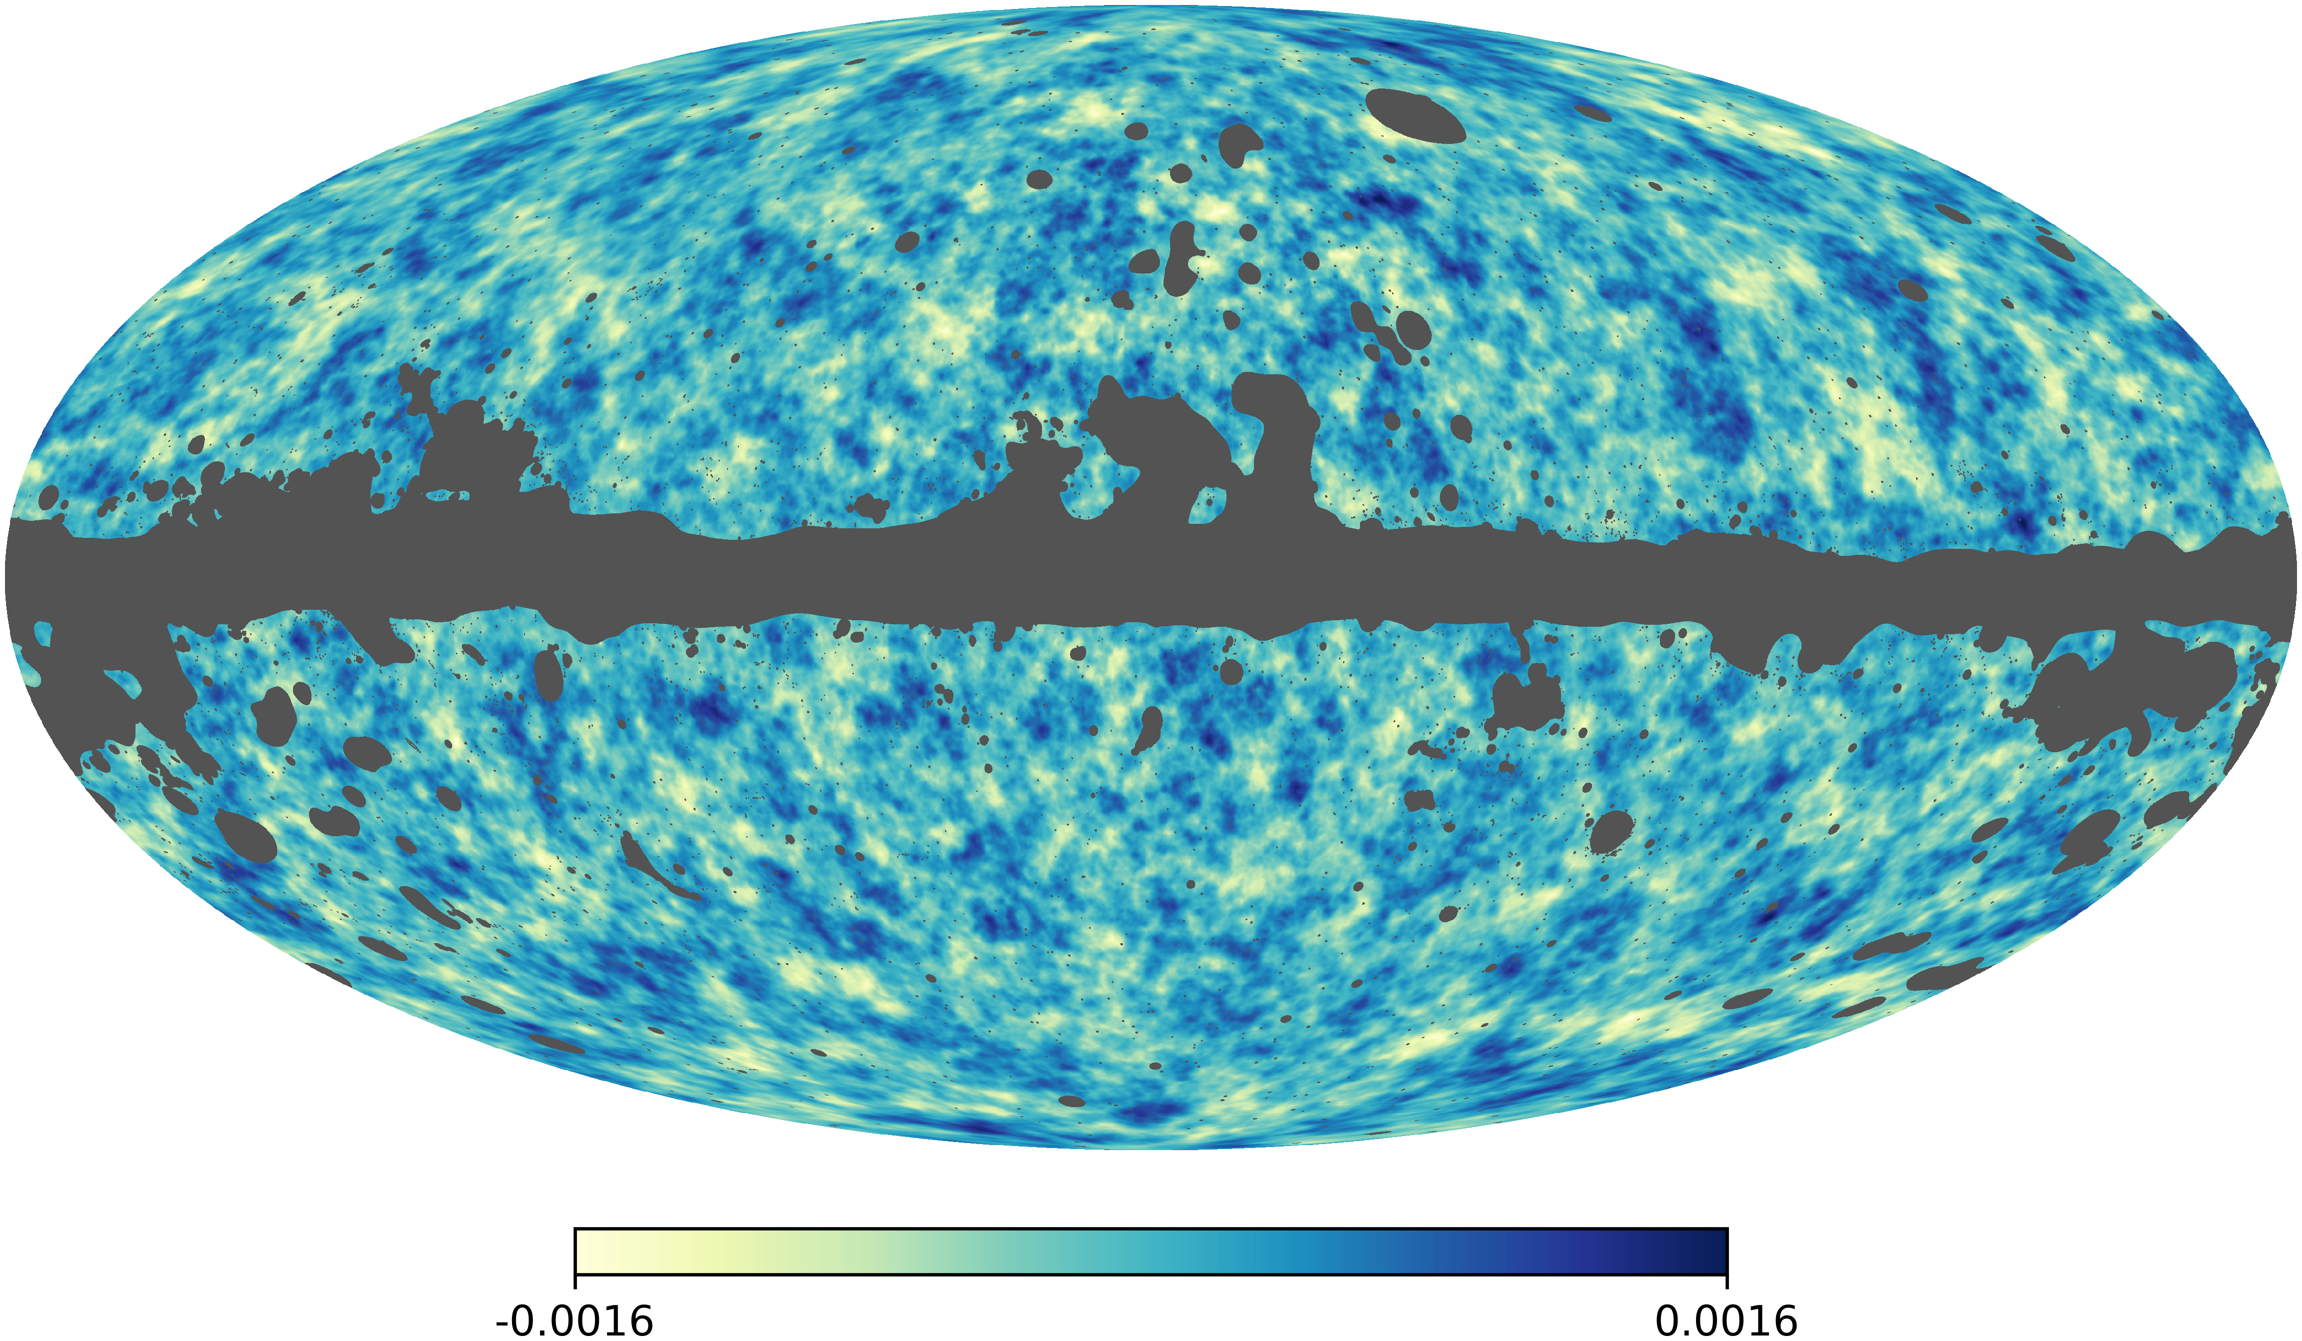
The 2018 Planck map of the temeprature anisotropies of the CMB, extracted using the SMICA method. The gray outline shows the extent of the confidence mask. [July 2018] |
 |
The 2018 Planck map of the polarized CMB anisotropies, shown as rods whose direction and length represent the direction and amplitude of polarized CMB. The colored background is the map of intensity anisotropies, smoothed to 5 degrees. [July 2018] |
 |
The 2018 Planck lensing map derived from the E-model lensing deflection angles. [July 2018] |
 |
The Planck 2018 angular power spectra of the CMB (TT, TE, EE), and of the lensing potential (bottom right). The blue line is a best-fit model to temperature and polarization data. [July 2018] |
 |
Planck 2018 constraints on the tensor-to-scalar ratio r0.002 in the ΛCDM model, using Planck TT,TE,EE+lowE and Planck TT,TE,EE+lowE+lensing (red and green respectively), and joint constraint with BAO and 2014 BICEP2/Keck (blue). [July 2018] |
 |
Marginalized joint 68% and 95% CL regions for ns and r at k = 0.002 Mpc−1 from 2018 Planck data alone and in combination with BK14 or BK14 plus BAO data compared to the theoretical predictions of selected inflationary models. [July 2018] |
 |
Evolution of CMB constraints on parameters describing “early Universe physics,” specifically the amount of primordial, local non-Gaussianity (fNL), the tensor-to-scalar ratio (r), and the slope of the primordial power spectrum (ns). [July 2018] |
 |
Evolution of CMB constraints on parameters describing “late time physics,” specifically the matter density (ωm ≡ Ωmh2), the baryon density (ωb ≡ Ωbh2), the acoustic scale (θ∗), the normalization of the (linear theory) matter power spectrum (σ8), the dimensionless Hubble constant (h), and the Thomson optical depth (τ). [July 2018] |
 |
The (linear theory) matter power spectrum (at z = 0) inferred from different cosmological probes. [July 2018] |
|
A compilation of recent CMB angular power spectrum measurements from which cosmological inferences are drawn. [July 2018] |
|
 |
Planck 2018 Commander-based polarized synchrotron amplitude map at 40′ FWHM resolution, evaluated at a mono-chromatic reference frequency of 30 GHz. [July 2018] |
 |
Planck 2018 Commander-based polarized thermal dust amplitude map at 5′ FWHM resolution, evaluated at a mono-chromatic reference frequency of 353 GHz. [July 2018] |
 |
Polarization amplitude rms as a function of frequency and astrophysical components, evaluated on Cmmander components at a smoothing scale of 40′ FWHM. [July 2018] |
Pre-2018 results
|
Figure
|
Short description
|
|---|---|
 |
All-sky maps in Polarization at 30-353 GHz [Dec 2015] |
 |
All-sky maps in Polarization at 30-353 GHz [Dec 2015] |
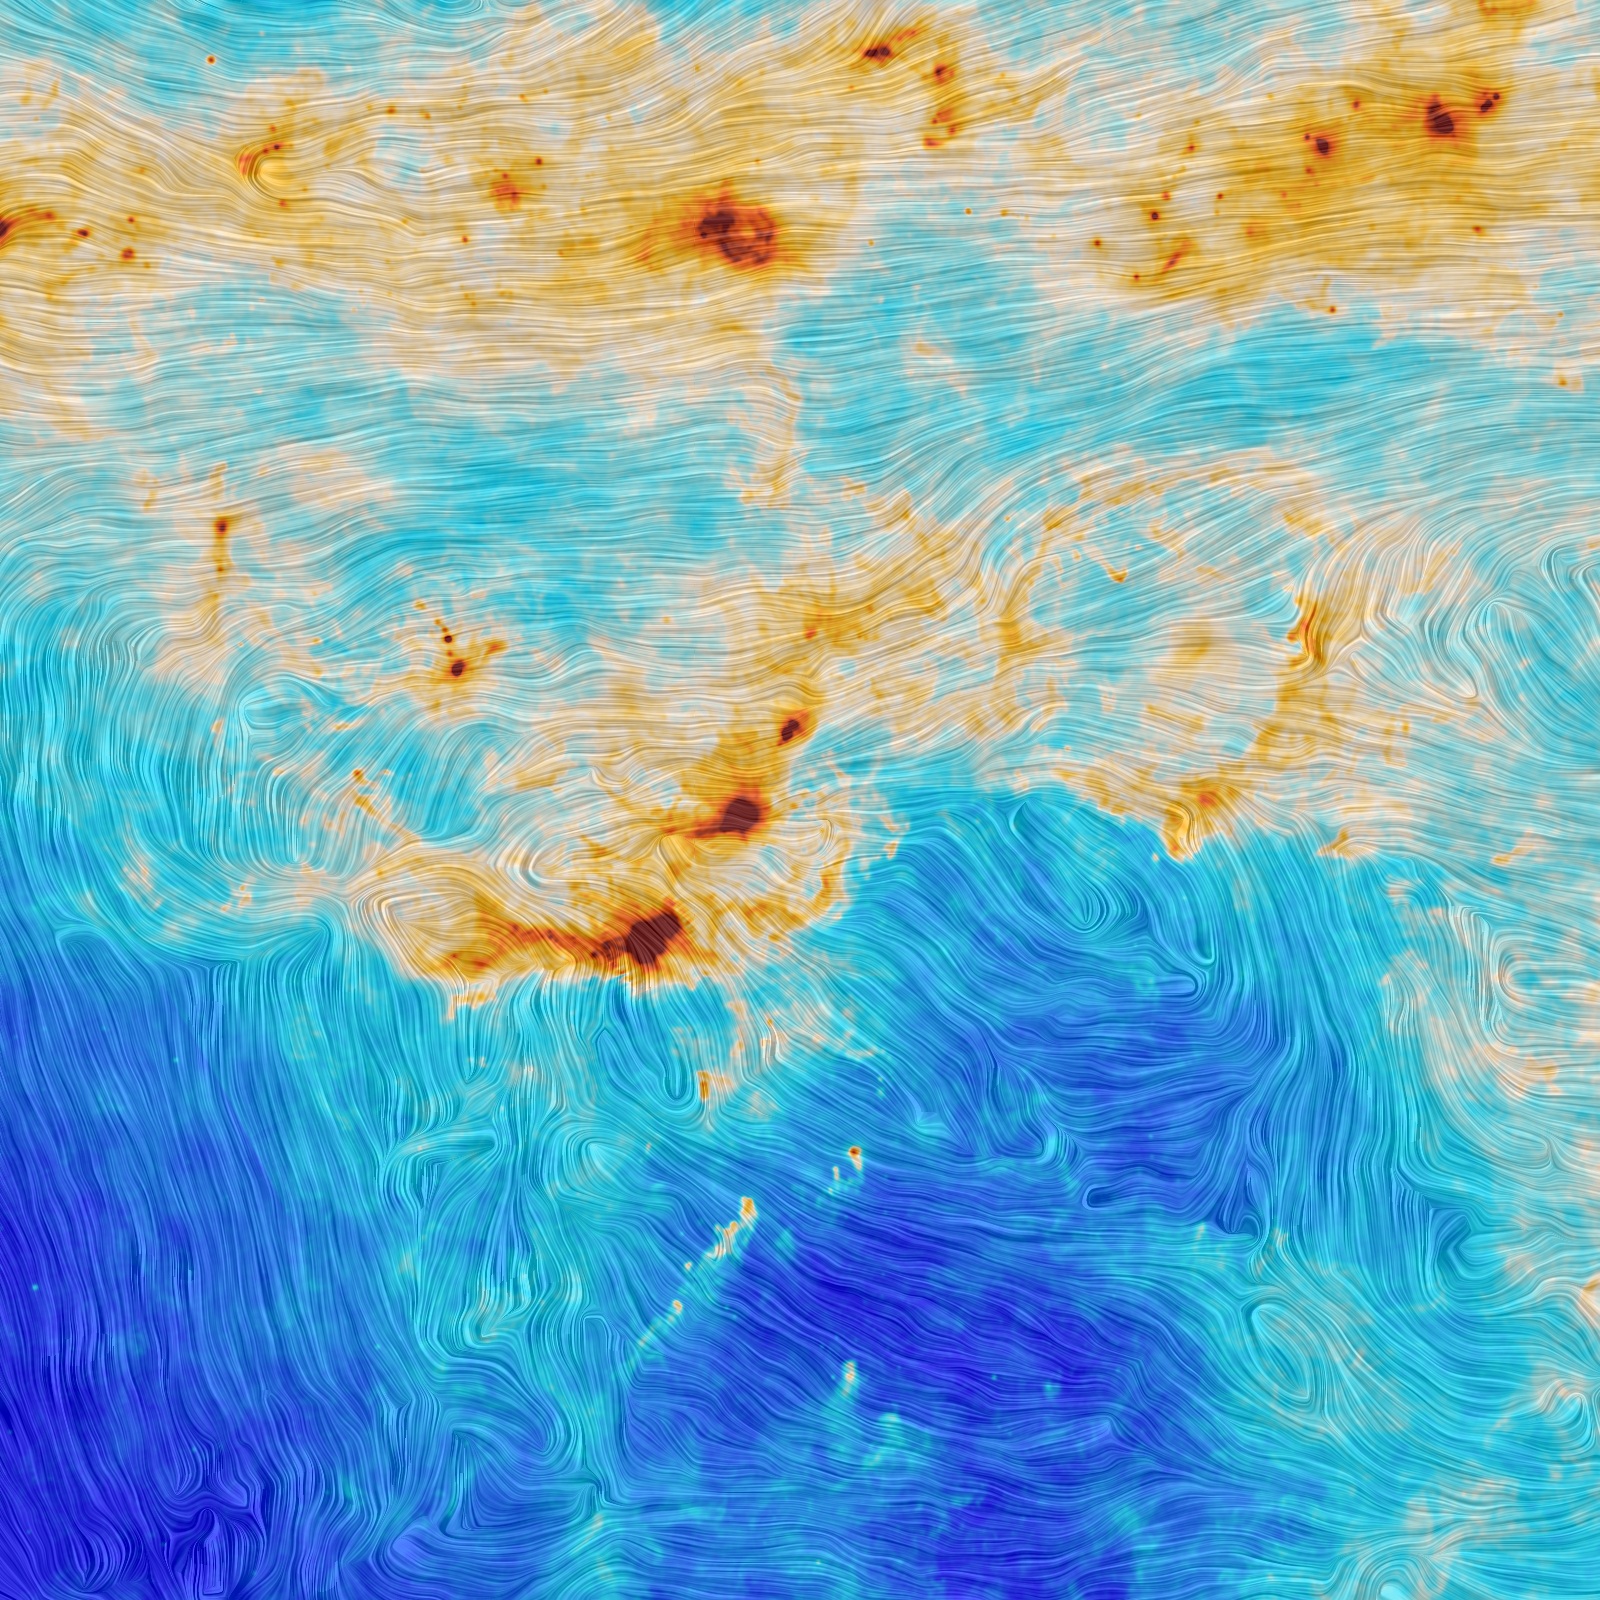 |
Star formation and magnetic turbulence in the Orion molecular cloud [May 2015] |
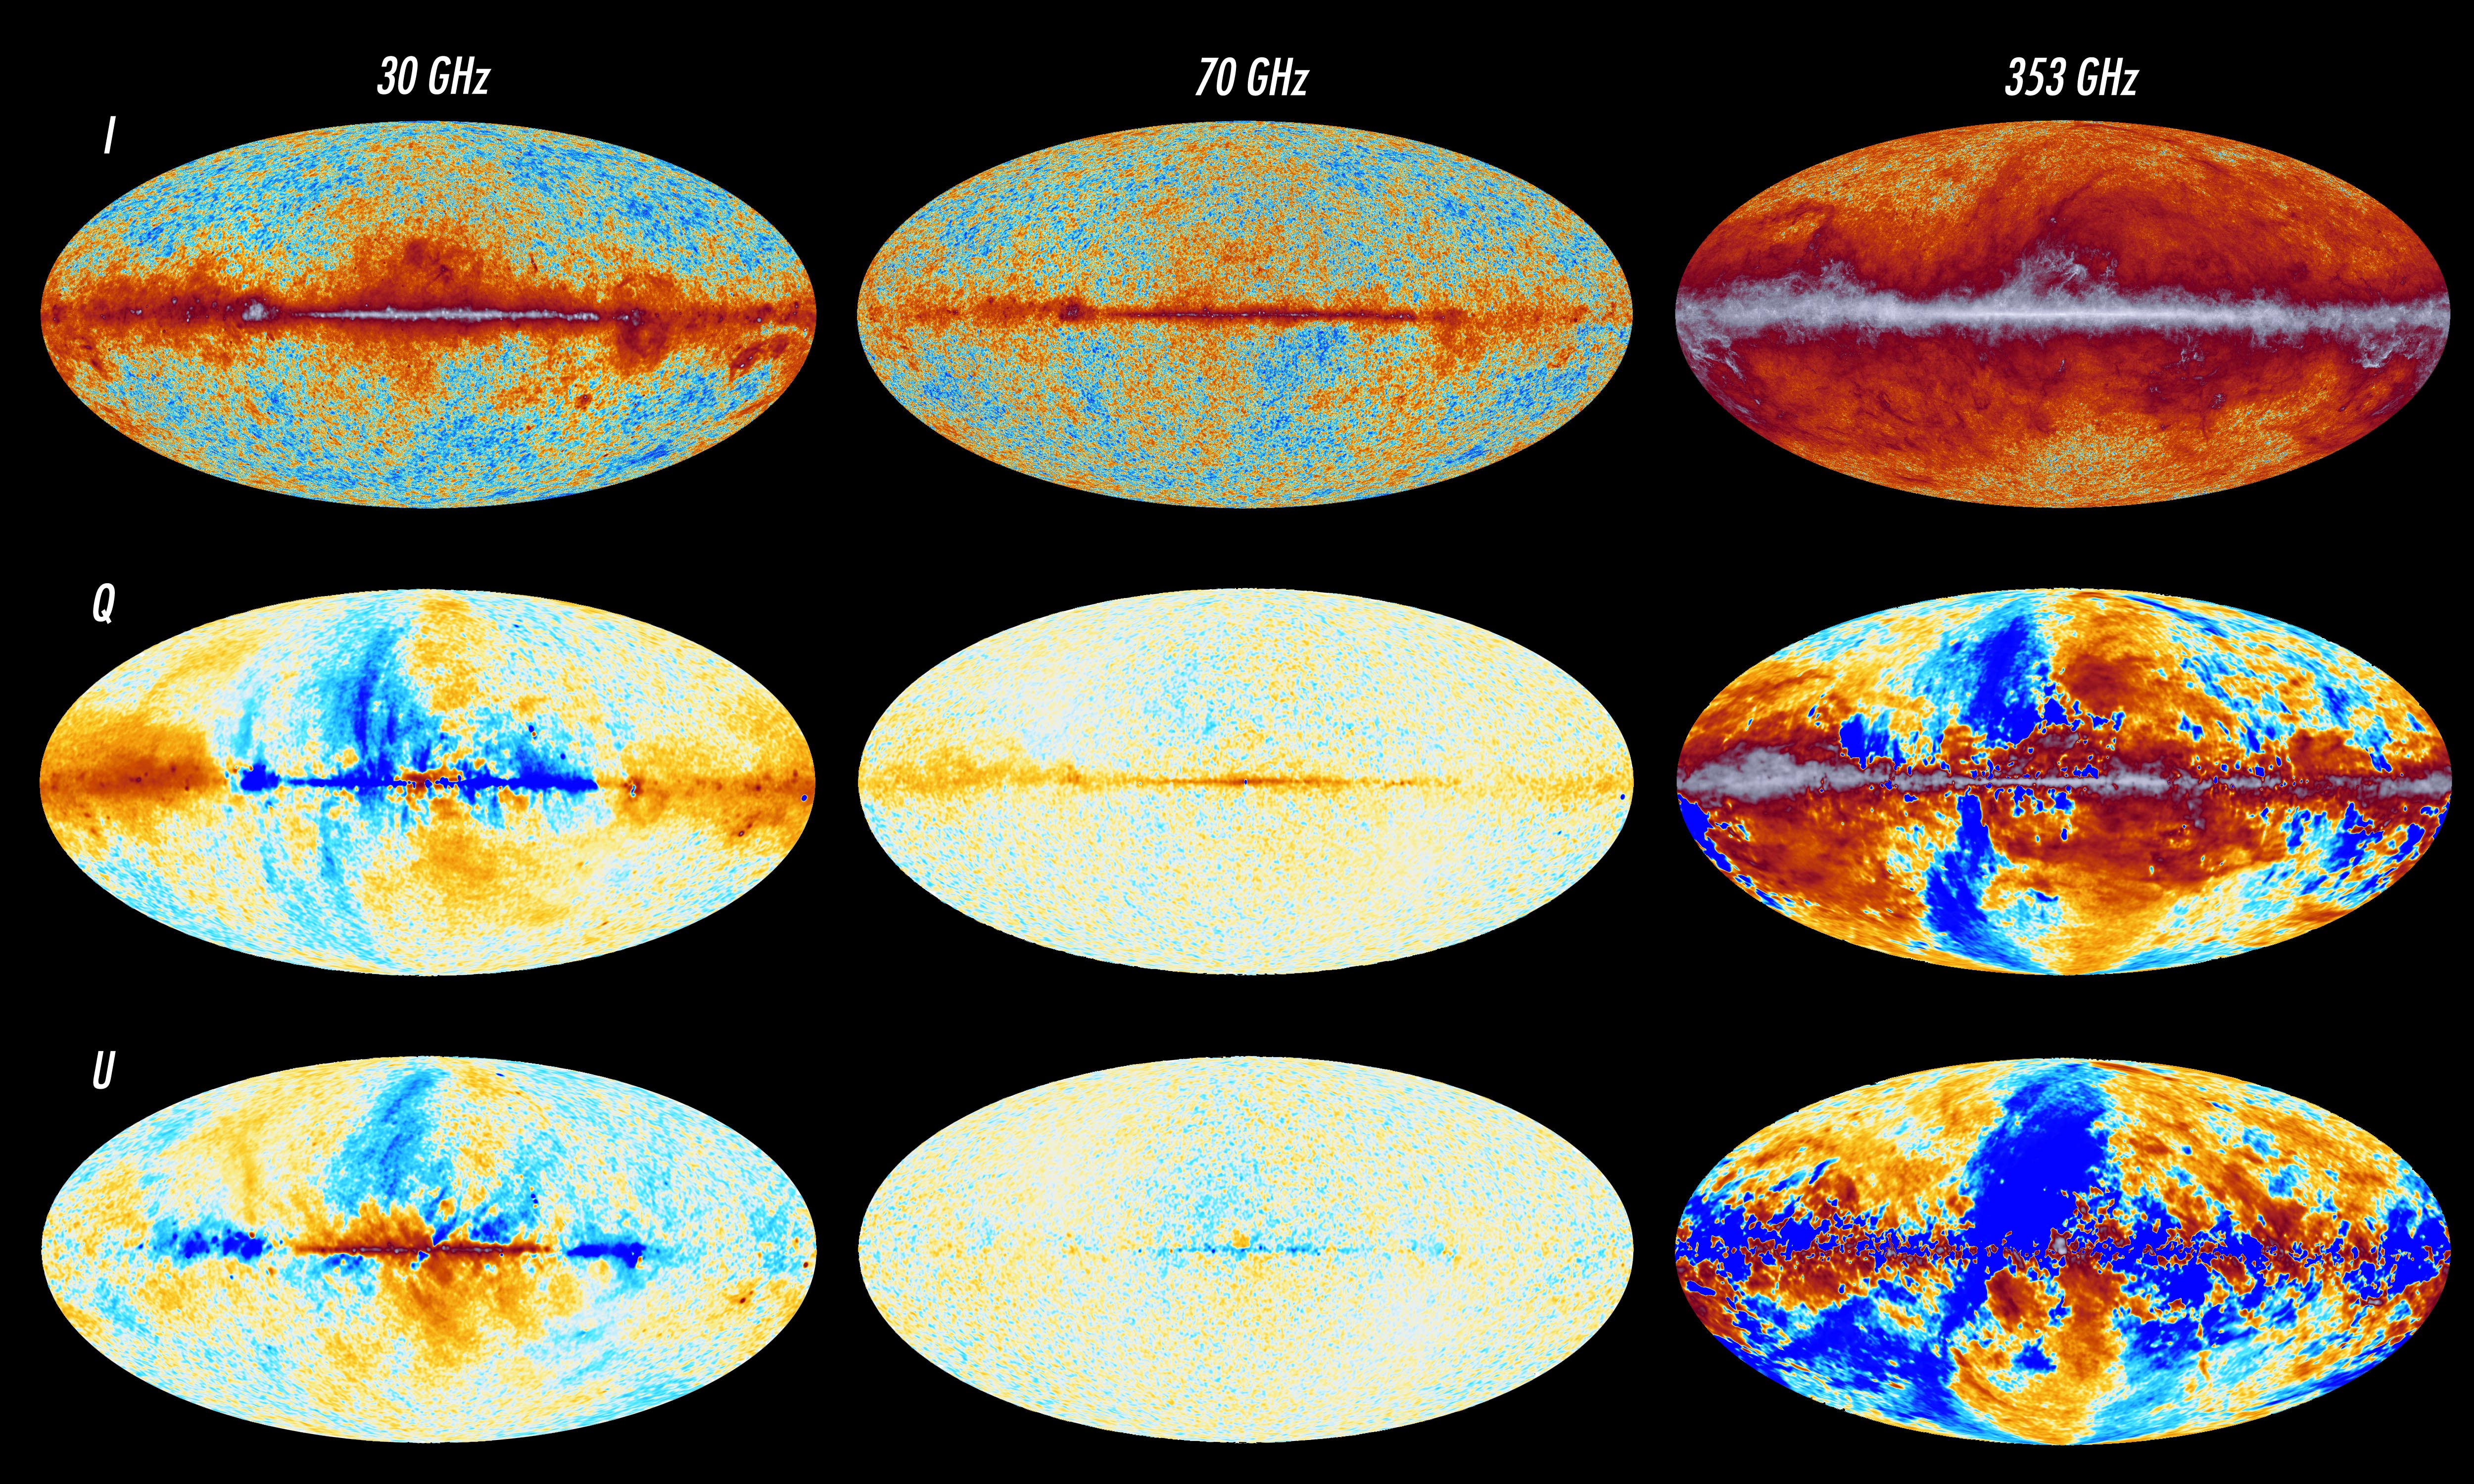 |
All-sky maps in Polarization at 30, 70 and 353 GHz [April 2015] |
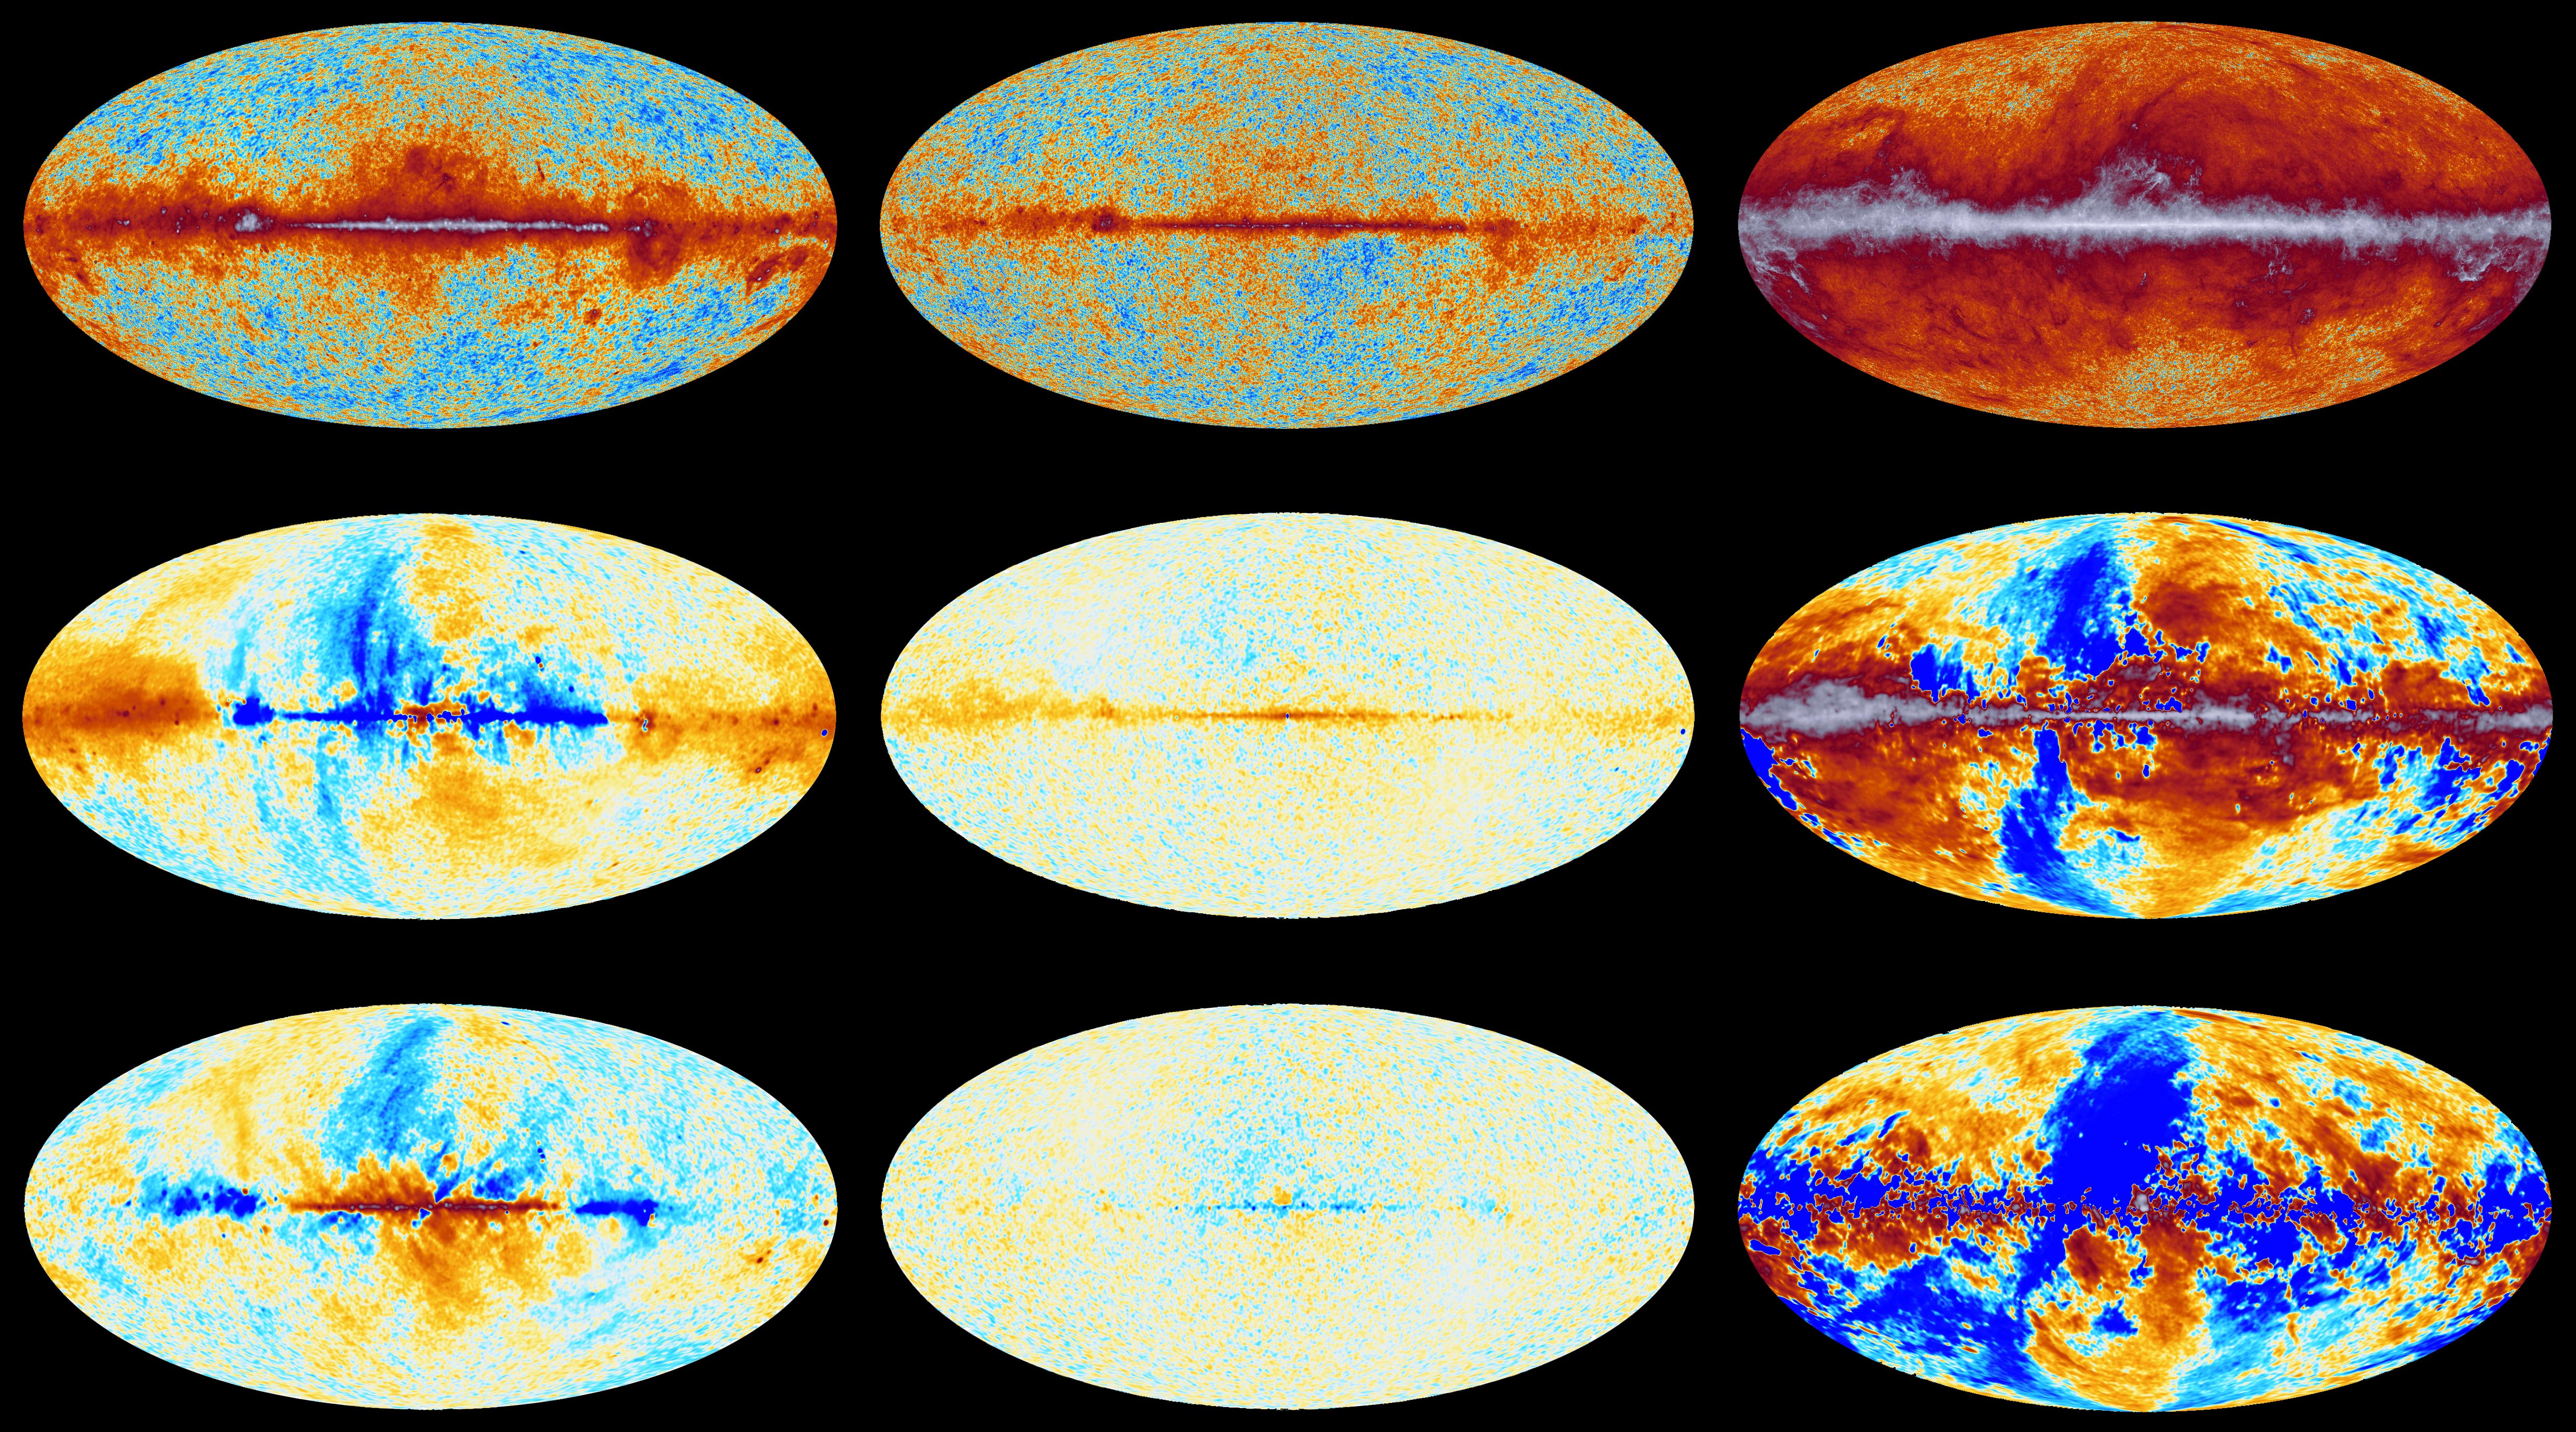 |
All-sky maps in Polarization at 30, 70 and 353 GHz [April 2015] |
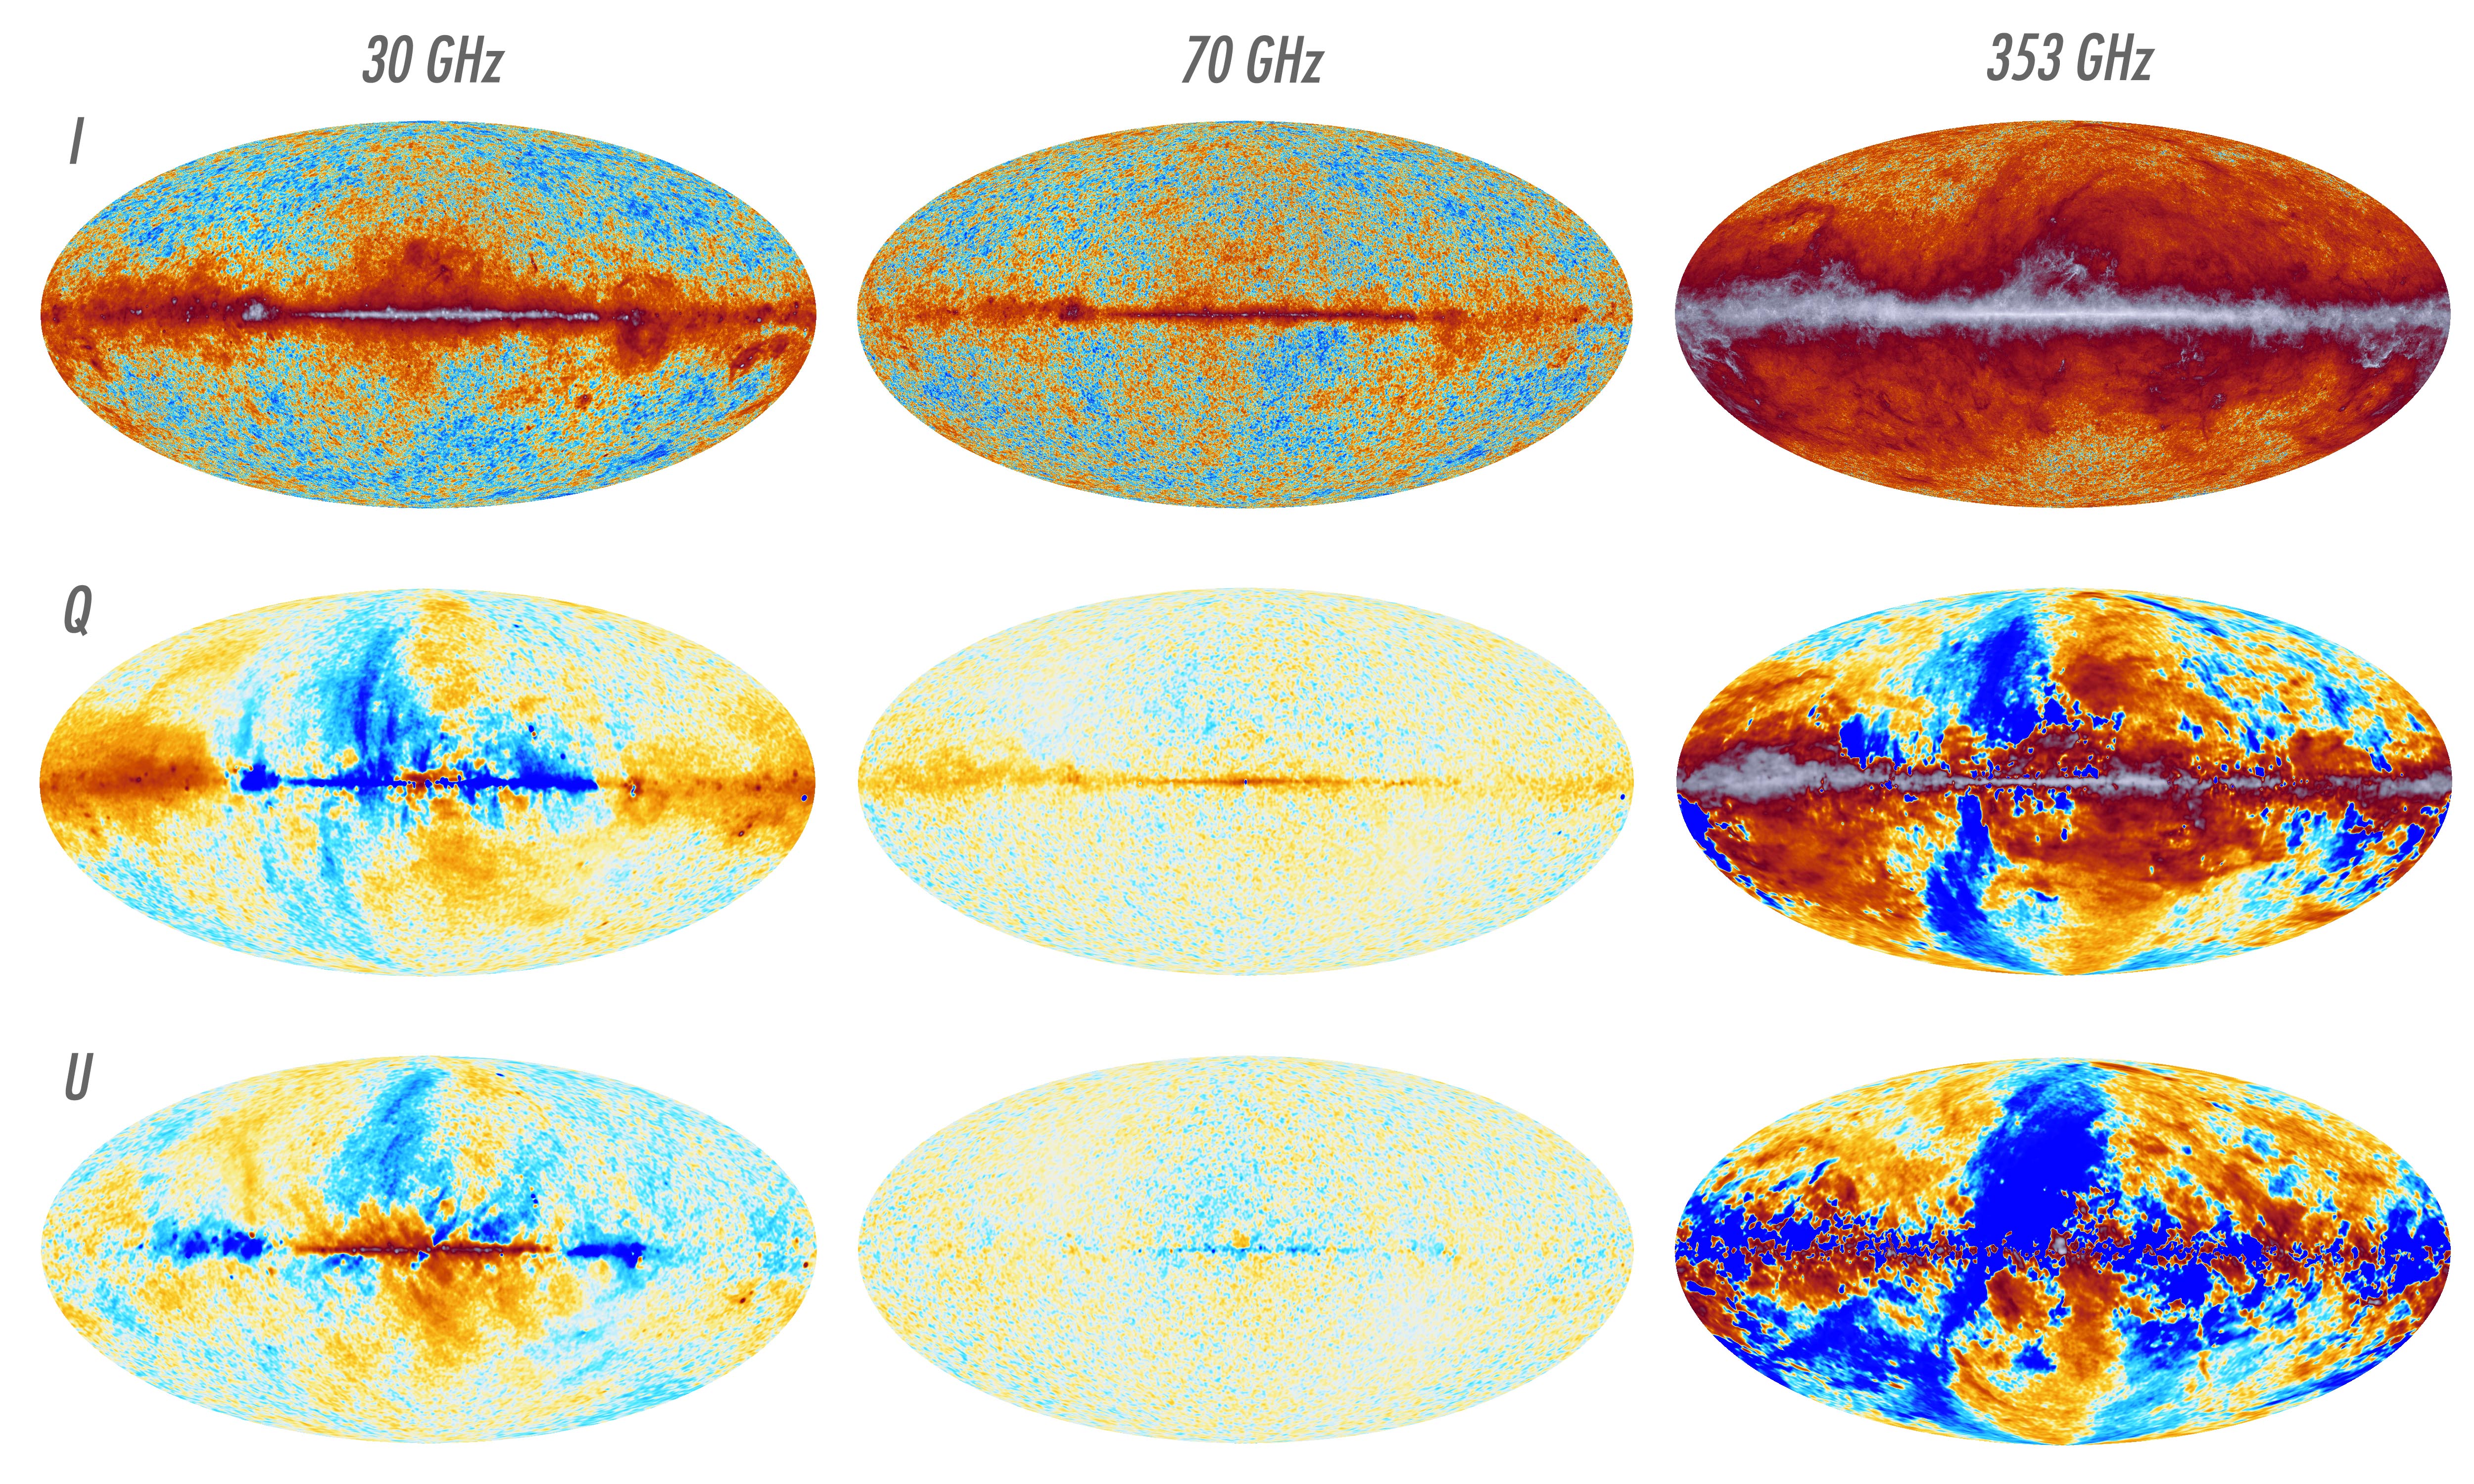 |
All-sky maps in Polarization at 30, 70 and 353 GHz [April 2015] |
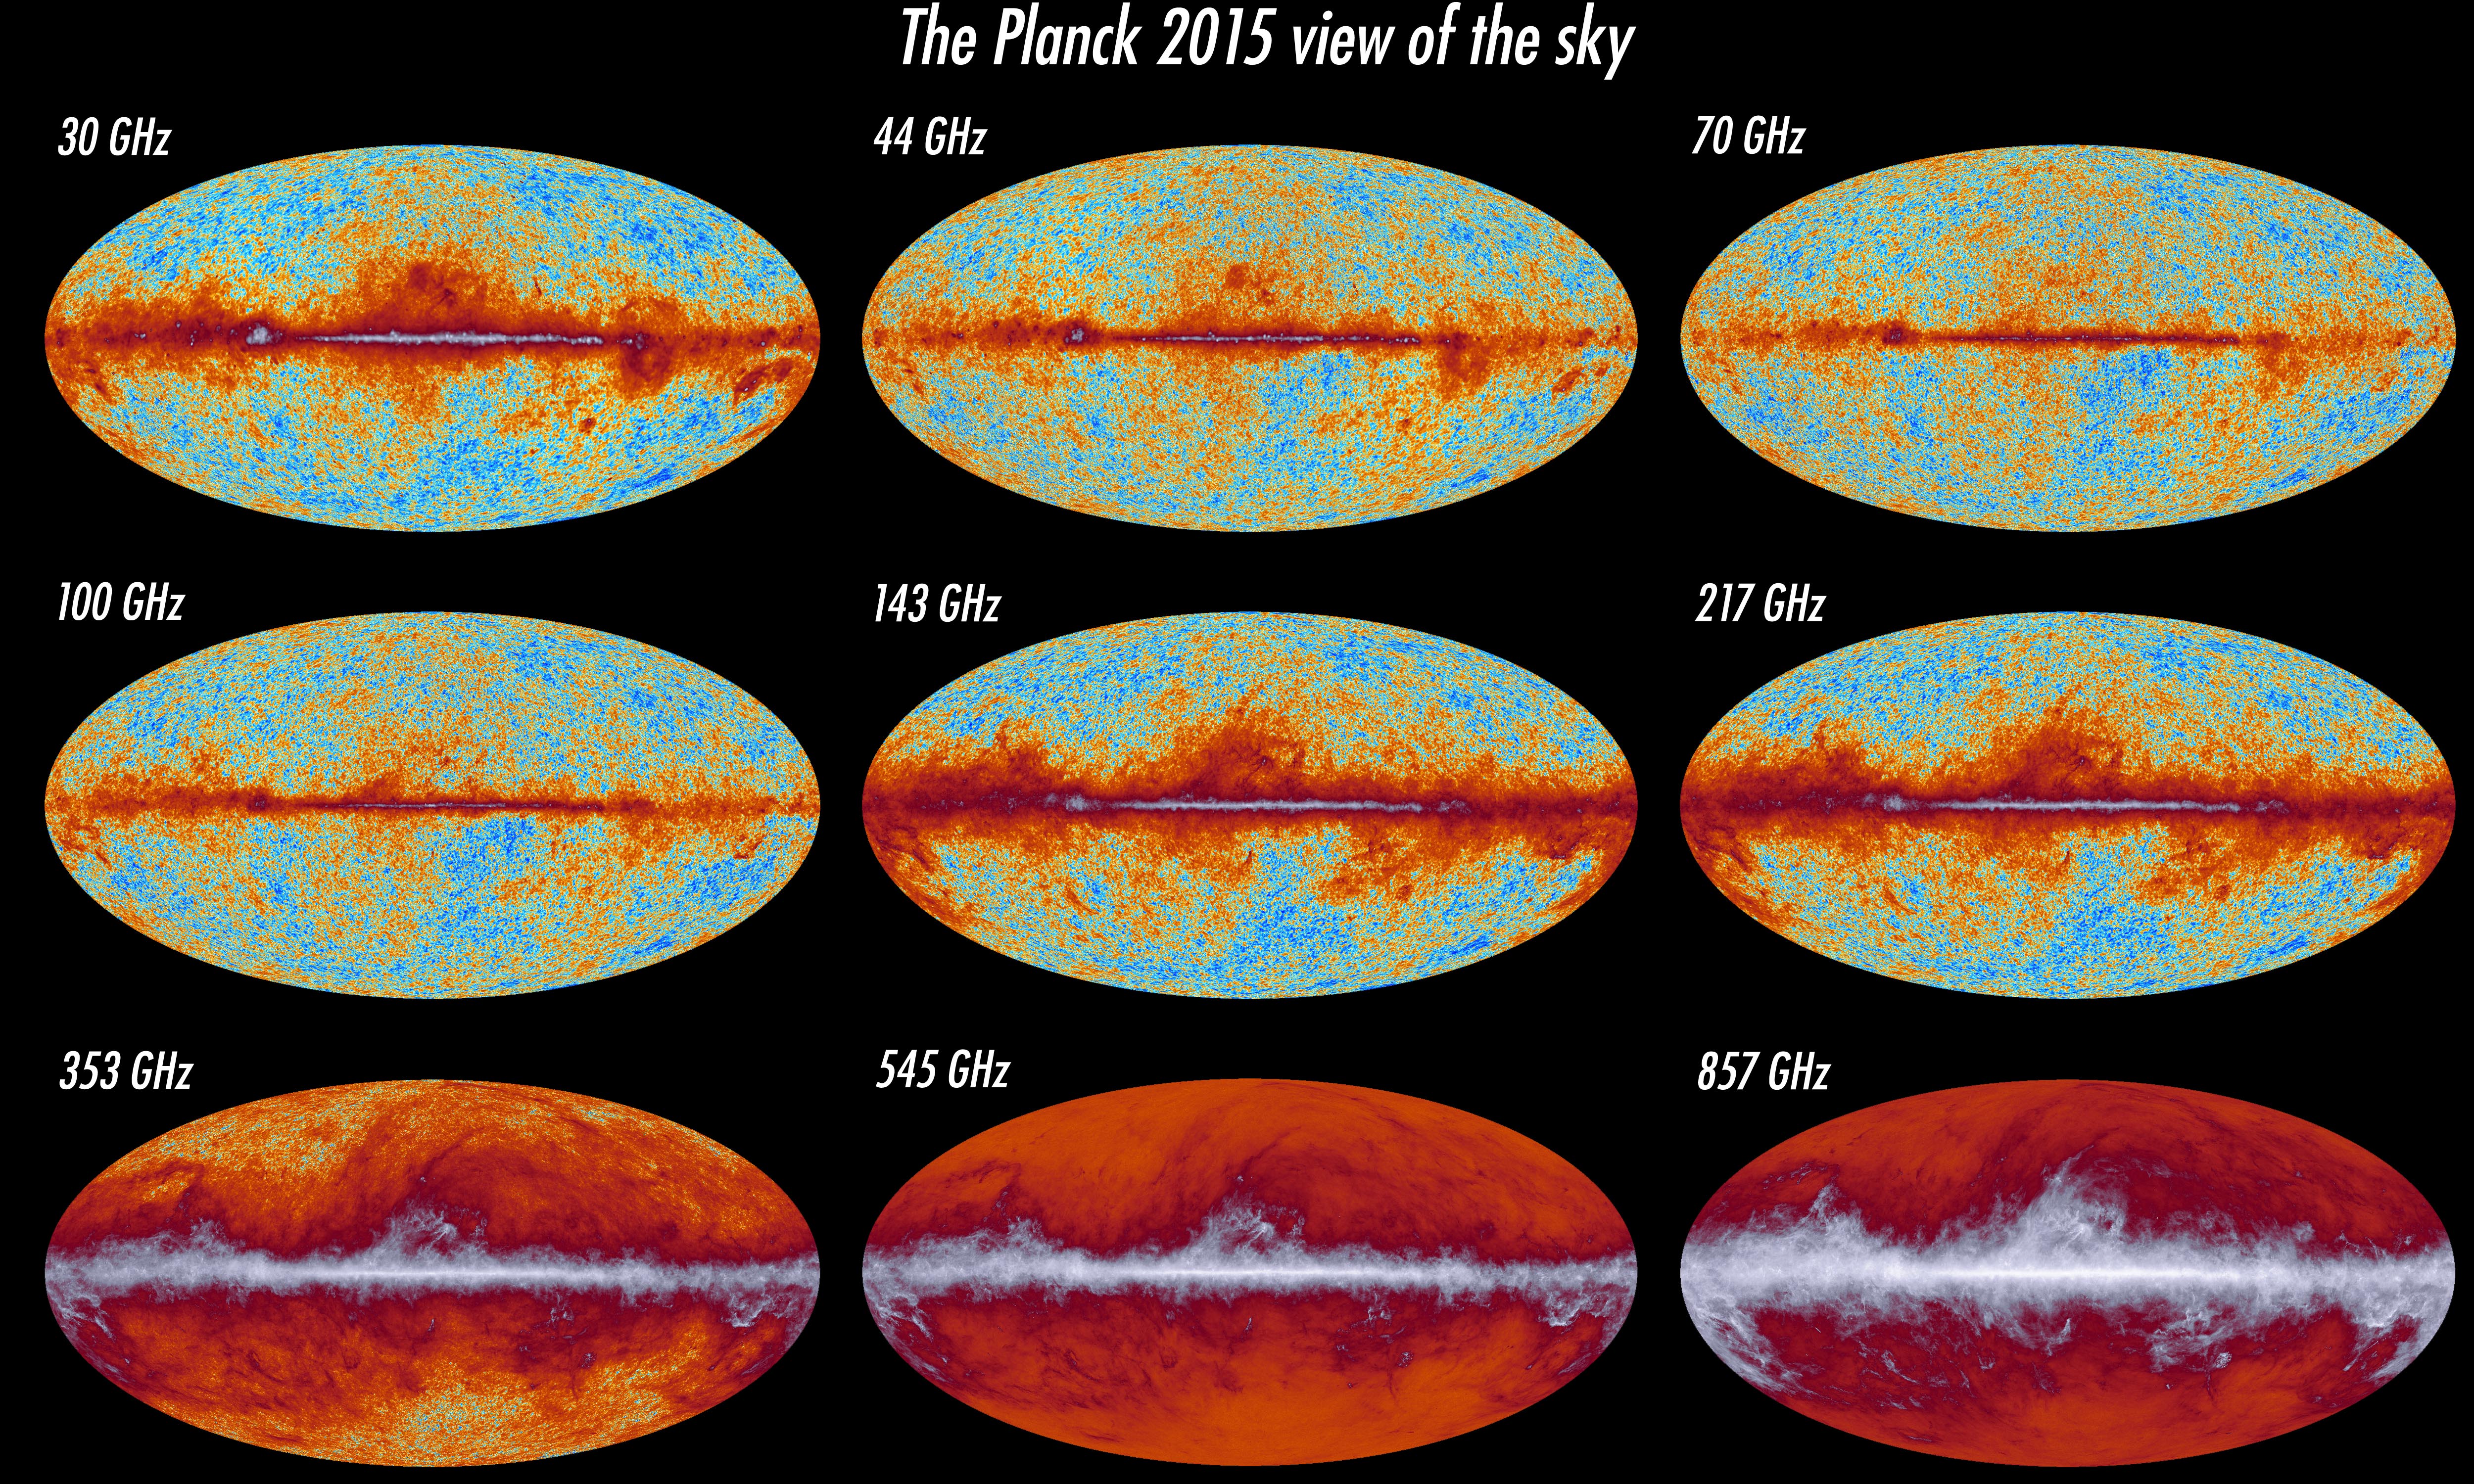 |
2015 All-sky maps at nine frequencies [April 2015] |
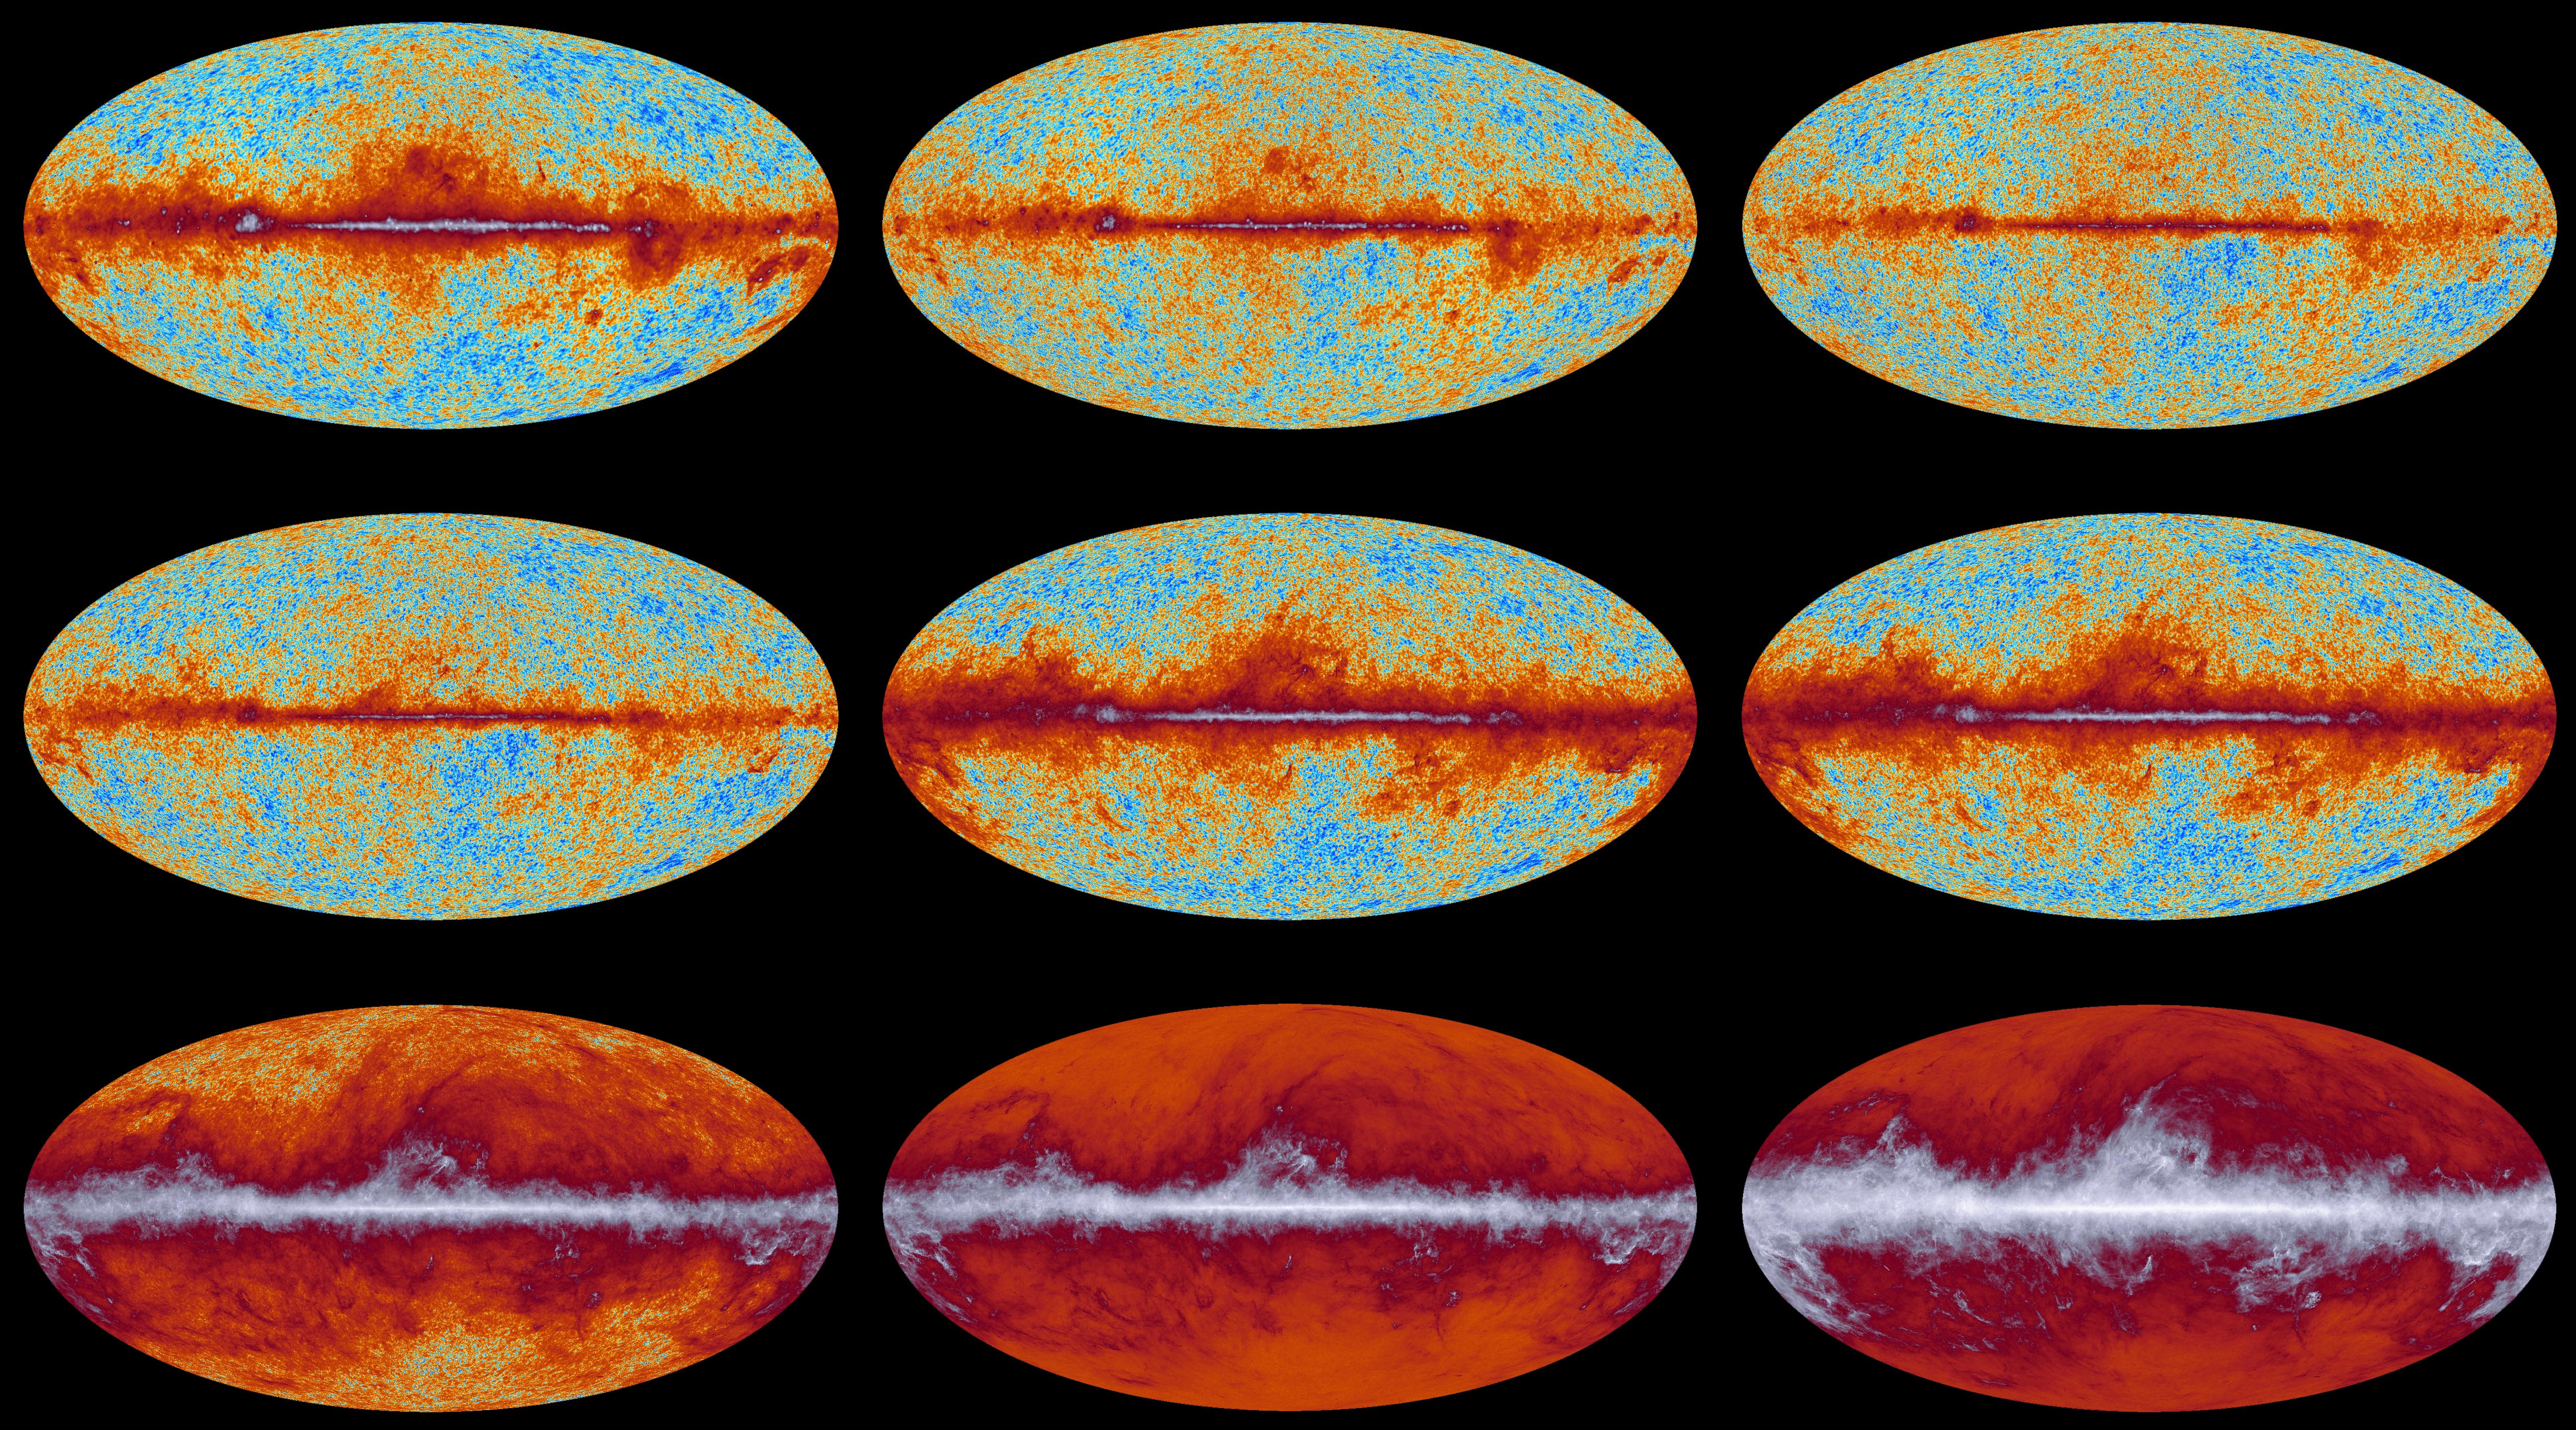 |
2015 All-sky maps at nine frequencies [April 2015] |
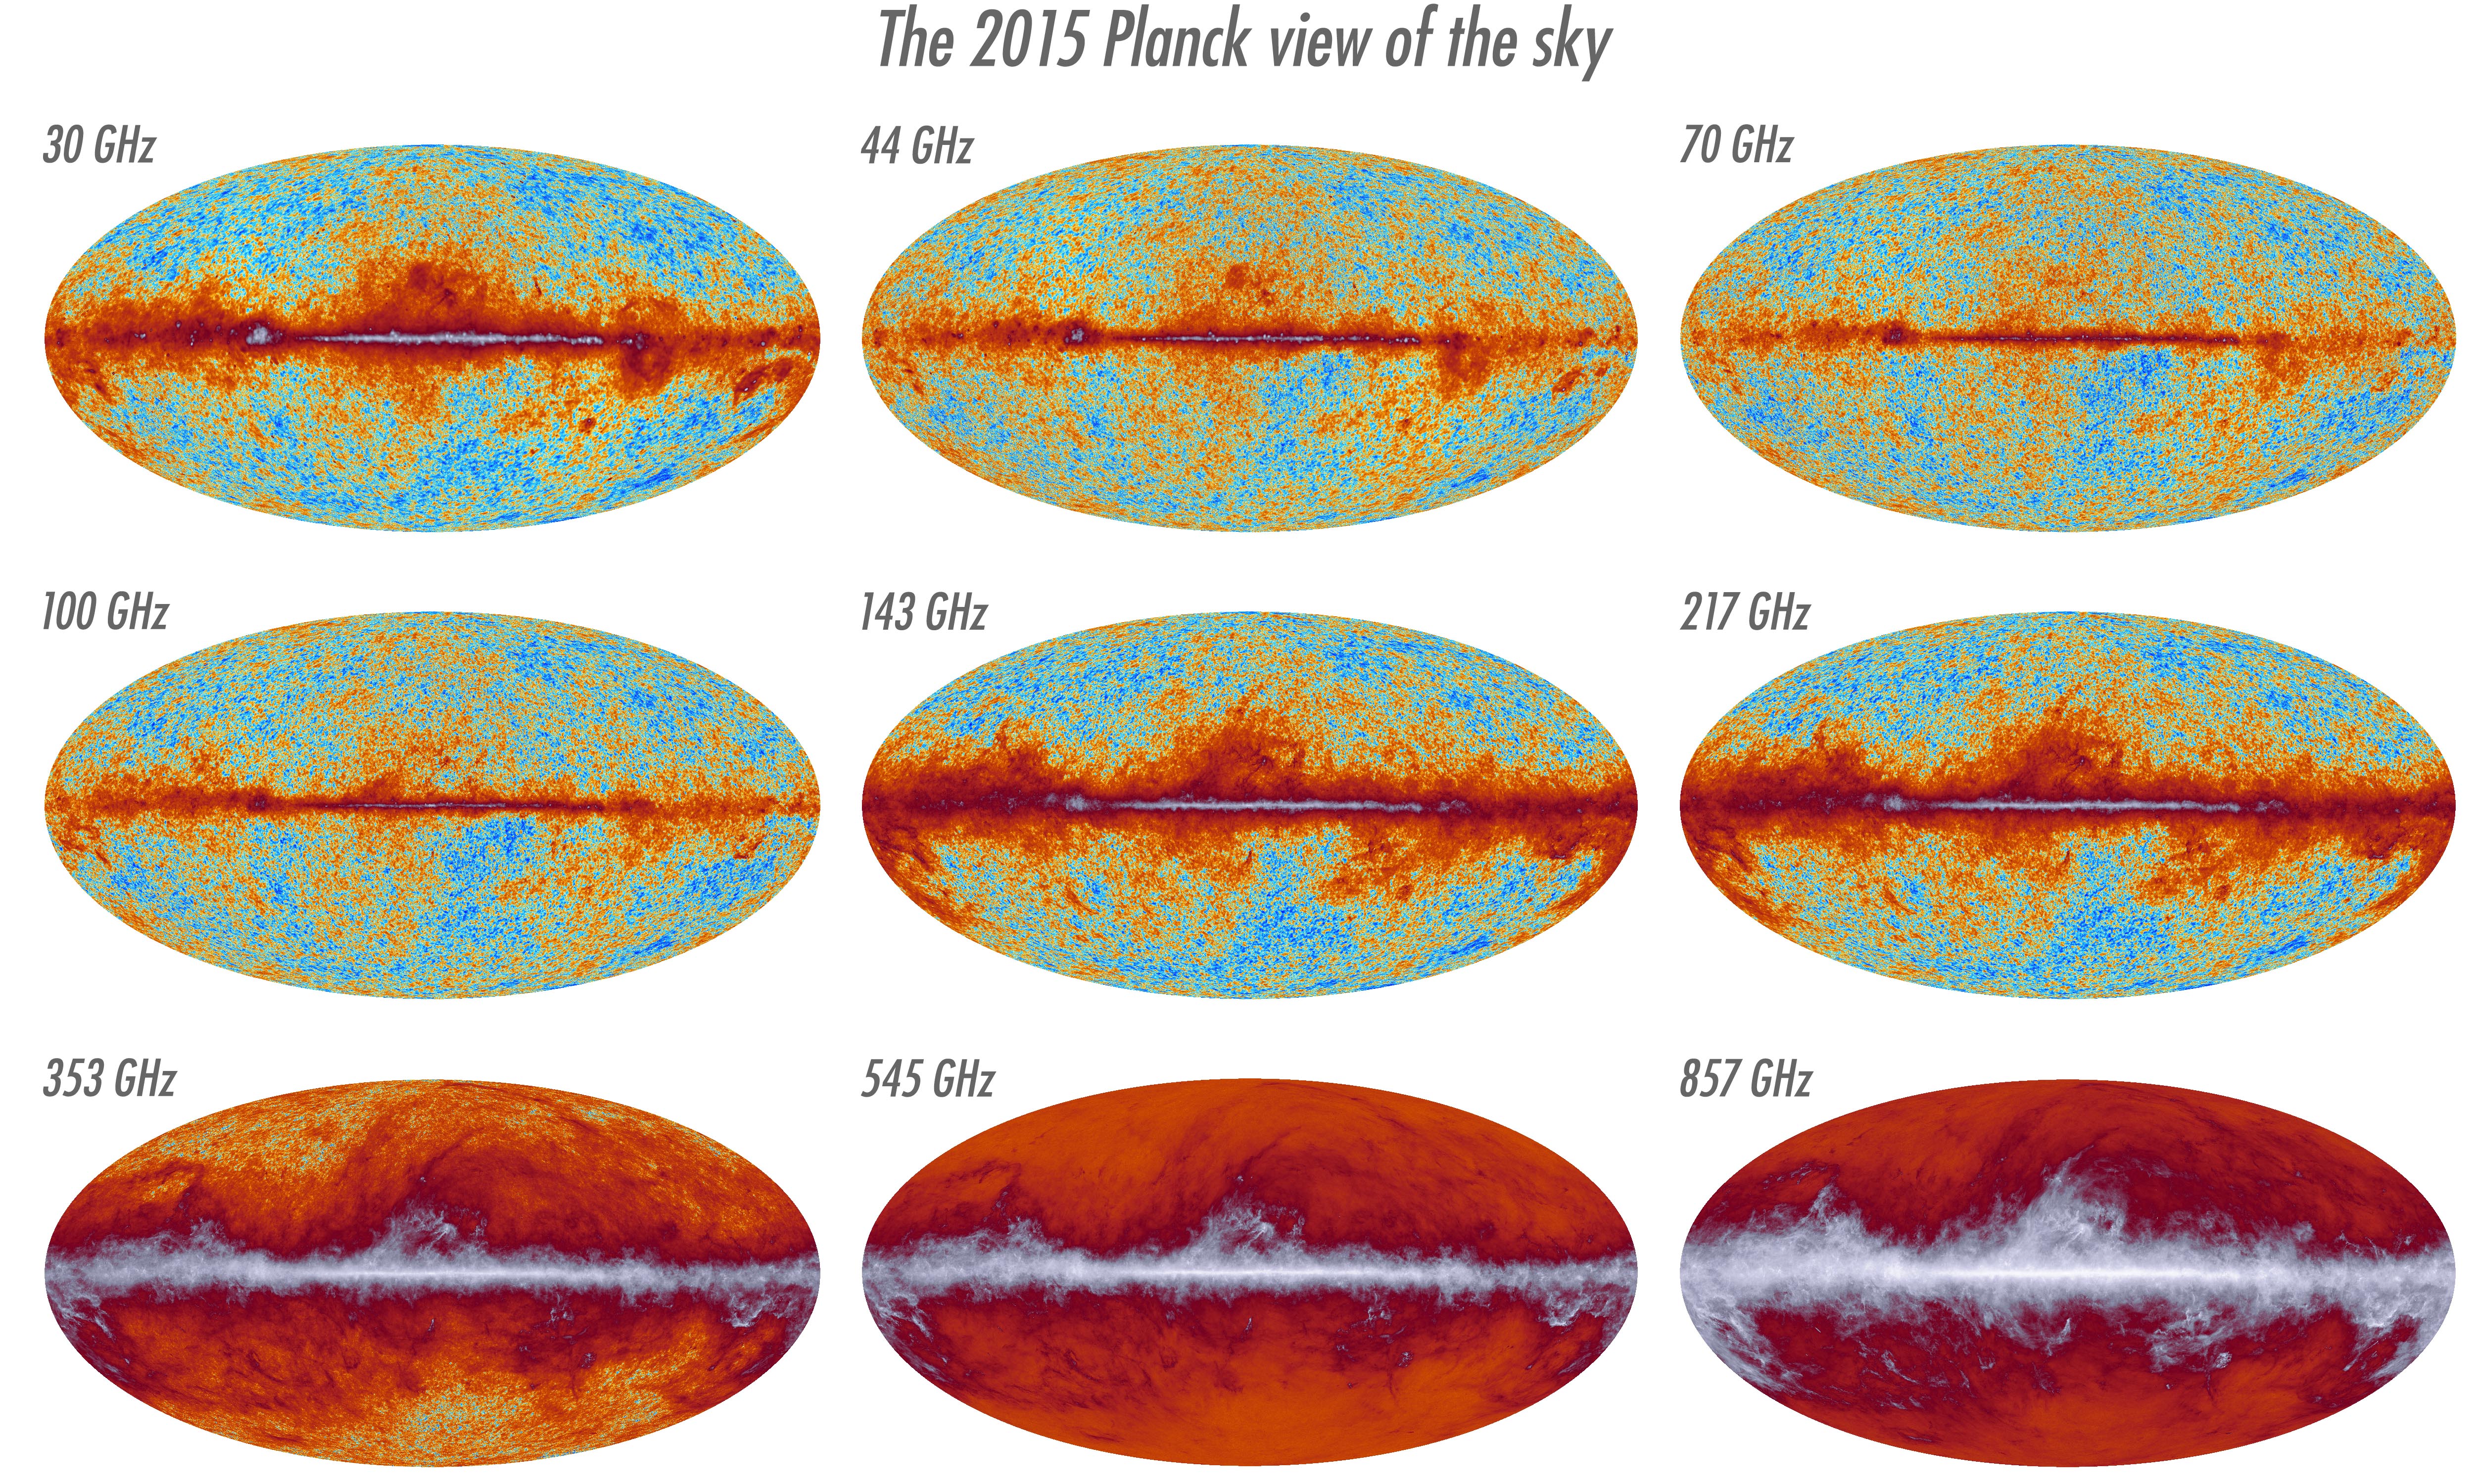 |
2015 All-sky maps at nine frequencies [April 2015] |
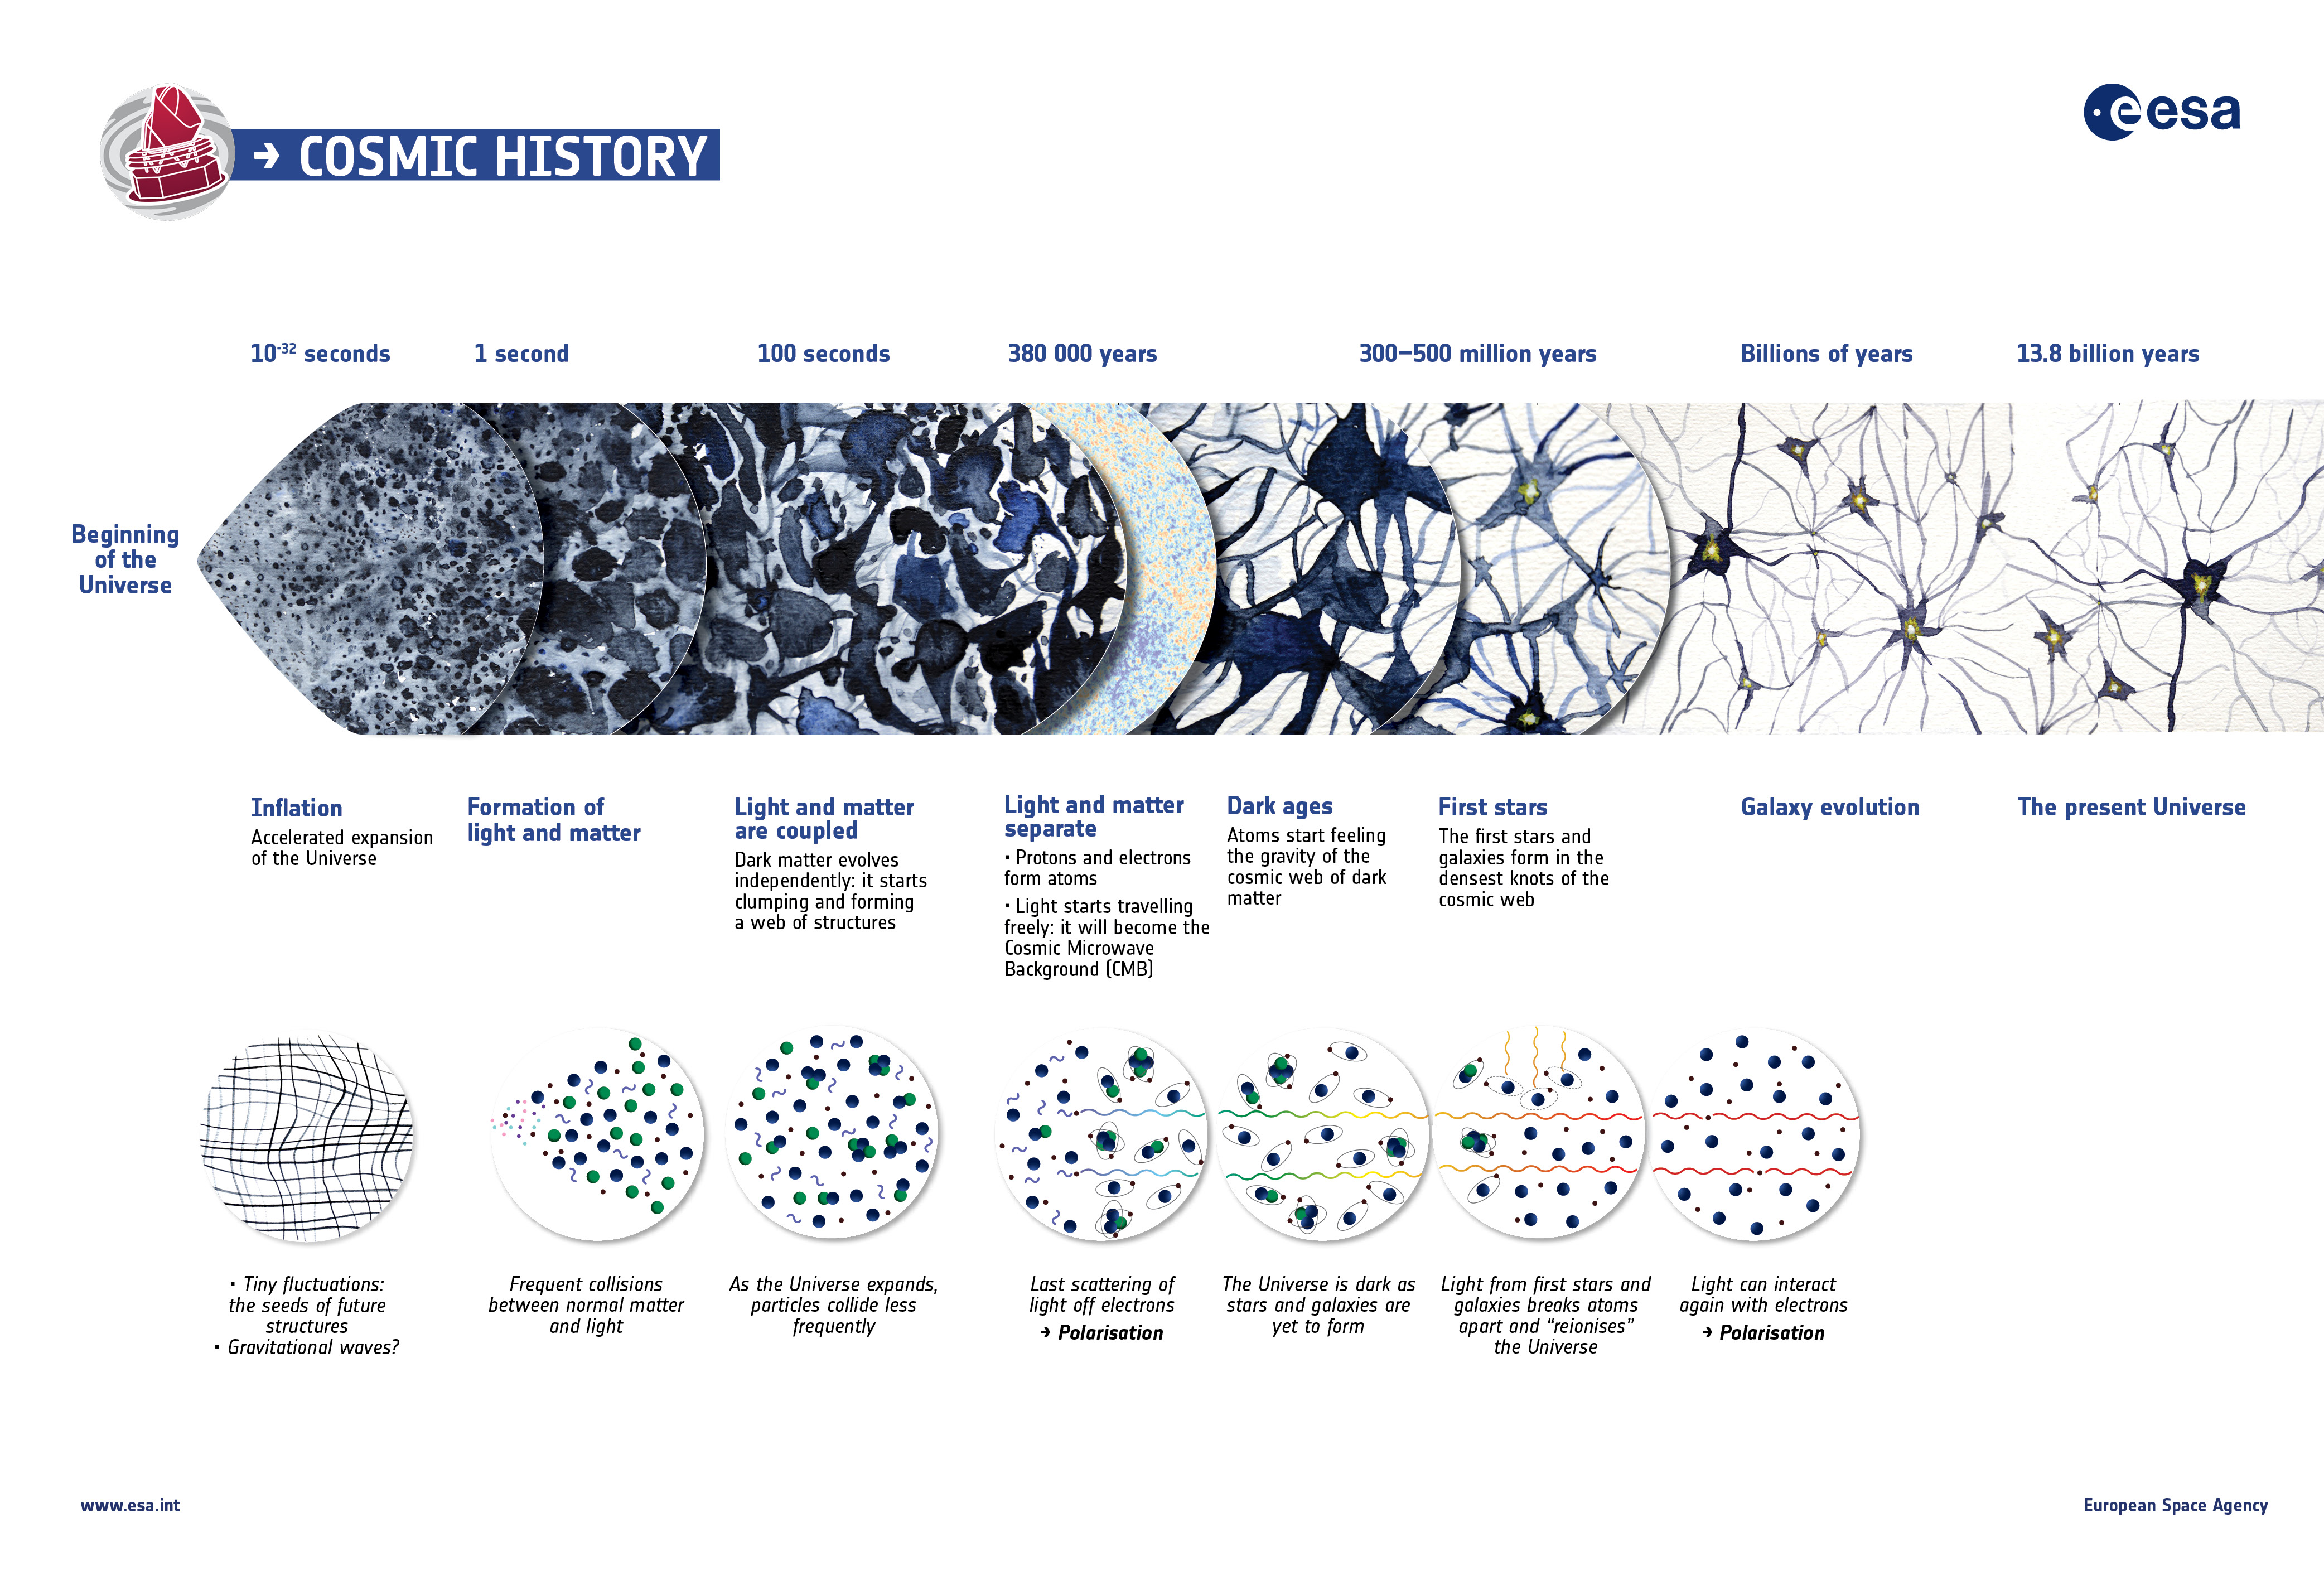 |
The history of the Universe [Feb 2015] |
 |
Map of the Sunyaev-Zeldovich Compton parameter [Feb 2015] |
 |
Lensing Potential map [Feb 2015] |
 |
Temperature Foreground spectra [Feb 2015] |
 |
Composite of Synchrotron, Free-free, Spinning Dust, CO, and Thermal Dust components [Feb 2015] |
 |
Temperature Foreground amplitudes from Commander [Feb 2015] |
 |
Polarized Foreground spectra [Feb 2015] |
 |
Polarized dust emission component [Feb 2015] |
 |
Magnetic field lines traced by dust emission at 353 GHz [Feb 2015] |
 |
Polarized synchrotron radiation component [Feb 2015] |
 |
Magnetic field lines traced by synchrotron radiation at 30 GHz [Feb 2015] |
 |
2015 CMB EE spectrum and best-fit model [Feb 2015] |
 |
2015 CMB TE spectrum and best-fit model [Feb 2015] |
 |
CMB Polarization filtered around 5 degrees, and 20x20 deg zoom filtered at 20 arcmin [Feb 2015] |
 |
CMB Polarization filtered around 5 degrees [Feb 2015] |
 |
2015 CMB TT spectrum and best-fit model [Feb 2015] |
|
Map of CMB temperature from SMICA [Feb 2015] |
|
 |
|
 |
|
 |
|
 |
|
 |
|
 |
|
 |
- Removed a total of (62) style text-align:center;
- Removed a total of (14) style font-style:italic;
- Removed a total of (2) border attribute.
- Converted a total of (35) center to div.