
 Sign in
Do they approach us or move away? - Gaia
Do the stars approach us or do they move away?
the Gaia DR3 radial velocities bringing the third velocity component
Using the observed Doppler shift of a star’s spectral lines with respect their wavelengths at rest, astronomers are able to measure the velocity along the direction towards the star, that is, if the star is moving away or towards us. Currently, the largest data set of such line-of-sight velocities is Gaia’s data release 2. Now, with Gaia Data Release 3 this data set is expanded from 7 million to almost 34 million. These line-of-sight velocities are produced by DPAC’s Coordination Unit 6, responsible for spectroscopic processing.
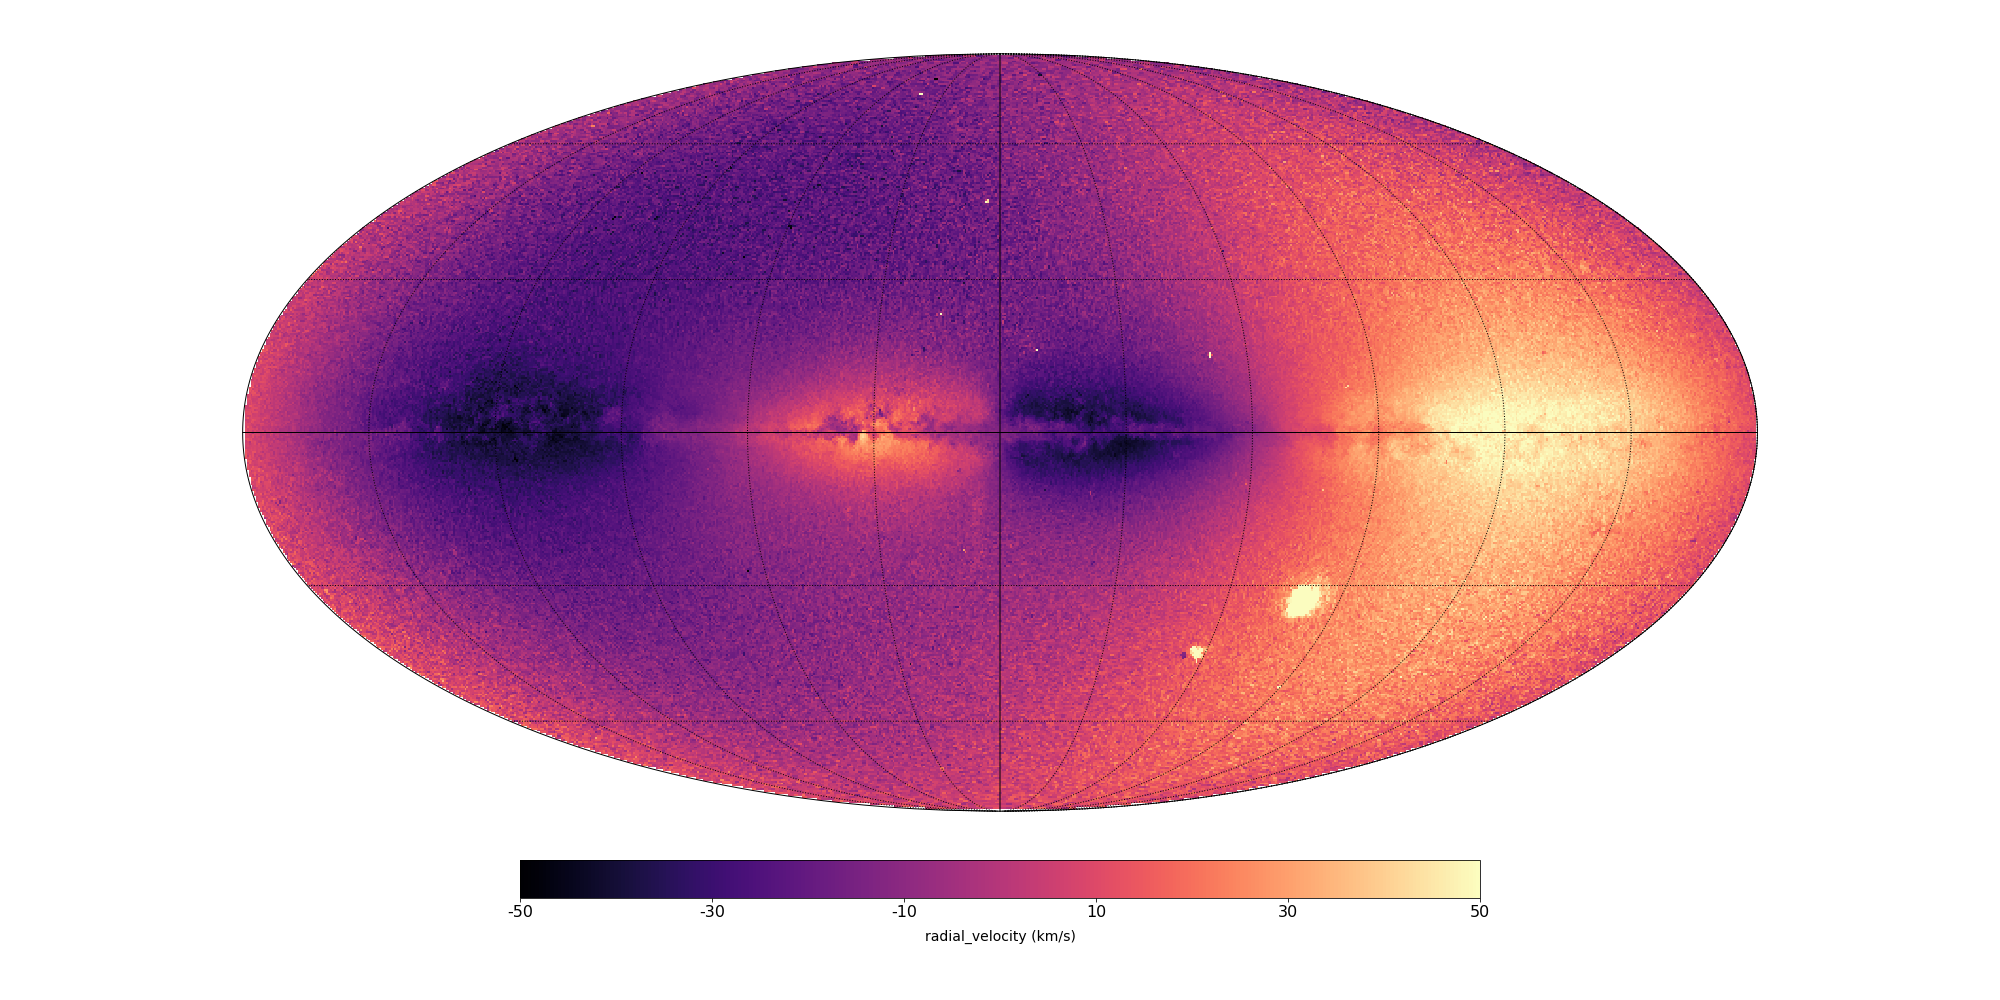
The rotation of the Galactic disk – together with the Sun’s own motion - causes an alternating positive-negative variation in the measured line-of-sight velocities as we look in different directions. Thus mapping these line-of-sight velocities on the sky results in an alternation of bright areas (moving away from us) and dark areas (moving toward us), as shown in the figure below.

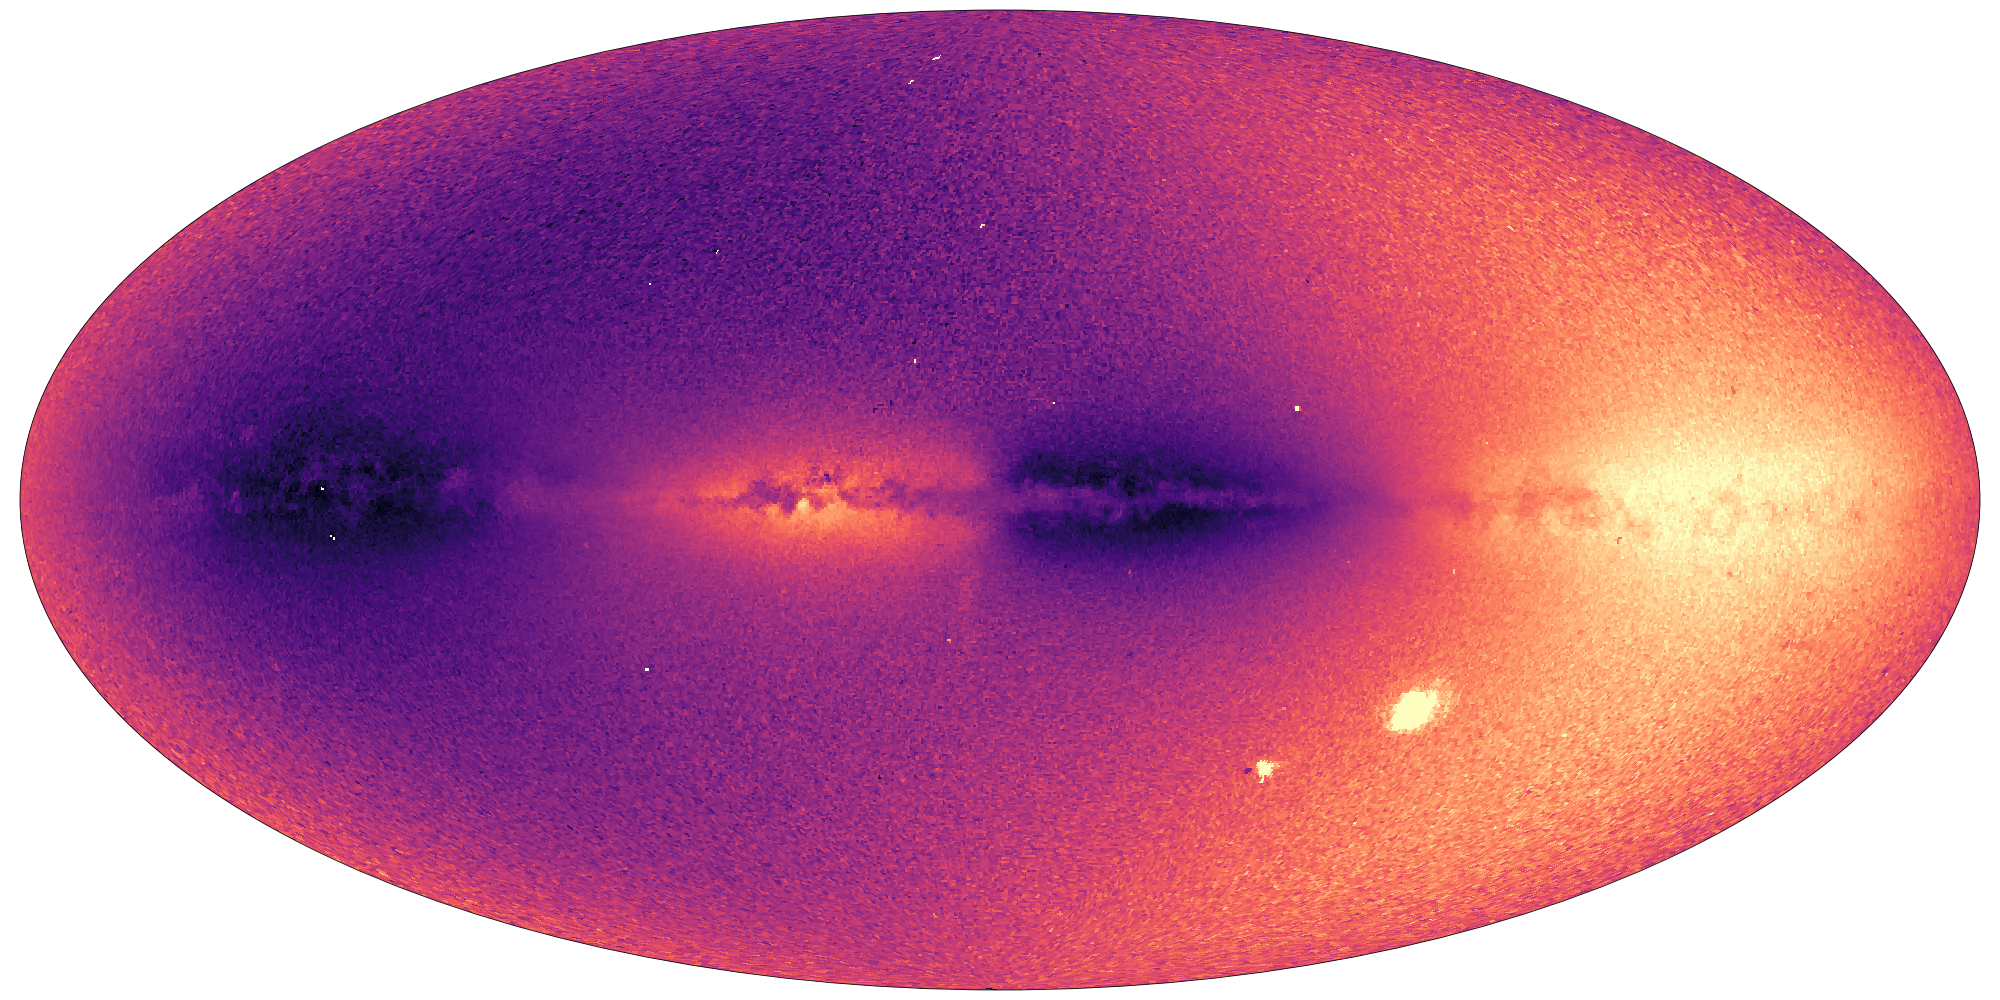
Figure 1: Sky map of the Gaia DR3 radial velocities. Credits ESA/Gaia/DPAC- CC BY-SA 3.0 IGO. Acknowledgements: ESA/Gaia/DPAC/CU6, D. Katz, N. Leclerc, P. Sartoretti and the CU6 team. Download hires version here, without labels here. Compare to the same sky map from Gaia DR2 here.
Several objects whose line-of-sight velocity differs from that of their surroundings (and which are sufficiently populated to weigh on the median value), are visible by contrast. The Large and Small Magellanic Clouds appear as clear bright spots in the lower right part of Figure 1, while the Sagittarius dwarf galaxy, hiding on the other side of the Galaxy, is beautifully visible as a faint almost vertical stripe below the Galactic centre. Several Globular Clusters appear as tiny dots in the image, such as 47 Tuc, the dark dot on the immediate left of the Small Magellanic Cloud, or Omega Cen, a small bright dot above and to the right of the Galactic centre.
The combination of line-of-sight velocities and proper motions, both products available in Gaia’s data release 3, is especially powerful. Proper motions are the motions of stars across the sky, while the line-of-sight velocities provide the final velocity component. Their combination gives the full velocity vector for about 33 million stars, an amazing data set for studies on the kinematics of our Milky Way. It is the first time that the velocity of stars is fully mapped in all directions over such a large volume.
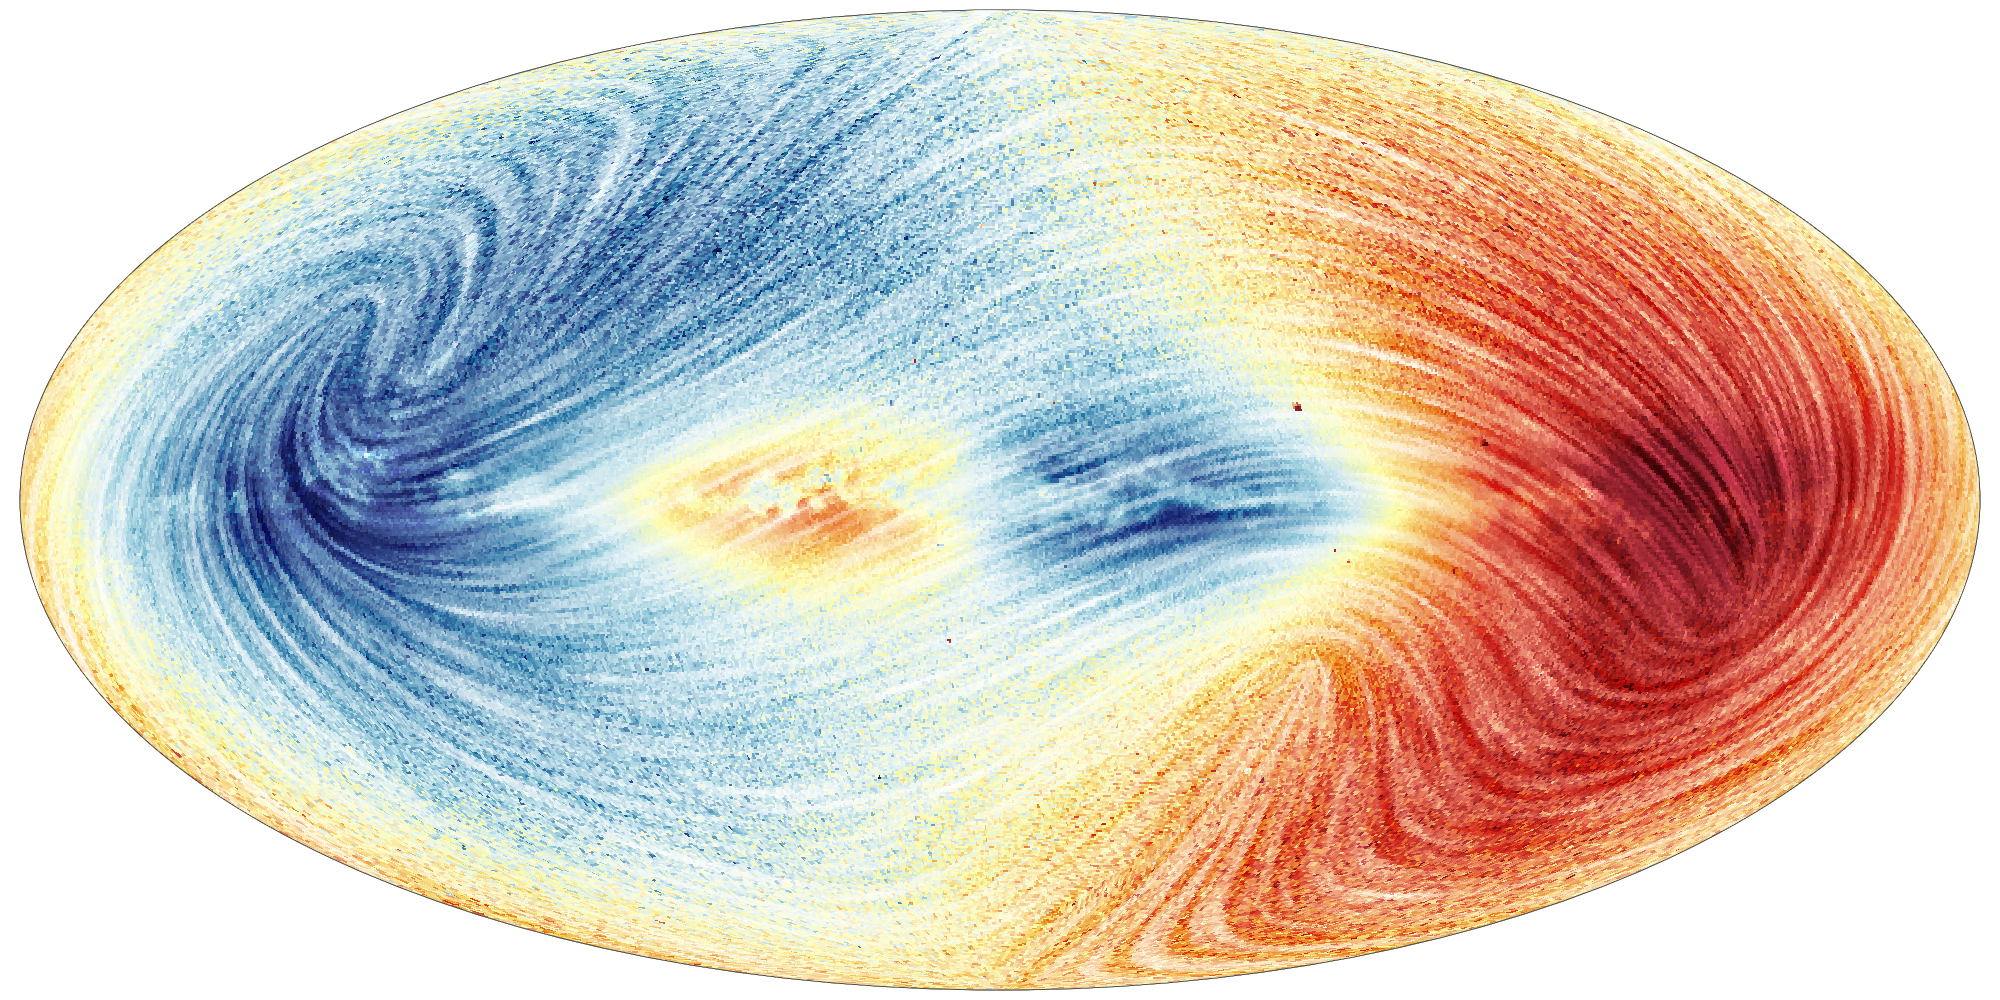
The data set with full velocity components, derived from both line-of-sight velocities and proper motions, is visualized in the below sky map. The colours show the same pattern seen in the line-of-sight velocity sky map in Figure 2. Here, red shows the parts of the sky where the average motion of stars is away from us, and blue shows the regions where the average motion of stars is towards us. The lines visible in the figure trace out the motion of stars projected on the sky, called proper motion. These lines show how the direction of the velocity vector varies by galactic latitude and longitude.
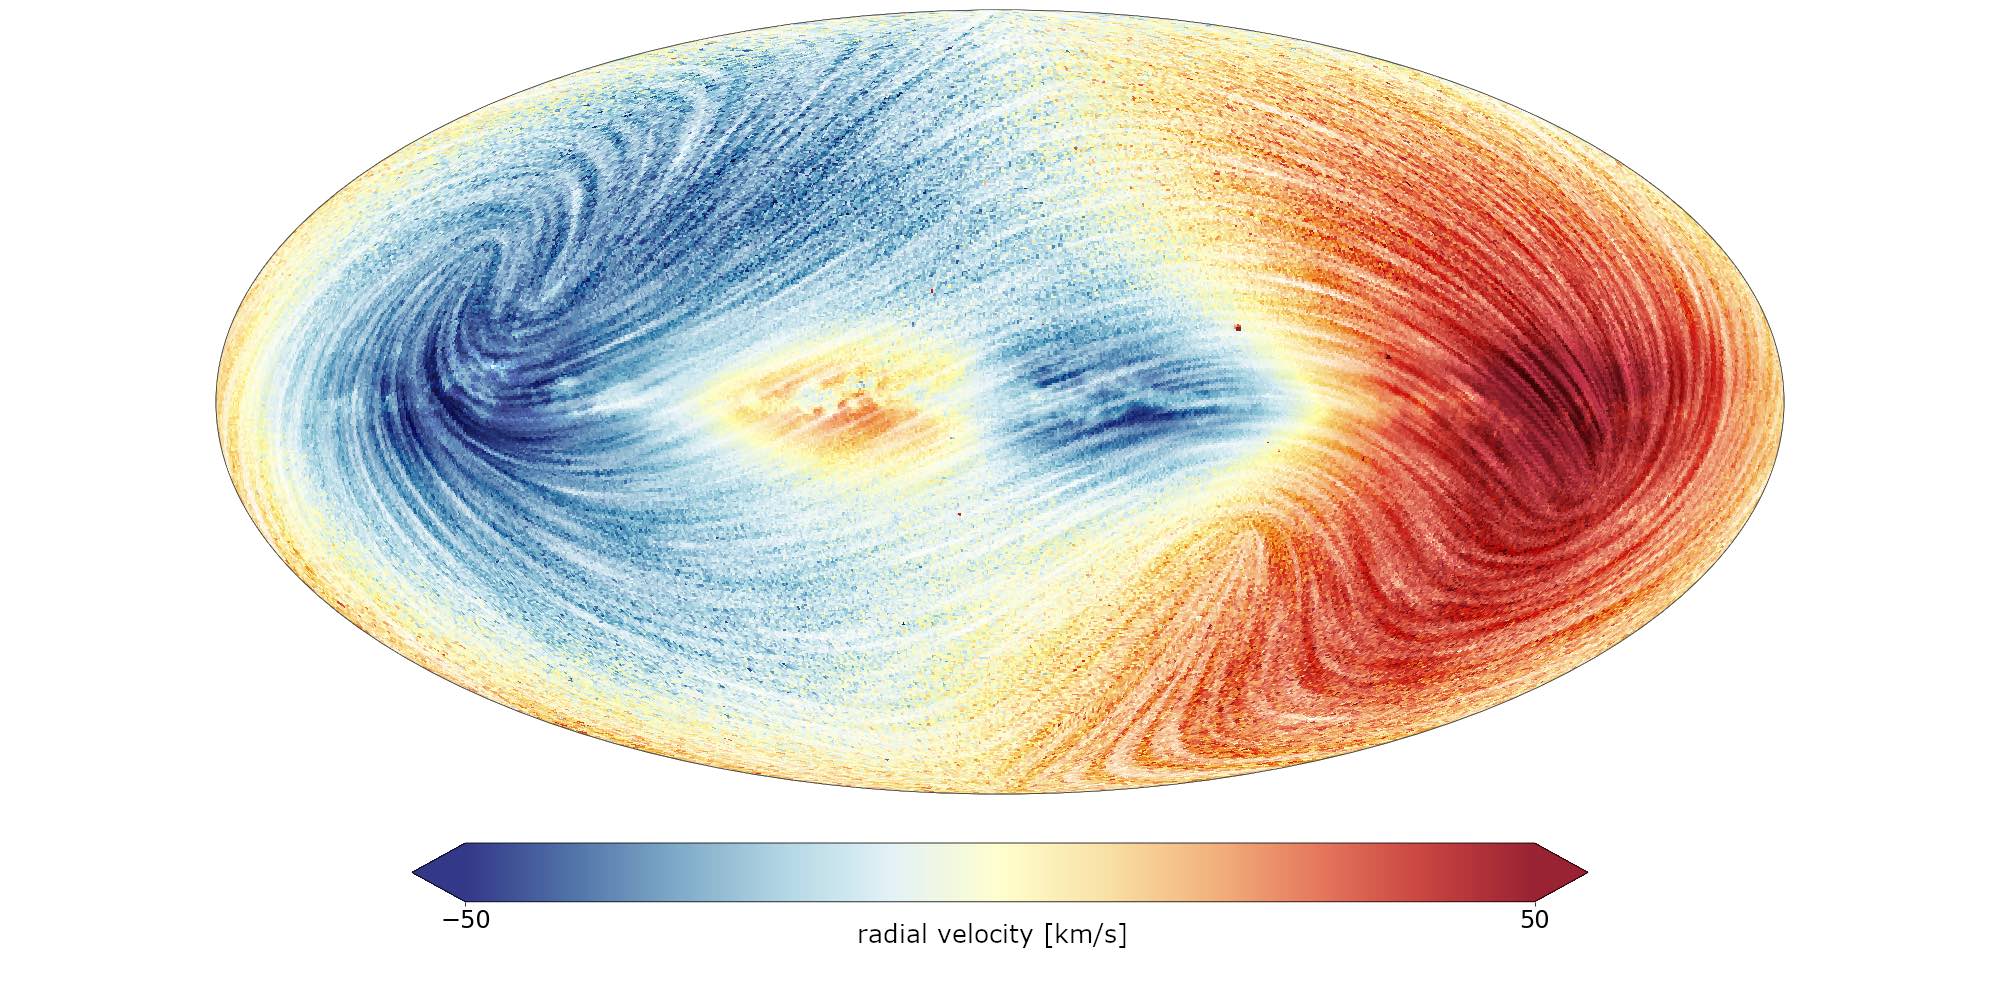
Figure 2. This sky map illustrates the measurements of the stellar velocities in the Milky Way using data from Gaia. The colour shows the line-of-sight velocity of stars. Blue shows the parts of the sky where the average radial motion of stars, relative to the Sun, is towards us, and red shows the regions of the sky where the average radial motion of stars is away from us. The lines overlaying the map show the streamlines of the proper motions of stars. These lines do not show the transverse motions of the stars in the Milky Way, but illustrate the proper motions as they are published in the catalogue, that is the right ascenscion and declination, projected onto the map in Galactic longitude and latitude. This artistic choice produces the line pattern, including the swirl on the left just above the galactic plane, and the 'peak' a the lower right. The figure is also sensitive to the motion of the Sun within the Galaxy. The LMC and SMC are not visible because stars were selected with well defined distances. The method used to generate the proper motion stream lines follows a modified version of a method from Okada & Kao (1997). The algorithm used was line integral convolution, from healpy. Credits: ESA/Gaia/DPAC - CC BY-SA 3.0 IGO. Acknowledgements: ESA/Gaia/DPAC/CU6, O.N. Snaith, P. Di Matteo, P. Sartoretti, N. Leclerc, D. Katz and the CU6 team. Download hires version here, without labels here.
These measured velocities are all relative to the Sun, which itself is orbiting the centre of the Galaxy. Taking into account the Sun’s own motion we can transform these relative velocities to motions with respect to Galactic centre. Then our view of the Milky Way’s kinematics suddenly becomes sharper, revealing structures with unprecedented detail. This can be seen clearly in the below animation, where a comparison is made between velocities derived from the APOGEE DR17 line-of-sight velocities and spectro-photometric distances derived from the astroNN neural-network (Leung & Bovy, 2019), and the corresponding plot derived in the paper: "Gaia Data Release 3: Mapping the asymmetric disc of the Milky Way" by the Gaia Collaboration, Drimmel, R., et al. 2022.
The sample from Gaia DR3 extends further out and the resolution is much improved, thanks to the large number of measurements. The cloverleaf pattern of negative-positive-negative-positive galactic radial velocities (that is, contracting and expanding motions with respect to the Galactic center) due to the stars orbiting within the Galactic bar, is also clearly seen. The change in sign is aligned with the bar axes. A bar angle of 20 degrees is inferred from the Gaia measurements – on the small end of past determinations. The angular rotation rate of the bar is also estimated and is found to be in good agreement with the most recent determinations using less direct methods.
Animation comparing the kinematics of the Milky Way from the APOGEE DR17 line-of-sight velocities and spectro-photometric distances derived from astroNN neural-network (Leung & Bovy, 2019) with the corresponding plot derived in the paper: "Gaia Data Release 3: Mapping the asymmetric disc of the Milky Way" by the Gaia Collaboration, Drimmel, R., et al. 2022. Credits ESA/Gaia/DPAC - CC BY-SA 3.0 IGO, using figures from the paper by the Gaia Collaboration, Drimmel, R., et al. 2022. ; and from Leung+2022. Acknowledgements: M. Romero-Gómez, L. Chemin
Though Gaia cannot see to the far side of the Galaxy, the pattern is clearly detectable. This is the first time the velocity pattern of the Milky Way is so well resolved over such a large extent of its disc!

Tangential velocities are velocities along the orbit. The closer to the centre the lower the velocity along the orbit (the more blue). Higher tangential velocities show up in red. Credits: ESA/Gaia/DPAC - CC BY-SA 3.0 IGO, using figures from the paper "Gaia Data Release 3: Mapping the asymmetric disc of the Milky Way" by the Gaia Collaboration, Drimmel, R., et al. 2022
Everything in our Galaxy orbits around its centre, very much like a thin spinning disk. Stars closer to the centre travel on slower but shorter orbits and take less time to make one full orbit with respect stars near the Sun. The tangential velocities map shows a decreasing velocity moving towards the Galactic centre.
Video highlighting the results from the paper "Gaia Data Release 3: Mapping the asymmetric disc of the Milky Way" by the Gaia Collaboration, Drimmel, R., et al. 2022. Credit: ESA/Gaia/DPAC, CC BY-SA 3.0 IGO. Acknowledgements: Created by Alex Lobel using Gaia Sky and GIMP. French and Dutch versions of this video are available here.
A big advance is made with the new Gaia Data Release 3 in the mapping of the kinematics of our Milky Way. These are exciting times for astronomers studying both the current dynamical state of our Milky Way, as well as those trying to reconstruct its history and the events that shaped it until now!
Credits: ESA/Gaia/DPAC
Story written by Tineke Roegiers, Ronald Drimmel, Mercé Romero-Gómez, Paola Sartoretti, David Katz, Alex Lobel, Owain Snaith
Published: 13 June 2022
More Gaia DR3 stories?
Where are the stars? How far away are they? How bright are the stars?
What colour do they have? What are the stars made of?
Where do they go? Where do they come from? Do they approach us? Do they move away?
Did something move in front of the star? What is in between the stars?
How big, warm, old, ... are they? How do they Blink?
Is it a double star? Do they go boom? Is it a galaxy?
Is it a solar system object? Is it a quasar?
Who created the data? Can I Use Gaia data with other observatories?
How did DPAC produce the data for this star? Where is the data?
-
ESA's press release of Gaia Data Release 3
-
Gaia's Early Data Release 3 stories
-
ESA's press release of Gaia Early Data Release 3
- Removed a total of (16) style text-align:center;
- Removed a total of (1) style float:right;