
 Sign in
Is it a quasar? - Gaia
Is it a quasar?
The Gaia DR3 quasar candidates
Quasars are so distant that their physical movement relative to the Solar System is incredibly small, and their expected motion is below the Gaia detection limit. We still observe some apparent proper motion however, which is a combination of observational noise and tiny effects reflecting the motion of the Solar System in the Universe. Because their positions are fixed in the observations taken by Gaia, quasars can be used as reference points. A selection of known quasars was used as the set of reference points to form an optical reference frame, the Gaia Celestial Reference Frame 3.
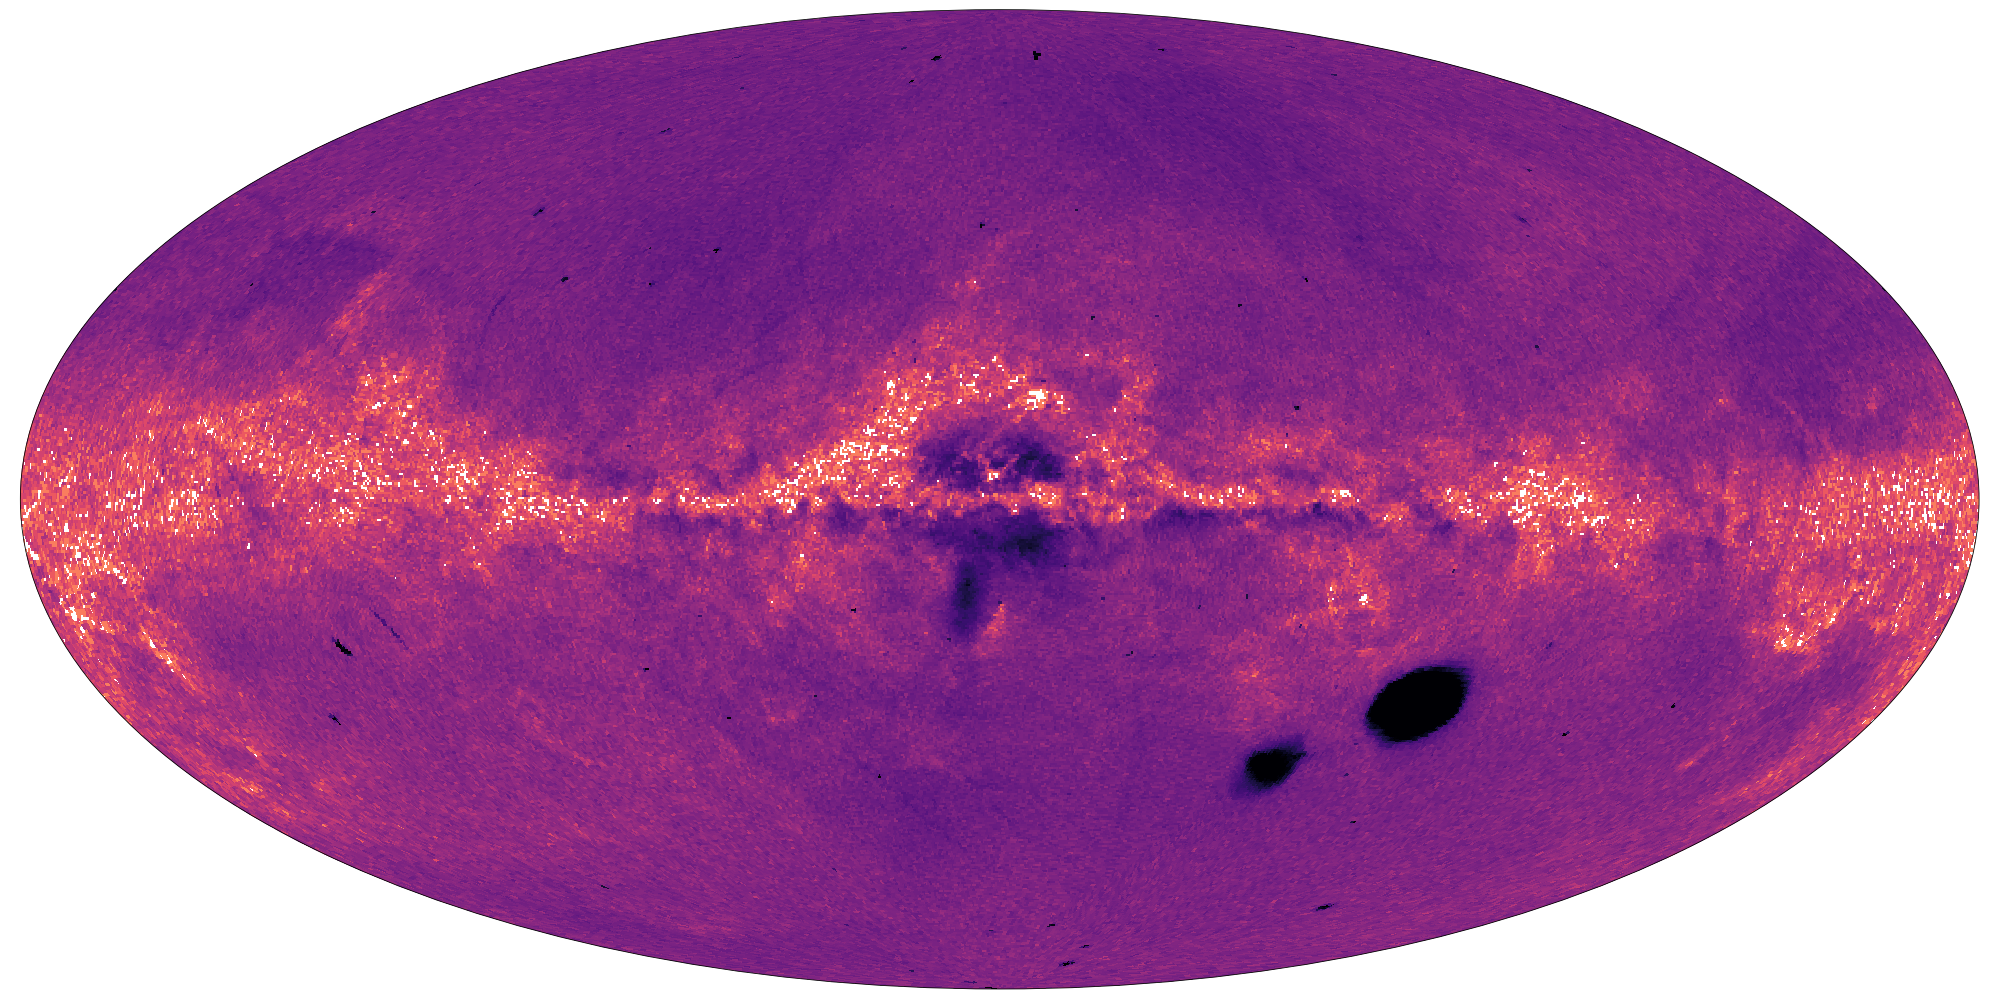
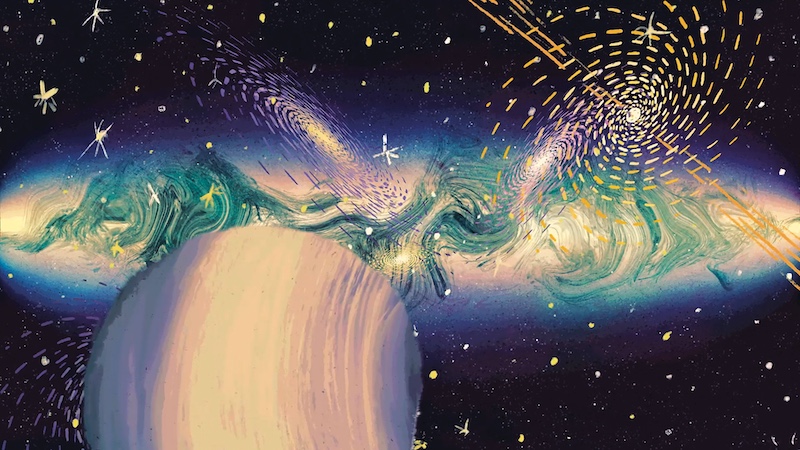
Figure 1: Galactic sky distribution of all quasar candidates in Gaia DR3. Since the classifying modules are imperfect and some are completeness driven, there is contamination, which can be alleviated with appropriate filtering. Image credit: ESA/Gaia/DPAC- CC BY-SA 3.0 IGO, based on Gaia Collaboration, Bailer-Jones, et al. 2022.
Over time, Gaia has measured a lot of these fixed points in space, and in Gaia Data Release 3 a catalogue of 6.6 million quasar candidates is published. This table is a result of various modules that exploit different Gaia data products and that are aimed at finding quasars. The modules use parallax, proper motion, BP/RP spectra, brightness and/or variability to classify Gaia objects. There are various distinct classifiers. For example, the “Discrete Source Classifier” uses all of the mentioned data to classify each Gaia source, whereas other classifiers focus on a subset of the available properties. In addition to those classifiers, further modules serve to identify additional candidates, constrain the nature of the extragalactic objects, and derive their properties.
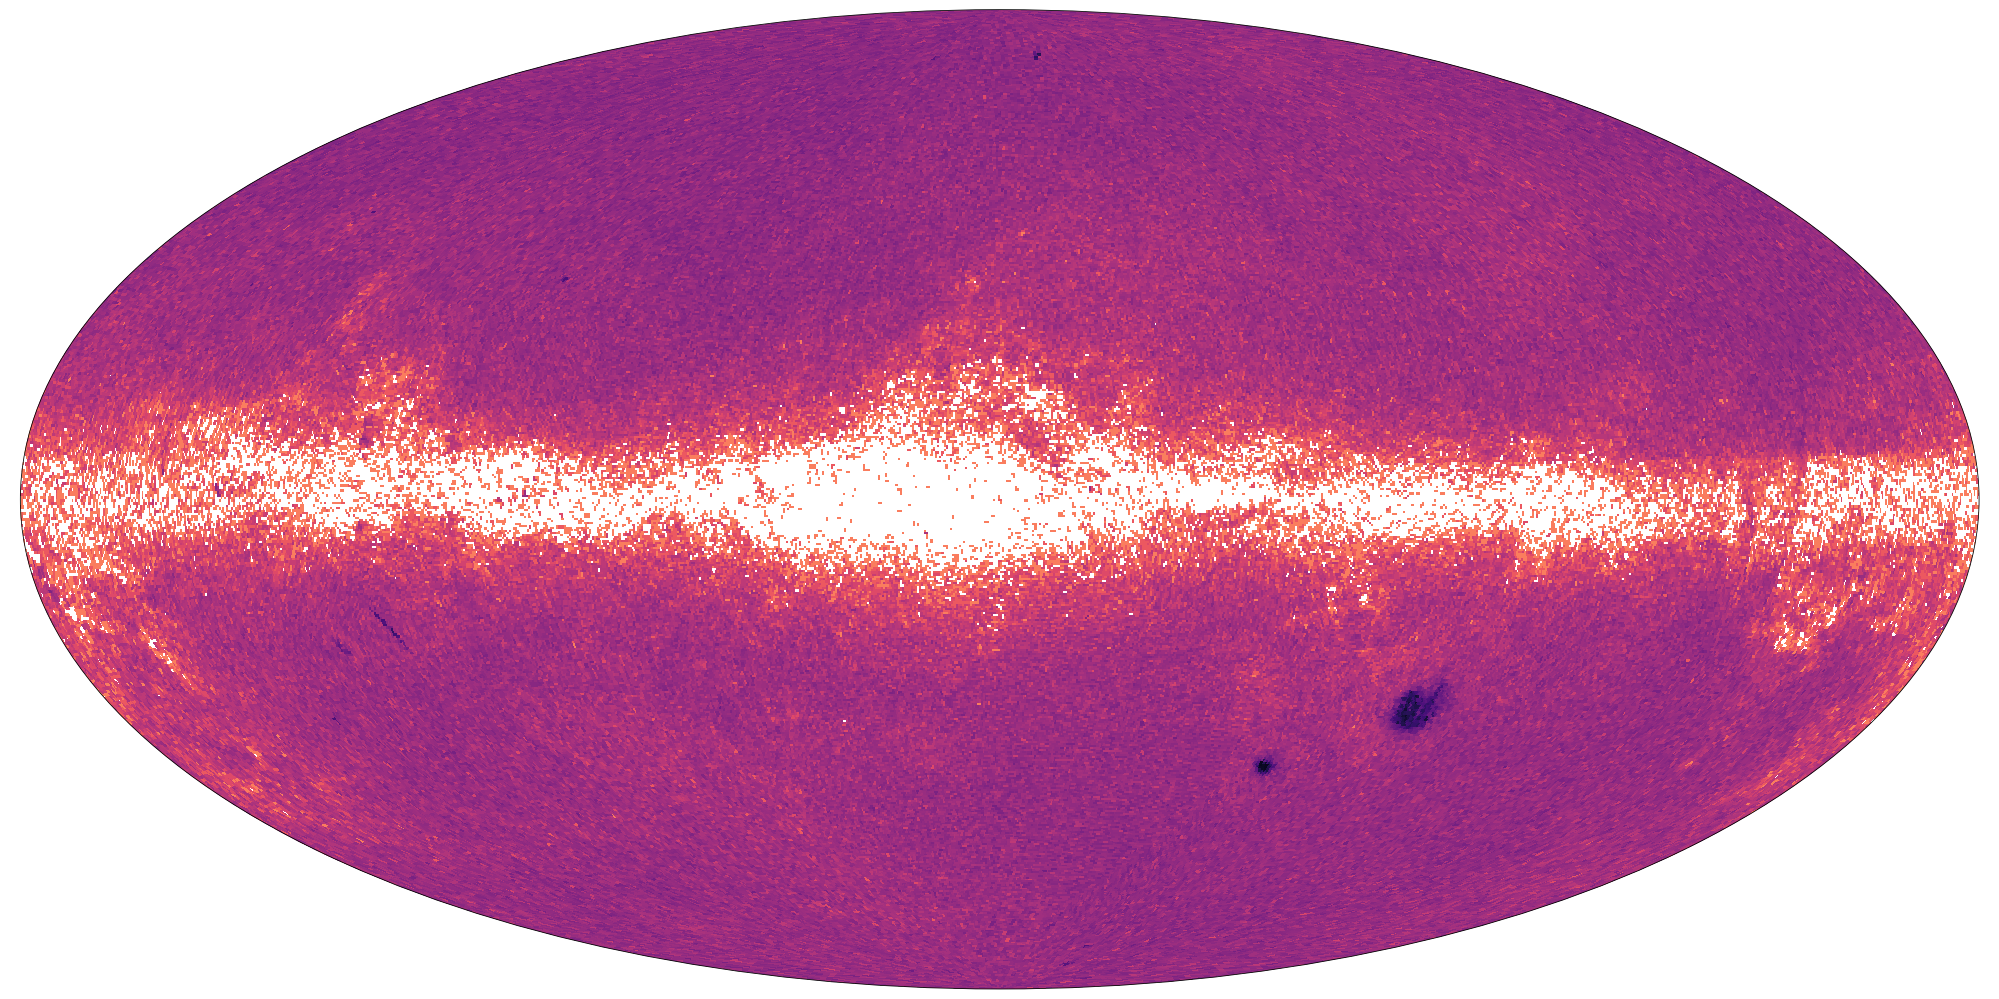
Figure 2: Purer selection of quasar candidates, as suggested in the paper, including only objects with a high "confidence" in their classification. Notably the galactic plane has a much lower density with these subsets, however there is still evidence for imperfect purity (overdensities at the LMC and SMC as well as artefacts from the scanning law). Image credit: ESA/Gaia/DPAC - CC BY-SA 3.0 IGO, based on Gaia Collaboration, Bailer-Jones, et al. 2022.
The resulting table aims for high completeness rather than high purity and has a purity level of about 50%. However, a purer subsample containing 1.9 million sources with an estimated overall purity of about 95% has also been created. A query to obtain this purer subsample is available from the paper “Gaia Data Release 3: the extragalactic content” by the Gaia Collaboration. This purer subsample forms a great starting point for follow-up studies of quasars. The paper itself also serves as a guideline so that the user can select their own subsamples from the candidate catalogue.
The redshifts of the quasar candidates were computed from Gaia’s low-resolution BP/RP spectra, using a chi-squared approach through comparison to an SDSS composite spectrum. 1.7 million quasars in the purer subsample (of 1.9 million quasars) have Gaia redshifts in DR3. Knowing the redshift of a quasar tells us its age and thus its place in the evolution of the Universe. Knowing the age of a sequence of quasars helps to understand how quasars evolve with time. The quasar redshifts also allow us to construct a composite quasar spectrum that itself may serve as a reference spectrum to classify individual quasars, to identify faint and otherwise undetectable lines, and to construct colour-colour relations for identifying and characterising quasars based on photometry.
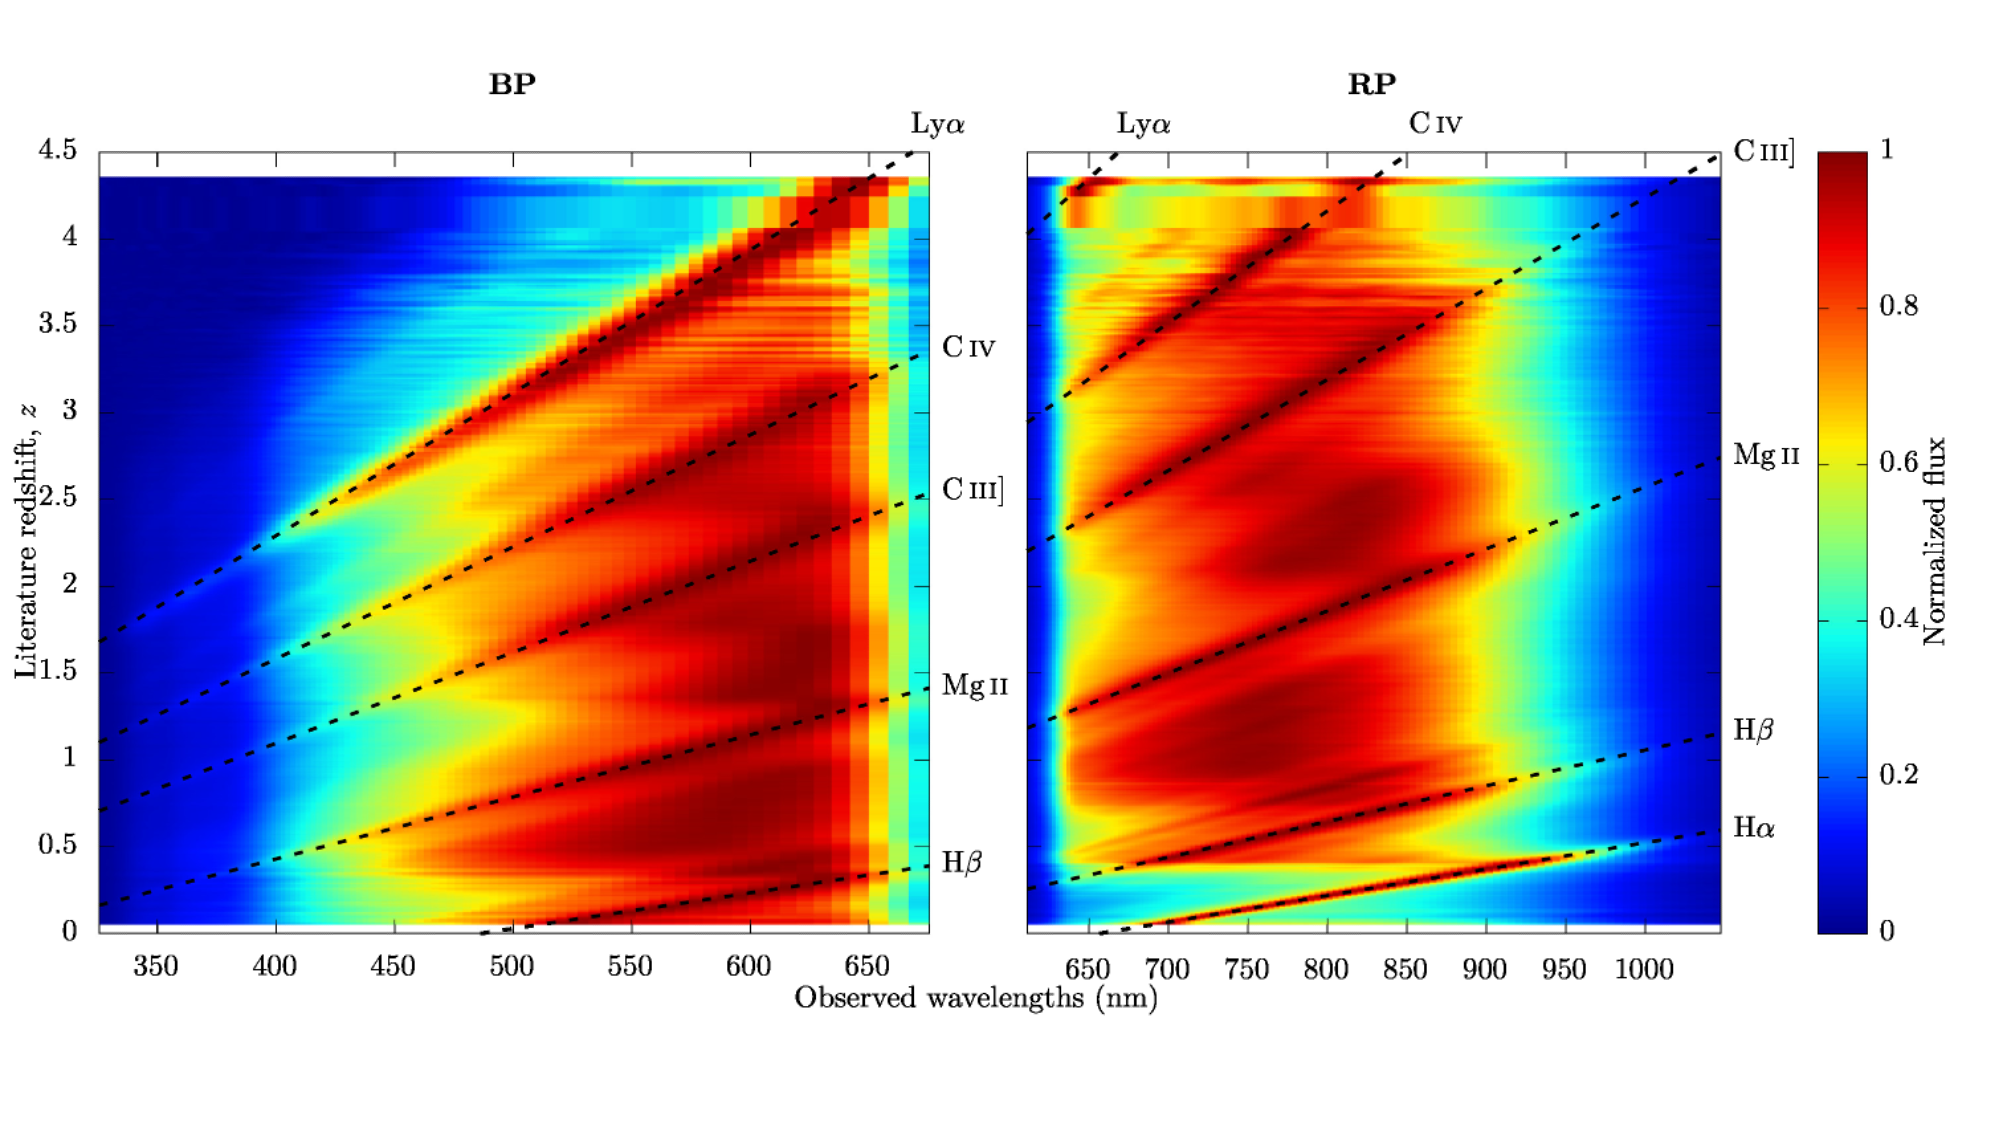
Figure 3: Distribution of the BP (left) and RP (right) fluxes of a subset of Gaia DR3 quasars that have spectroscopically confirmed redshifts in the Milliquas 7.2 quasar catalogue (Flesch 2021). The dotted lines show the dominant quasar emission lines. Image credit: Gaia Collaboration, Bailer-Jones, et al. 2022 - CC BY-SA 3.0 IGO.
Quasars are active galactic nuclei that are extremely energetic and bright and are very distant from us. They result from the interaction of a central supermassive black hole with the surrounding galactic matter. Usually, the host galaxies of quasars are too distant to be measured and studied but, thanks to the exceptional resolving power of Gaia, it has been possible to detect and analyse some of these host galaxies.
Specific algorithms were developed to retrieve the two-dimensional surface brightness profile of the central quasar and its host galaxy by combining the information of the various one-dimensional observations that Gaia takes. A model finds the set of parameters of the two light profiles (quasar and galaxy) that best reproduce the observations. Observing from space is a great advantage for Gaia when it comes to analysing the morphology of extragalactic sources, because it avoids the atmospheric blurring that affects observations from the ground.
1.1 million quasars were analyzed for their profiles and a host galaxy was detected in 64 000 of them. An accurate light profile could be fit for 15 000 of these, and reveals that most of the quasar host galaxies are essentially disk galaxies. This data set provides, for the first time, an all-sky survey of morphology of galaxies hosting a quasar. These are predominantly the nearest quasars, because Gaia cannot resolve the host galaxies of the more distant quasars.
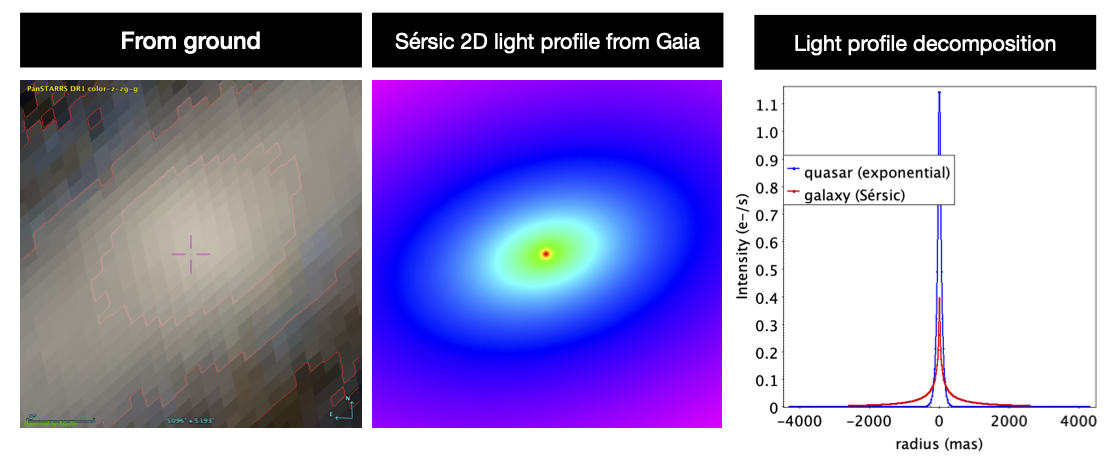
Figure 4: Using the parameters of the light profile given in the Gaia DR3 (as illustrated in the right panel), it is possible to produce a synthetic image of the quasar and its host galaxy (middle panel). The object shown in this figure has also been photographed from Earth with PanSTARRS (as shown in the left panel), which allows us to compare these images: from the ground, the atmosphere blurs the image, whereas Gaia can reconstruct its shape more precisely. Image credits: Ducourant, et al. 2022 - CC BY-SA 3.0 IGO (middle and right panel), PanSTARRS (left panel).
For readers wishing to use the Gaia DR3 extragalactic content guidance is given on how to do so in the paper “Gaia Data Release 3: The extragalactic content” by the Gaia Collaboration, Bailer-Jones, C.A.L., et al. 2022. Since extragalactic objects are classified or analysed by several modules in the Gaia data processing, it provides an overview of the various methods and caveats, allowing the user to build their own tailor-made selection of quasars for their science.
This animation shows how to obtain a composite quasar spectrum from a number of noisy Gaia BP/RP spectra. The composite is constructed from 42 944 combined BP/RP spectra, although only 100 of them are displayed here. The animation illustrates, for each spectrum, how it is rescaled (rescaling of the flux densities to align the continua) and then shifted to the restframe using the quasar's spectroscopic redshift (taken from the Milliquas 7.2 quasar catalogue). The shifts of the first three spectra are slowed down for the presenter to be able to explain the concepts whilst playing the movie. At the end of the video, the composite spectrum (using all 42 944 spectra, not just the 100) is displayed in blue. Credit: ESA/Gaia/DPAC - CC BY-SA 3.0 IGO and Milliquas catalogue: Flesch, E. W. 2021 (no images are used from that catalogue, just the redshifts). Acknowledgements: animation created by Coryn Bailer-Jones, Catrina Diener and Ludovic Delchambre based on the paper "Gaia Data Release 3: the extragalactic content" by Gaia Collaboration, Bailer-Jones, et al. 2022.
© CNES 2022 Gaia Data Release 3 brings data on the Milky Way, but also on objects in our Solar System and on galaxies and quasars. Screenshot from the video on the Gaia ground segment as created by CNES. Credit :Burgain Claire, Debeir Clément - SapiensSapiens. Published here. High-resolution image for download here.
Credits: ESA/Gaia/DPAC
Story written by: Tineke Roegiers, Coryn Bailer-Jones, Catrina Diener, Christine Ducourant, Sergei Klioner
Published: 13 June 2022
- Removed a total of (14) style text-align:center;
- Removed a total of (10) style text-align:justify;
More Gaia DR3 stories?
Where are the stars? How far away are they? How bright are the stars?
What colour do they have? What are the stars made of?
Where do they go? Where do they come from? Do they approach us? Do they move away?
Did something move in front of the star? What is in between the stars?
How big, warm, old, ... are they? How do they Blink?
Is it a double star? Do they go boom? Is it a galaxy?
Is it a solar system object? Is it a quasar?
Who created the data? Can I Use Gaia data with other observatories?
How did DPAC produce the data for this star? Where is the data?
-
ESA's press release of Gaia Data Release 3
-
Gaia's Early Data Release 3 stories
-
ESA's press release of Gaia Early Data Release 3
- Removed a total of (16) style text-align:center;
- Removed a total of (1) style float:right;