
 Sign in
How bright are the stars? - Gaia
How bright are the stars?
The Gaia DR3 magnitudes
The Gaia brightnesses are derived from the light measurements obtained through the astrometric instrument. This is the core element in the focal plane used to determine the positions, proper motions and parallaxes as well. Gaia’s Coordination Unit 5 is responsible for the translation of the raw light measurements into the mean and epoch brightness in the broad band G and also the photometry coming from the BP and RP photometers.
The Gaia filters (selecting which wavelengths are used, a bit like wearing sunglasses filtering the light) are chosen such that Gaia makes the optimal use of the stars’ light with a focus on achieving the highest precision in the astrometric measurements. This means that Gaia is not specifically designed to measure the very brightest stars. Hence, the Gaia releases don’t contain much data about these brightest stars (the ones most easily visible when looking up into the sky).
Even though the stars we see in the night sky seem very bright, they may not emit a lot of light in an absolute sense. We see many of them as bright stars because they are close to us. Similarly, stars that are very far away may seem very faint to us but are in fact amongst the brightest and largest of all stars. The distance to a star is very important in interpreting how bright a star really is in comparison to how bright we see it.
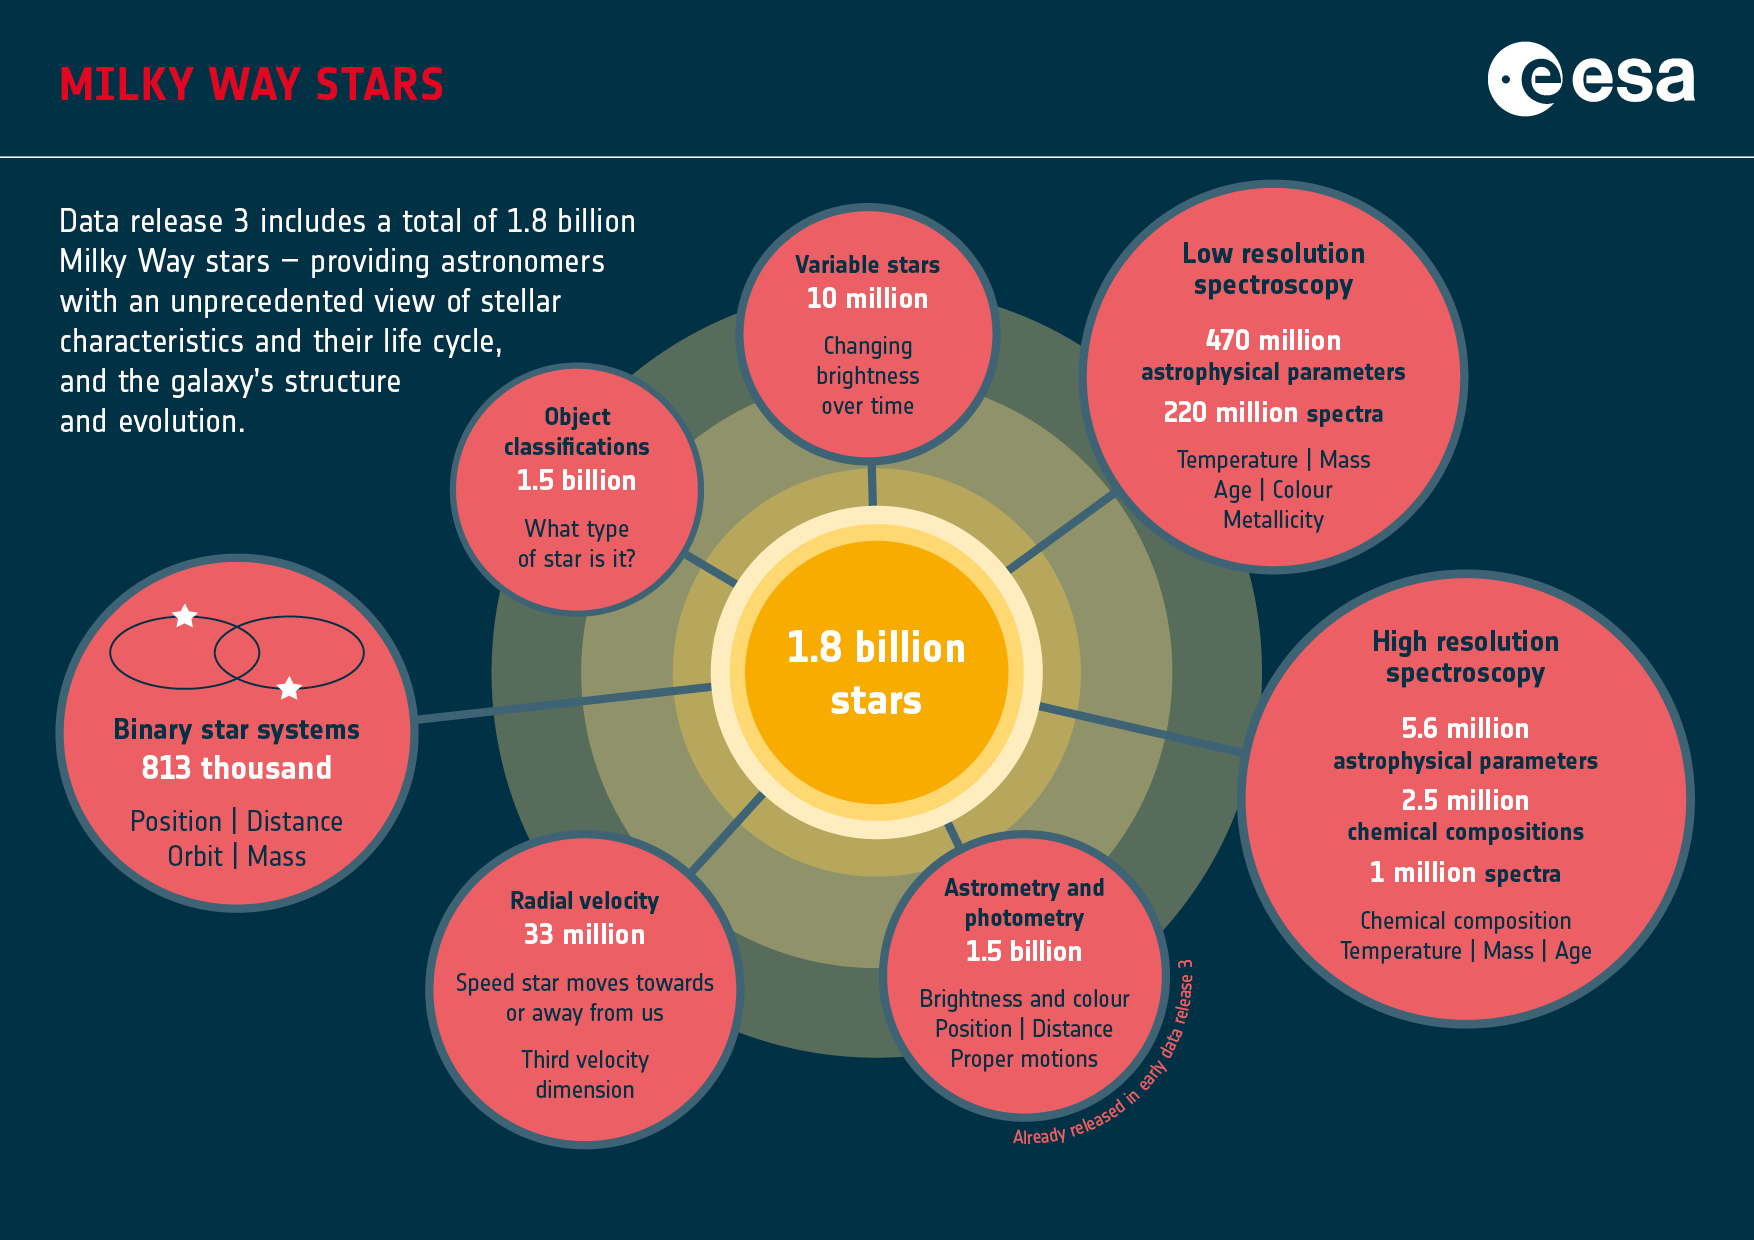
Figure 1: Overview of Gaia Data Release 3 and the contents available for Milky Way stars. As published here. Credits: ESA
Gaia’s new release contains 1.8 billion sources with mean brightnesses. These were already released with Gaia’s early data release 3 in December 2020. Now, with Gaia Data Release 3, light curves for stars with changing brightnesses (variables) are also released for almost 12 million stars as well as brightnesses derived from the RVS spectra (Grvs magnitudes).
The GRVS magnitude is a new parameter in Gaia DR3 and is published for 32.2 million stars (see paper Sartoretti et al. 2022). It is the measure of how bright the stars are in the narrow wavelength range covered by the RVS spectra. GRVS is obtained by integrating the star flux contained in the RVS spectra. It provides information that is complementary to that obtained from G,GBP and GRP and is useful to constrain a star’s metallicity, to separate cool dwarfs from cool giants, and to constrain interstellar extinction.
The figure below shows the skymap of the colour G-GRVS, where the effect of the extinction by the interstellar dust is highlighted.
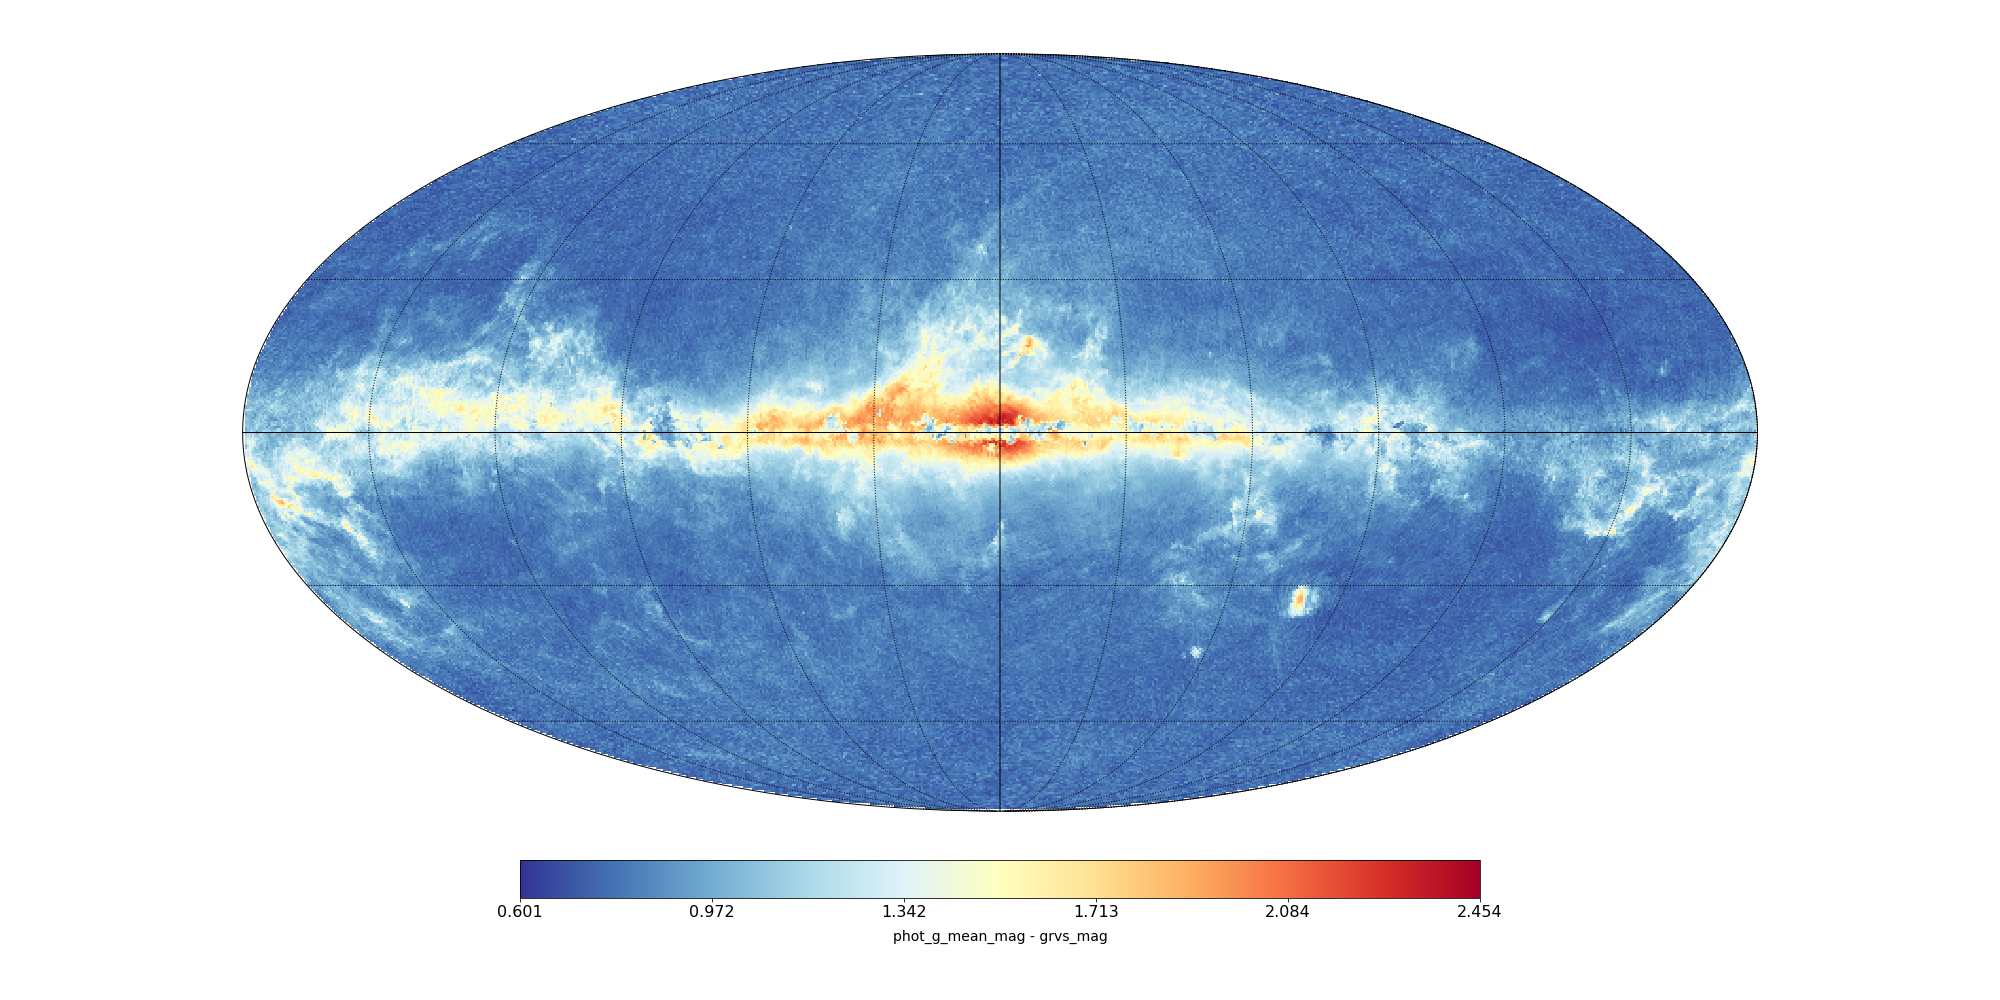
Figure 2. Sky map of G-GRVS. Median G-GRVS colour in HEALpix 7, highlighting the effect of extinction by interstellar dust. GRVS is derived from the integration of the Radial Velocity Spectrometer spectra by the Coordination Unit 6 of DPAC. Credits: ESA/Gaia/DPAC - CC BY-SA 3.0 IGO. Acknowledgements: ESA/Gaia/DPAC/CU6, N. Leclerc, P. Sartoretti and the CU6 team
Some stars vary their brightnesses and this provides useful information on what sort of star they are. Gaia’s Coordination Unit 7 is responsible for this analysis of the epoch photometric data in order to identify these variables and find out more about what they are (see paper Eyer et al. 2022). More than 10 million stars have been identified in Gaia DR3 as clearly variable and have their light curves published. A significant proportion of them have been classified into 24 different variability types. These include eclipsing binaries, pulsating or rotating variables and cataclysmic variables.
These light curves are not only in the G passband, but also BP and RP ones too. Not only can we see the brightnesses vary over time, but also their colours. For some stars, we also have their epoch radial velocities and can see how these change with time. In these cases, this is not due to the star itself moving away and back towards us but is caused by the surface of the star pulsating.
Having a data set that combines many different types of data that has been effectively measured at the same time is one of the things that makes Gaia so powerful and unique.
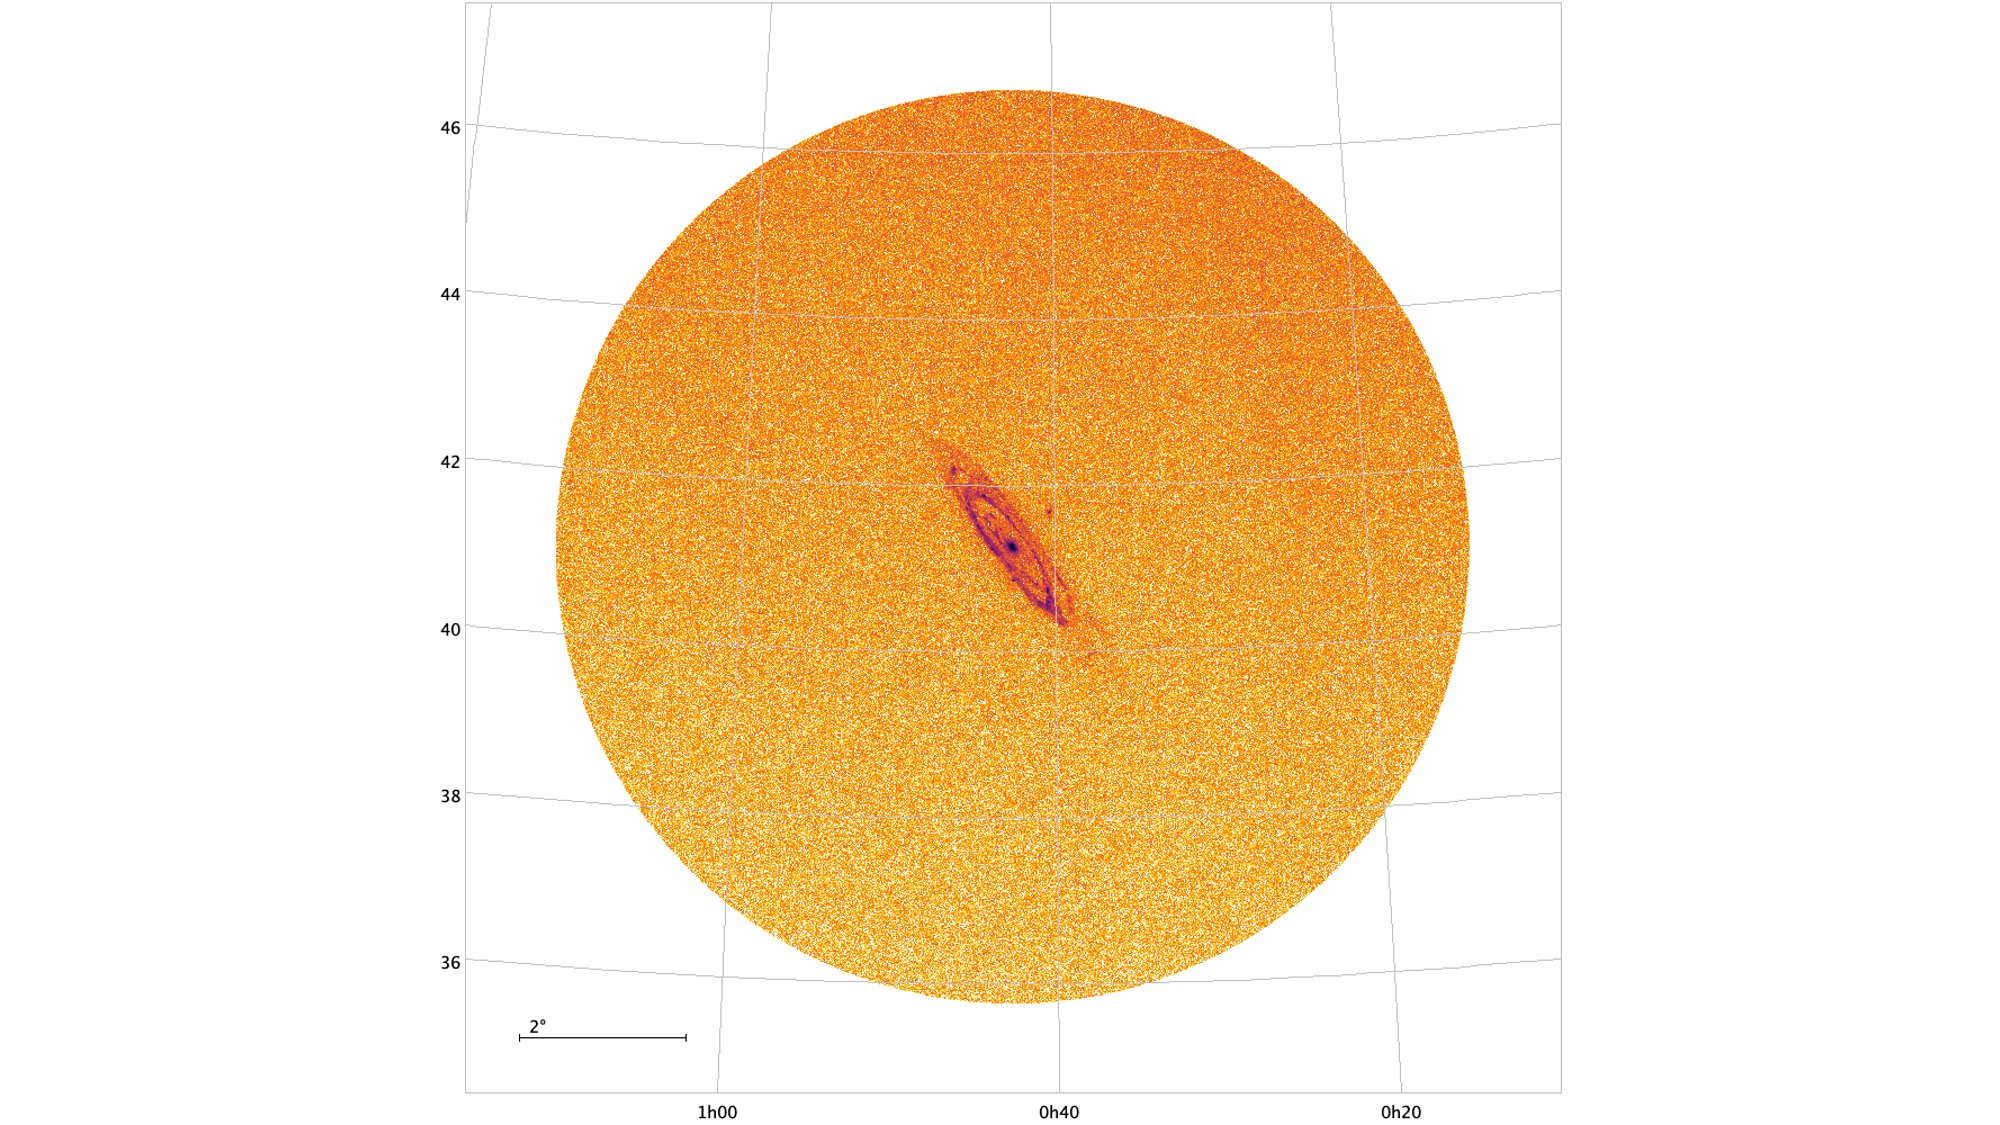
Figure 3. All the stars in the Gaia Andromeda Photometric Survey. Evans et al. 2022. CC BY-SA 3.0 IGO.
In addition to light curves of more than 10 million variables, the Gaia release contains also light curves of all stars (variables and constant stars) within 5 degrees of the Andromeda Galaxy (M31). This is our sister galaxy and is a spiral galaxy just like the Milky Way. By releasing the individual epoch photometry of a small subset of the catalogue, astronomers can test the data more thoroughly and get a sneak preview of what is to come in the next data release when all the light curves will get published.
But a small subset still means 1.2 million stars! Astronomers tend to think in large numbers. Remember that the whole catalogue contains 1.8 billion stars.
Credits: ESA/Gaia/DPAC
Story written by Tineke Roegiers, Dafydd Wyn Evans, Francesca De Angeli, Paola Sartoretti
Published 13 June 2022
- Removed a total of (8) style text-align:center;
- Removed a total of (11) style text-align:justify;
More Gaia DR3 stories?
Where are the stars? How far away are they? How bright are the stars?
What colour do they have? What are the stars made of?
Where do they go? Where do they come from? Do they approach us? Do they move away?
Did something move in front of the star? What is in between the stars?
How big, warm, old, ... are they? How do they Blink?
Is it a double star? Do they go boom? Is it a galaxy?
Is it a solar system object? Is it a quasar?
Who created the data? Can I Use Gaia data with other observatories?
How did DPAC produce the data for this star? Where is the data?
-
ESA's press release of Gaia Data Release 3
-
Gaia's Early Data Release 3 stories
-
ESA's press release of Gaia Early Data Release 3
- Removed a total of (16) style text-align:center;
- Removed a total of (1) style float:right;