
 Sign in
Where do the stars go or come from? - Gaia
Where do the stars go? Where do they come from?
Wavy proper motion patterns and the rotation of the Milky Way disk
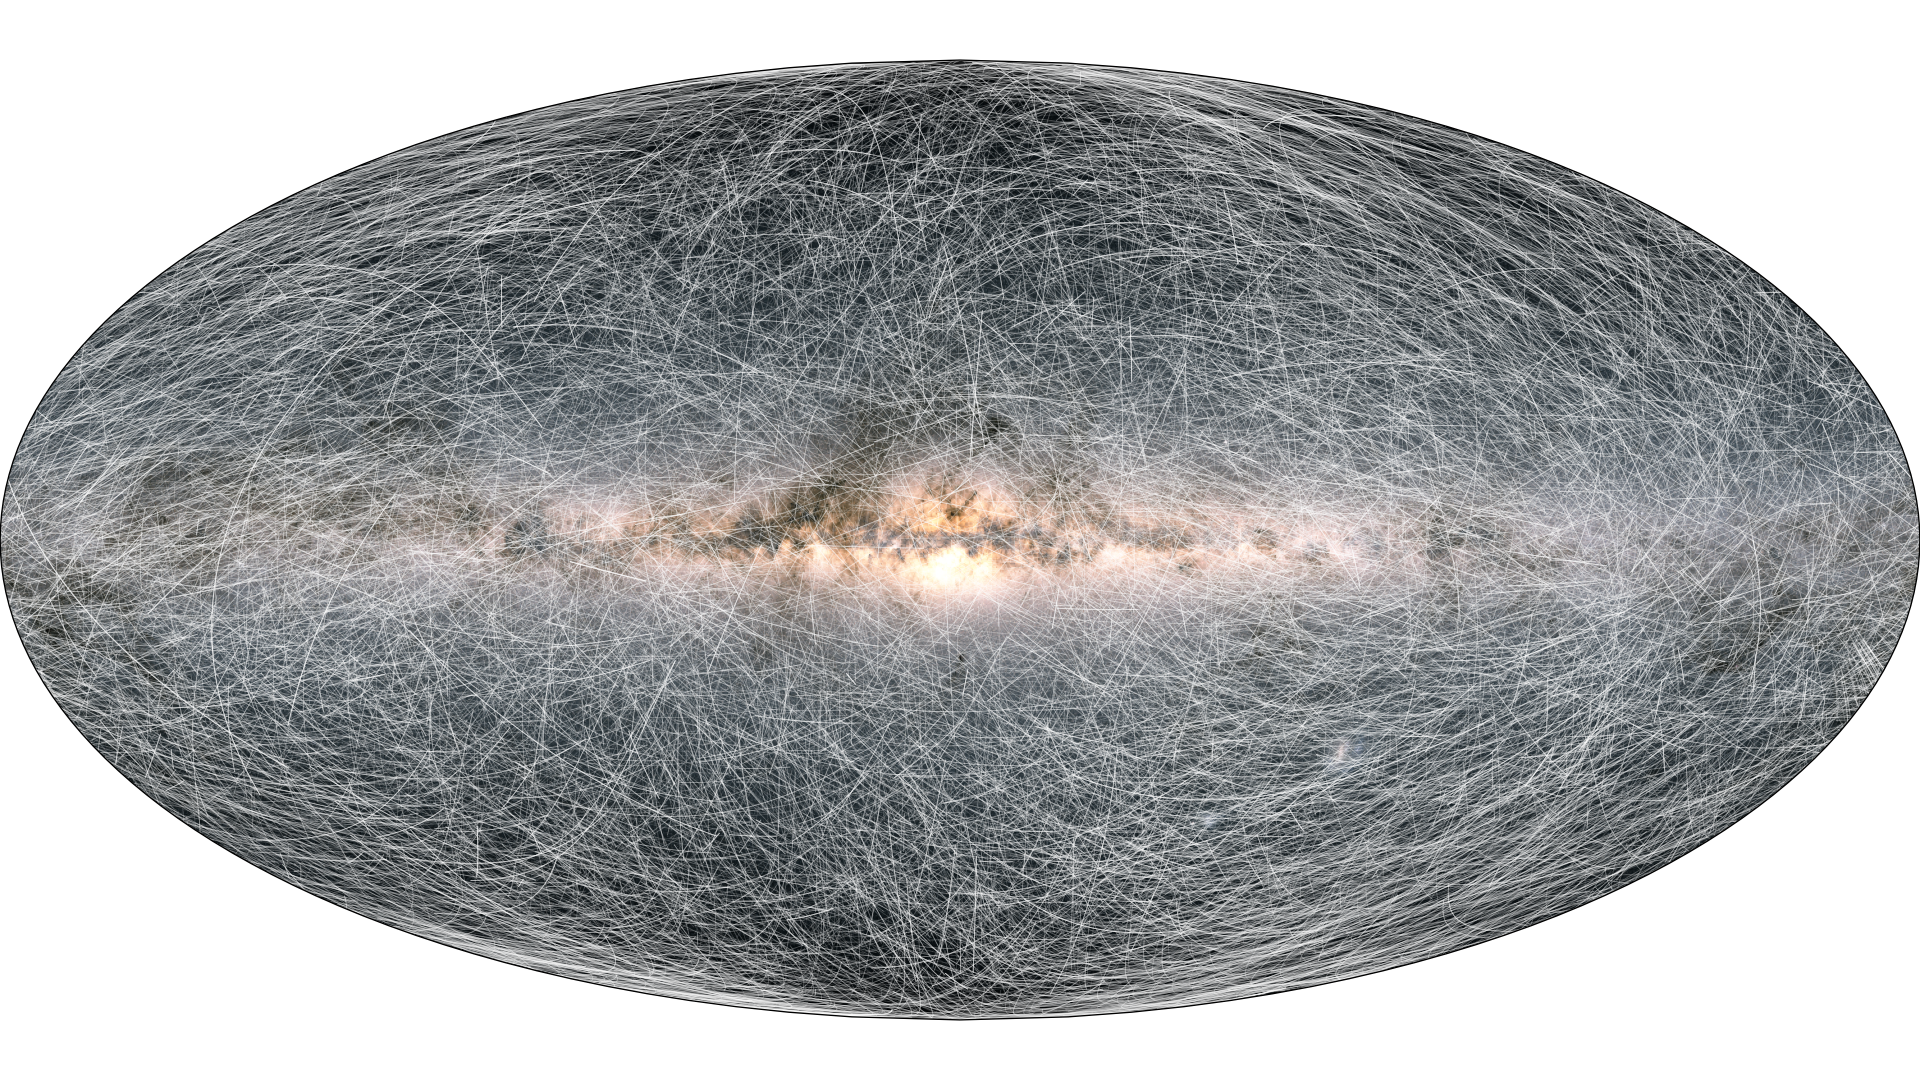
In the image below we see a colour map of the entire night sky constructed from the Gaia measurements of the positions of stars in the sky, as well as their brightness and colour.
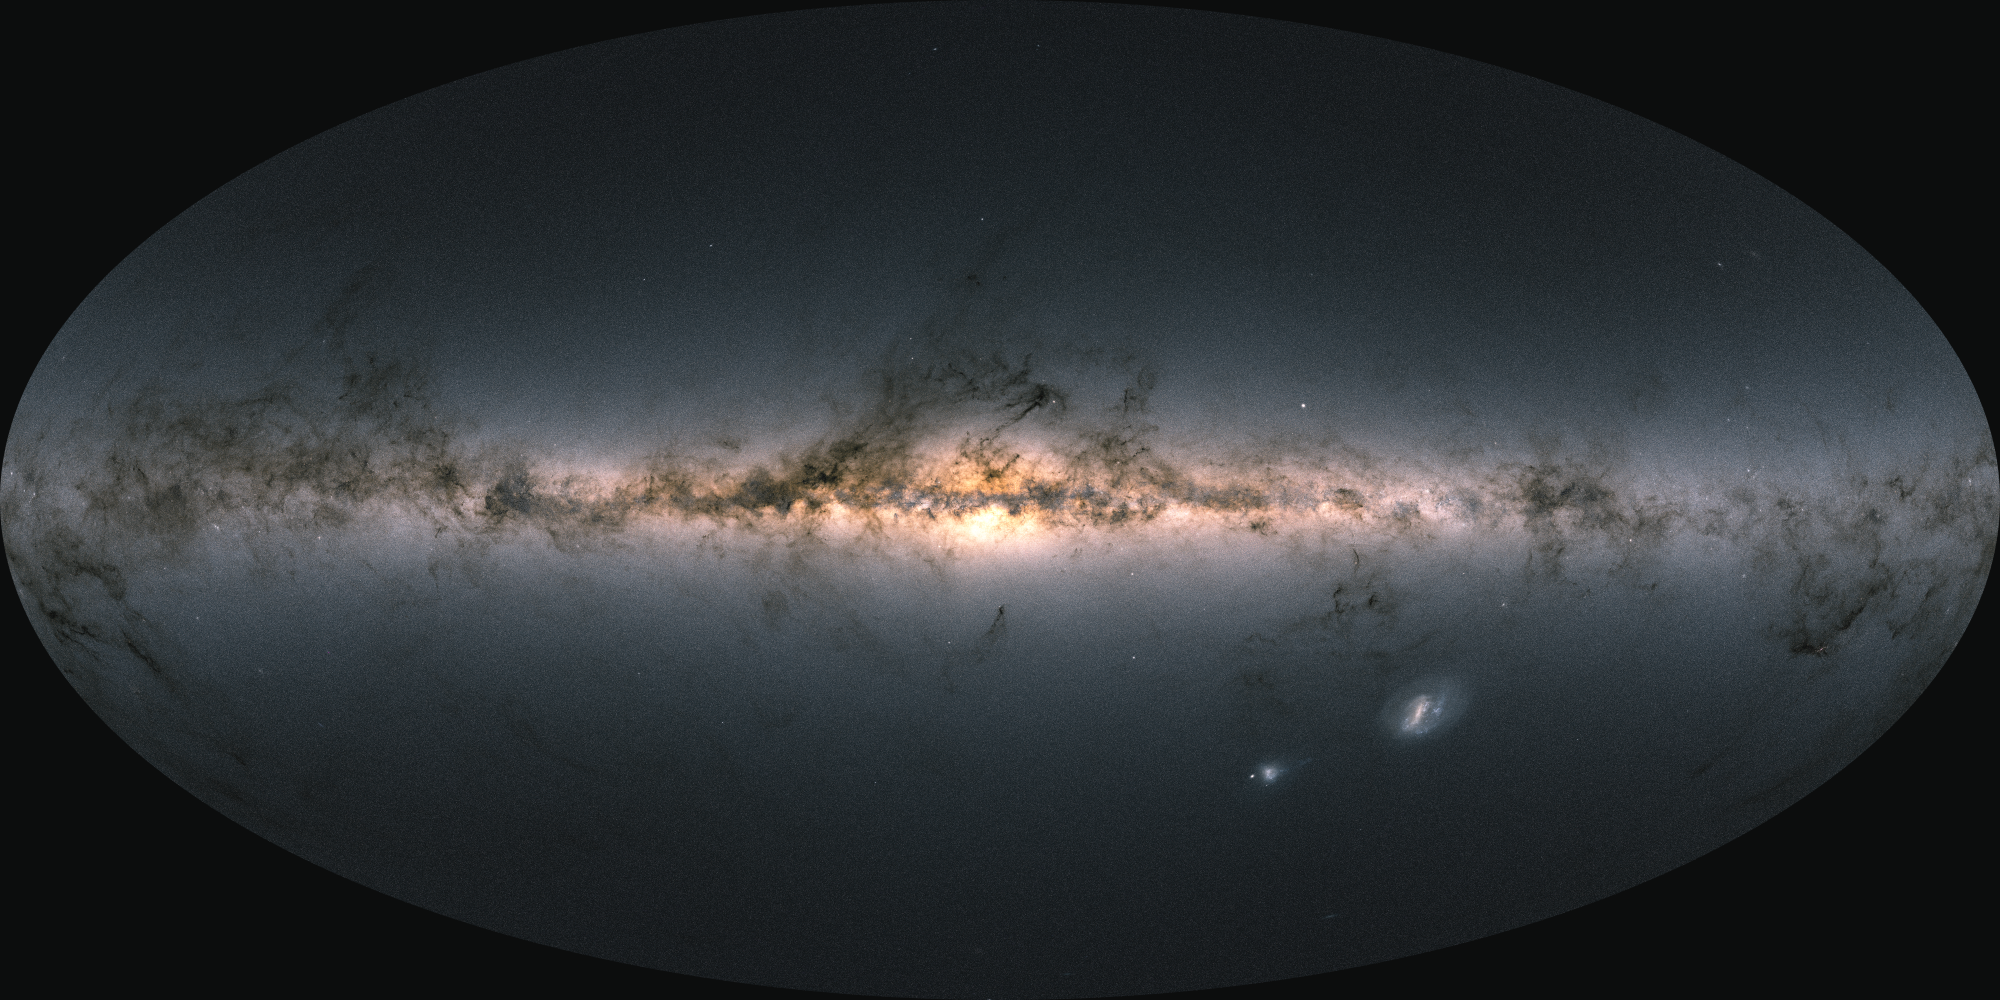
Figure 1: Colour map of the night sky constructed from Gaia data. Credits: ESA/Gaia/DPAC - CC BY-SA 3.0 IGO.
The bright band running horizontally across the middle of the image is the Milky Way which can be seen at night if you are in a dark place. This band is caused by our view from inside our home galaxy, also called the Milky Way. As explained in this item on the anatomy of the Milky Way, our galaxy consists of a flat disk with spiral arms and a thicker central part, consisting of the bar and the bulge. The halo of our galaxy surrounds the disk.
Because of our position inside the Milky Way we see our galaxy’s disk edge-on and this leads to a concentration of stars along the bright band in the Gaia sky map. This bright band also coincides with the ‘equator’ of our sky coordinate system, in which we indicate directions to stars as their ‘galactic longitude’, which runs along the Milky Way band as indicated in the image below, and ‘galactic latitude’, which runs perpendicular to the Milky Way band (basically the same as geographic longitude and latitude used to locate places on earth). The direction to the centre of the Milky Way is at longitude 0 degrees and latitude 0 degrees.
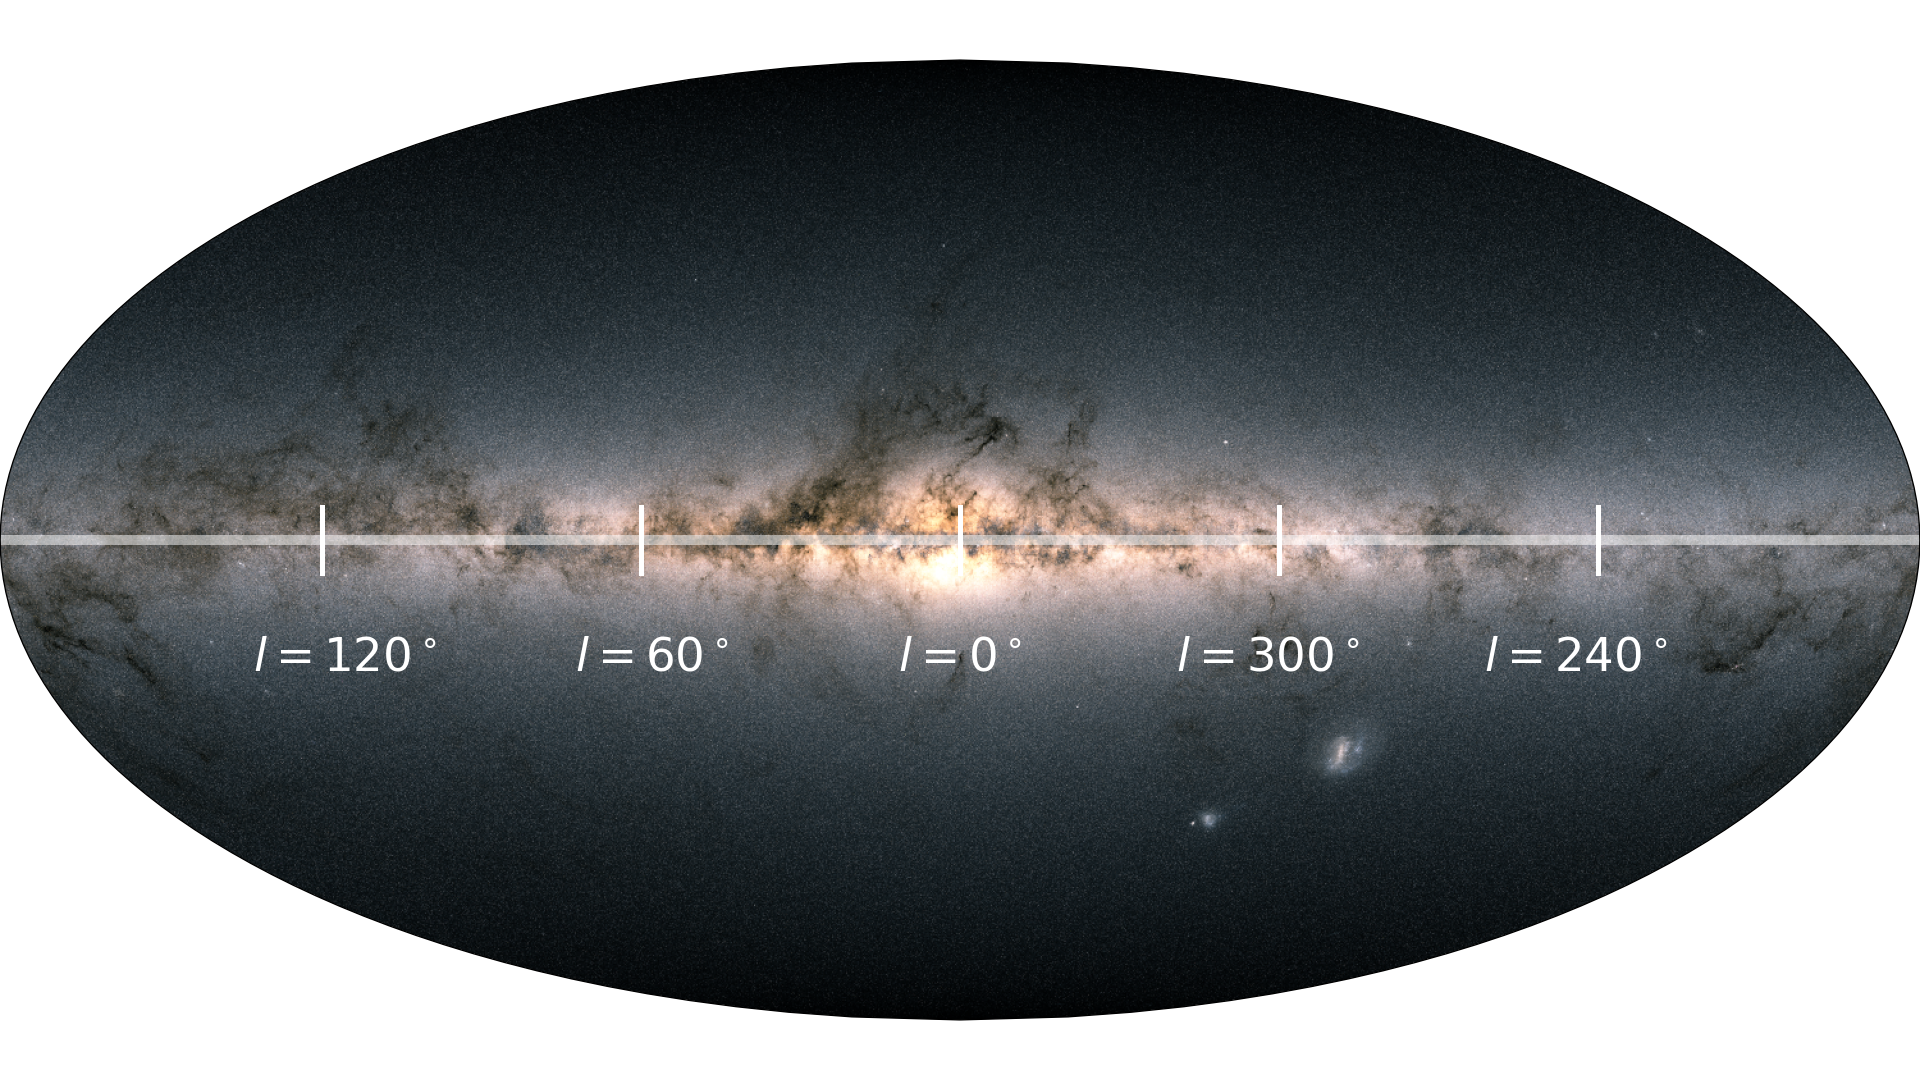
Figure 2: Colour map of the night sky with the Milky Way band and Galactic longitude directions highlighted. l=0° indicates the direction to the centre of ourgalaxy. Credits: ESA/Gaia/DPAC - CC BY-SA 3.0 IGO.
Gaia measures not only the positions of stars in the sky but also their motions, both across the sky, ‘proper motion’, and along the line of sight to the stars, ‘radial velocity’. The motions of stars have been studied since the 19th century in order to gain a better understanding of the galaxy we inhabit, the Milky Way. It was noted in the early 20th century by among others, the astronomers Oort and Lindblad, that when one plots the proper motions of the stars in the Galactic longitude direction (i.e. in the direction parallel to the line in the image above) the motions show a wavy pattern, with the proper motion values going up and down for stars at different longitudes. This is also very clearly seen in the figure below which shows the Gaia proper motions in Galactic longitude (μ) as a function of longitude for a sample of young B-type (hot and blue) stars in the disk of the Milky Way. This sample is described in the paper "Gaia Data Release 3: A Golden Sample of Astrophysical Parameters" by Gaia Collaboration, Creevey et al. (2022).
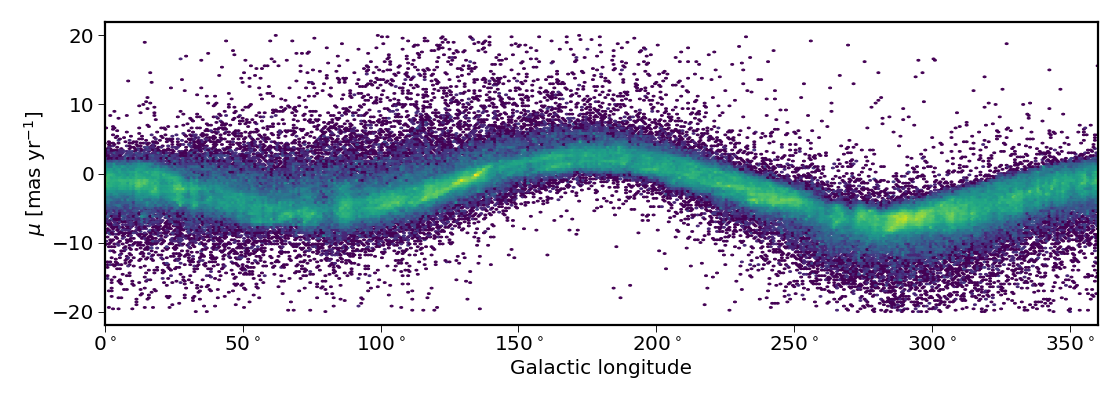
Figure 3. Proper motions along the Galactic longitude direction versus Galactic longitude for a sample of young B-type stars. Colours indicate the number of stars per interval of longitude and proper motion, with lighter colours indicating more stars. Credits: ESA/Gaia/DPAC - CC BY-SA 3.0 IGO.
Why do the stars’ proper motions show this wavy pattern? This is explained in the video below and in the text that follows.
Visualisation 1. This video explains the origin of the wavy pattern in the plot of proper motion versus Galactic longitude. Credits: ESA/Gaia/DPAC - CC BY-SA 3.0 IGO. Full acknowledgements for this video, see bottom of the page.
The rotation of the Milky Way disk
All stars in the Milky Way move along orbits around the centre of our galaxy (like planets in the solar system orbit the Sun), where the orbits are dictated by the collective gravitational force field of the stars, gas, and dark matter in the Galaxy. This results in a rotation of the Milky Way disk as a whole. This is schematically indicated in the image below, showing the position of the Sun in the Milky Way disk (as seen from above) and the sense of rotation of the disk as indicated by the arrow.
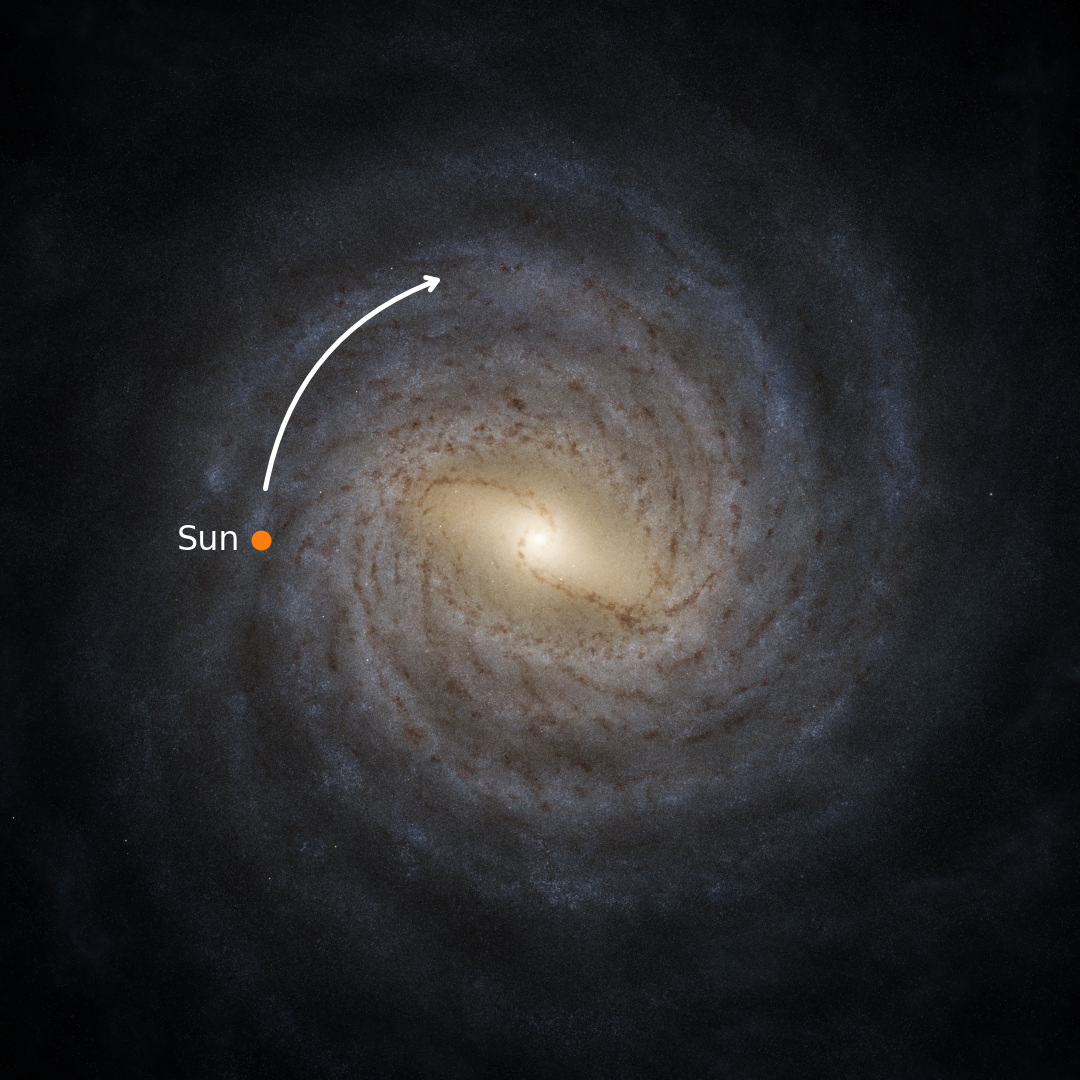
Figure 4. Artist’s impression of the Milky Way as seen from above the disk, with the position of the Sun indicated by the orange dot. The arrow shows the sense of rotation of the Milky Way disk. Credits: ESA/Gaia/DPAC - CC BY-SA 3.0 IGO, artist’s impression by Stefan Payne-Wardenaar/MPIA
The works by Oort, Lindblad, and others in the early 20th century hypothesised that the wavy pattern in the proper motions of the stars is a consequence of the specific way the disk rotates. As illustrated in the video, the Milky Way disk does not rotate like a solid object (for example a frisbee or discus spinning around its axis). Instead the stars in the Milky Way go around the centre at different speeds, completing an orbit faster near the centre and slower in the outer parts of the disk. This is called `differential rotation’. The effect is that stars orbiting closer to the Milky Way centre than the Sun, will ‘overtake’ the Sun over the course of time, while stars orbiting further out will lag behind the Sun in their orbits. The changing relative positions of the stars then lead to motions of stars across the sky.
The video includes a very simple model of the orbits of stars in the Milky Way disk to show what the value of their proper motion is as seen from the sun. This is indicated by a colour coding as shown in the still from the video below.
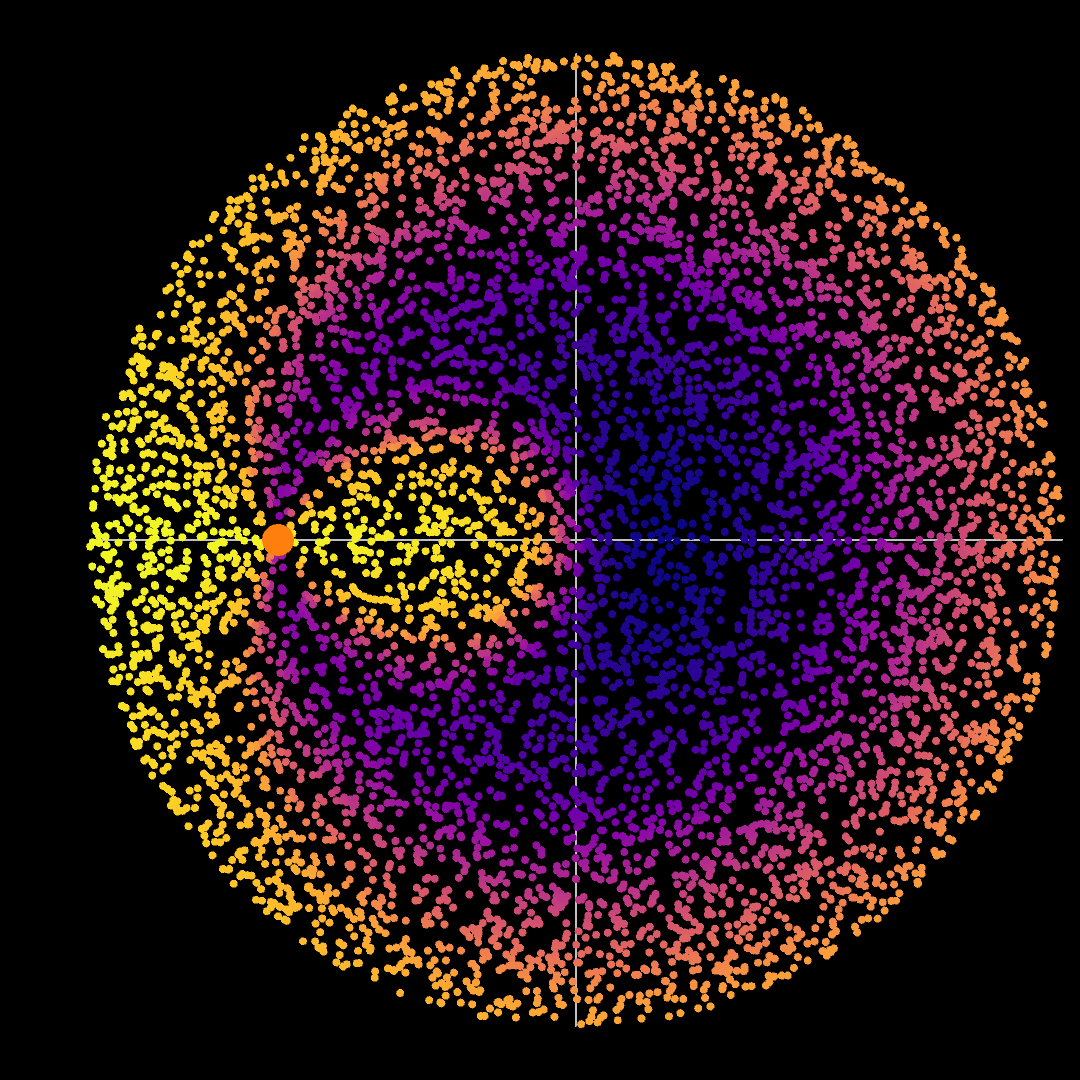
Figure 5. Model of stars in the Milky Way disk where the colour coding indicates the proper motions of the stars as seen from the Sun (orange dot). Credits: ESA/Gaia/DPAC - CC BY-SA 3.0 IGO.
If we now focus on a ring of stars around the Sun (next figure) we notice how the light and dark colours alternate along the ring. That is, the value of the proper motion varies periodically along the ring and the locations along the ring correspond to the directions to the stars (Galactic longitude).
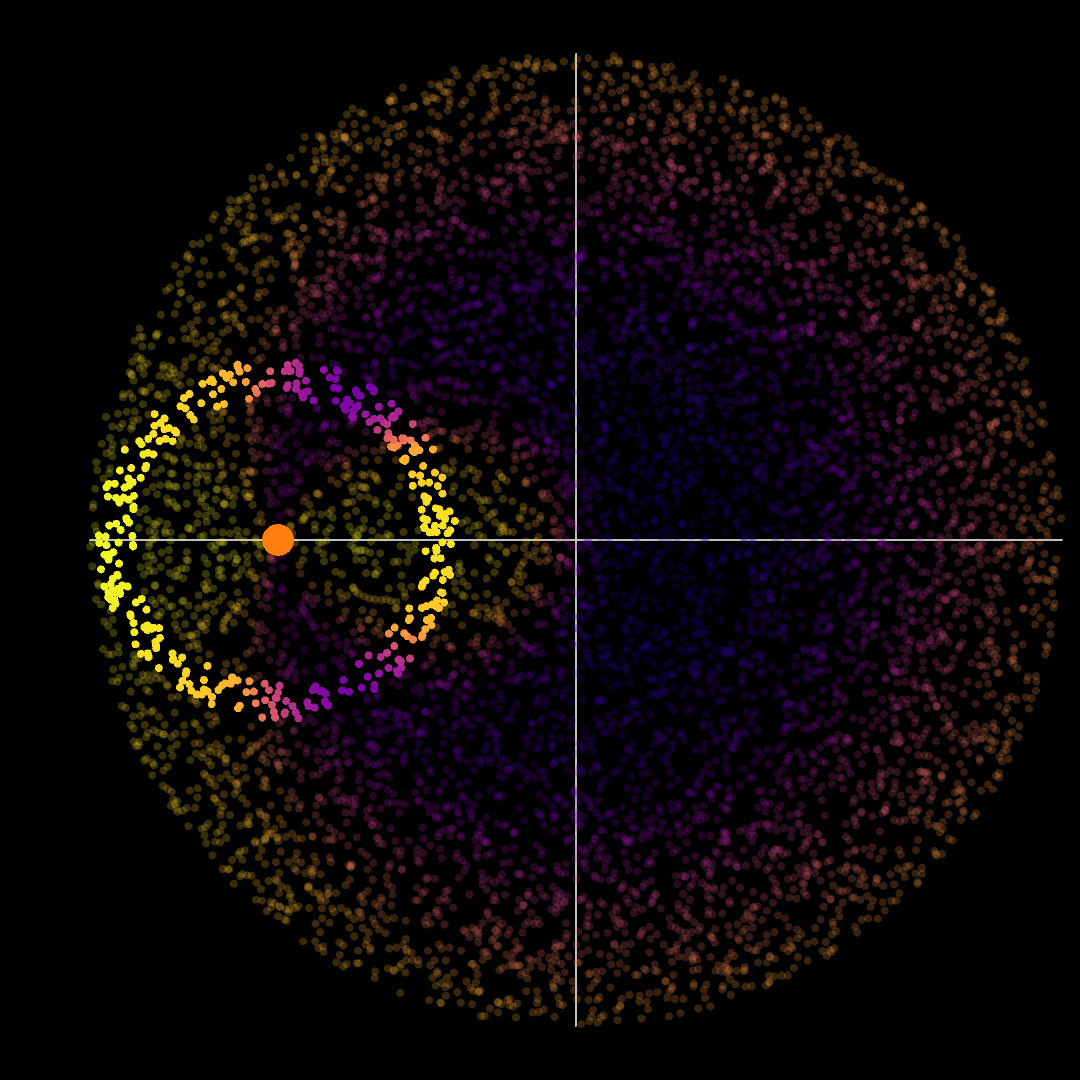
Figure 6. Model of stars in the Milky Way disk where the colour coding indicates the proper motions of the stars as seen from the Sun (orange dot). Here we focus on a ring of stars which are all located at more or less the same distance from the Sun. Notice how the colours (proper motions) change regularly along the ring, going from dark to light and back. Credits: ESA/Gaia/DPAC - CC BY-SA 3.0 IGO.
If we then plot the proper motions of the stars in this ring versus longitude (figure below) we see how the wavy pattern emerges from this simple model of the rotation of the Milky Way disk. You can compare this to the actual data shown in the image above.
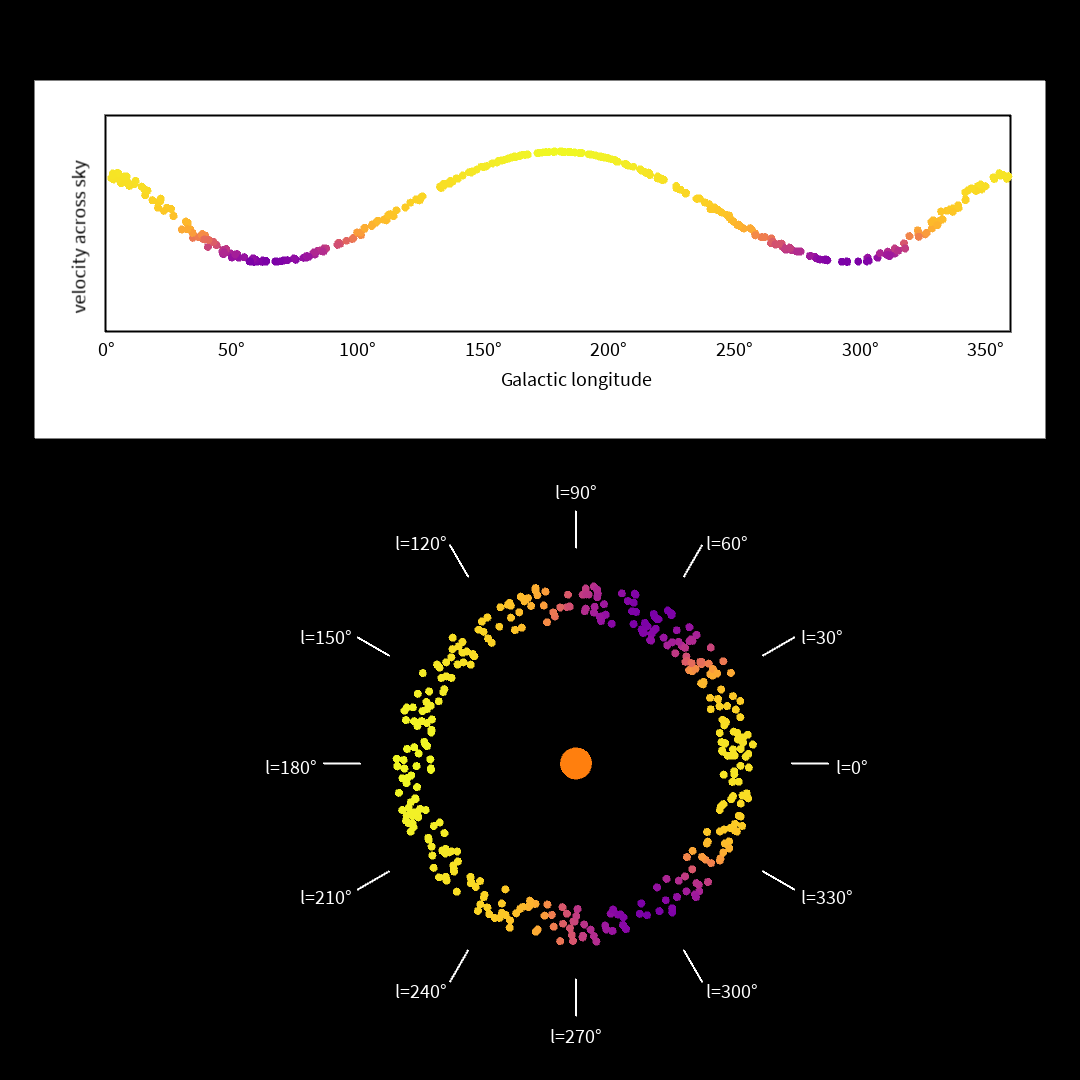
Figure 7. Directions to the stars (Galactic longitude) are indicated along the ring in the bottom half of this image. The top half shows a plot of the proper motion value vs Galactic longitude with the same colour coding. A clear wavy pattern results. Credits: ESA/Gaia/DPAC - CC BY-SA 3.0 IGO.
What do astronomers learn from this?
In the simple Milky Way models used in the video above the stars all go around the Milky Way disk in circles but with different speeds V which depend on the distance R from the star to the centre of the Milky Way. The plot below shows how the speed V varies with distance R. This is the so-called ‘rotation curve’ for the Milky Way disk.
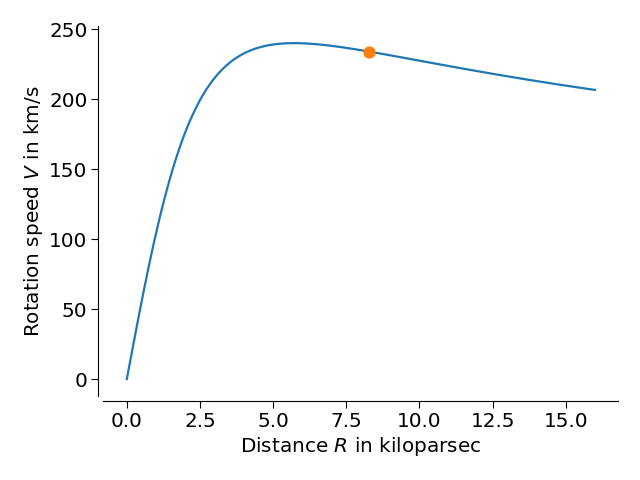
Figure 8. Rotation curve used for the Milky Way disk model in the video. The rotation speed at the location of the Sun is indicated with the orange dot. Credits: ESA/Gaia/DPAC - CC BY-SA 3.0 IGO.
Traditionally astronomers have analysed the wavy proper motion pattern for stars located relatively close to the Sun. This allows the derivation of the rotation speed at the location of the Sun and whether the rotation curve decreases in value (as in the above plot), stays flat, or increases in value. The shape of the rotation curve contains information on the amount of mass in the Milky Way within distance R. The shape as shown in the plot above is a very strong indication of the presence of dark matter. To explain the high speeds of the stars at large distances more matter is needed than can be accounted for by the visible stars, gas, and dust.
Why examine B-type stars?
The wavy pattern seen in the Gaia proper motions is shown for B-type stars above. These types of stars are hot, blue, and young (meaning up to about 100 million years old). These types of stars are often used to study the rotation curve because they have not yet developed the large random motions seen for older stars. The next plot shows an example of the proper motion versus longitude for G-type stars (stars like the sun, so billions of years old). Notice how the wavy pattern is still visible but much fuzzier due to the random motions of the G stars with respect to the average circular motions.
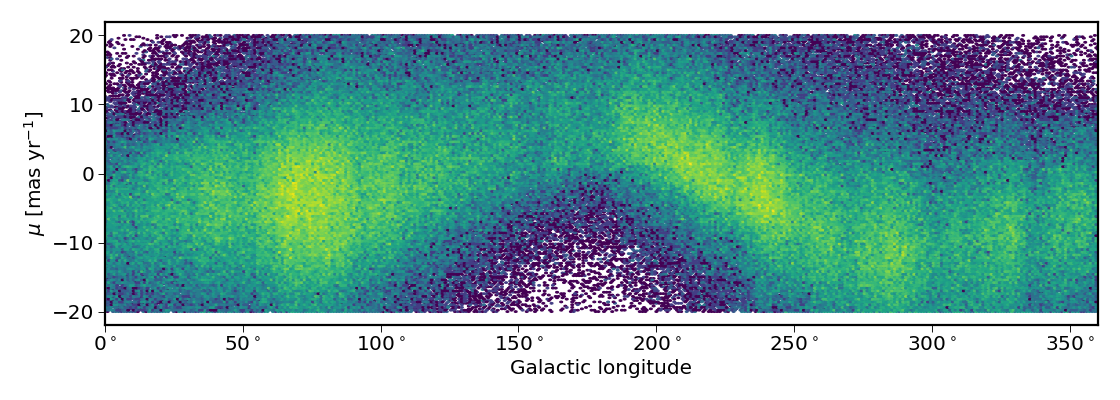
Figure 9. Proper motions along the Galactic longitude direction versus Galactic longitude for a sample of old G-type stars. Credits: ESA/Gaia/DPAC - CC BY-SA 3.0 IGO.
How Gaia changes the picture
With Gaia we now have access to precise proper motion, radial velocity, and parallax measurements over a much larger volume in the Milky Way disk. This makes it possible to directly measure the rotation curve for the stars by simply calculating their 3D positions and motions. Hence the analysis of the wavy pattern is not strictly needed anymore. This is illustrated beautifully in the paper "Gaia Data Release 3: Mapping the asymmetric disc of the Milky Way" by Gaia Collaboration, Drimmel, et al. (2022). The paper includes a figure showing a directly measured rotation curve for giant stars which can be seen over very large distances in the Milky Way. Averaging the 3D motions of many of these giants then reveals the rotation curve despite the large random motions (the giants are much older than B-type stars).
Alternative ways to measure the rotation curve
The space between the stars in the Milky Way disk is filled with tenuous gas clouds which also contain a fraction of dust. These gas clouds can be observed in radio wavelengths and they can be seen over the full extent of the Milky Way disk. The radio measurements provide the radial velocity of the gas clouds (but not the proper motions). Because the clouds also orbit around the Milky Way centre according to the rotation curve, the radial velocities will also show a wavy pattern. This can be used to measure the rotation curve from the motions of these gas clouds. This is illustrated in the paper "Gaia Data Release 3: Exploring and mapping the diffuse interstellar band at 862 nm" by Gaia Collaboration, Schultheis et al. (2022). In that work the motions of the molecules responsible for the so-called diffuse interstellar bands, and associated with the clouds, are measured from the spectra collected with Gaia’s RVS instrument. One of the figures in the paper shows the wavy pattern in the motions of the Diffuse Interstellar Band carrier.
For the stars one can also see the wavy pattern in the radial velocities and this is seen in the sky map that shows with a colour code the average radial velocity of the stars in each direction. One can clearly see the alternating colours reflecting the wavy pattern in radial velocities.
Technical details and video source code
The idea for the video was inspired by the work of Brunetti & Pfenniger (2010) who showed how to calculate in general how the motions of the stars in the Milky Way disk translate to observed proper motions (and radial velocities). The rotation curve used for the Milky Way disk animation, and shown above, is also taken from that paper (equation (7) with h = 3 kpc and p =− 0. 55).
The animation of the stellar motions in the disk was made with the Processing graphical library and Java code for colour coding the stars. The introductory slides for the video were made with Python, Matplotlib, and Cartopy. The video was generated with FFmpeg using a GNU Bash script.
The code to produce the video and to reproduce the analysis of the proper motions from Gaia Collaboration Creevey et al. (2020) can be found on Github.
Gaia's proper motions
The Gaia proper motions released with Gaia's Early Data Release 3 are also included in the full Gaia Data Release 3 published now.
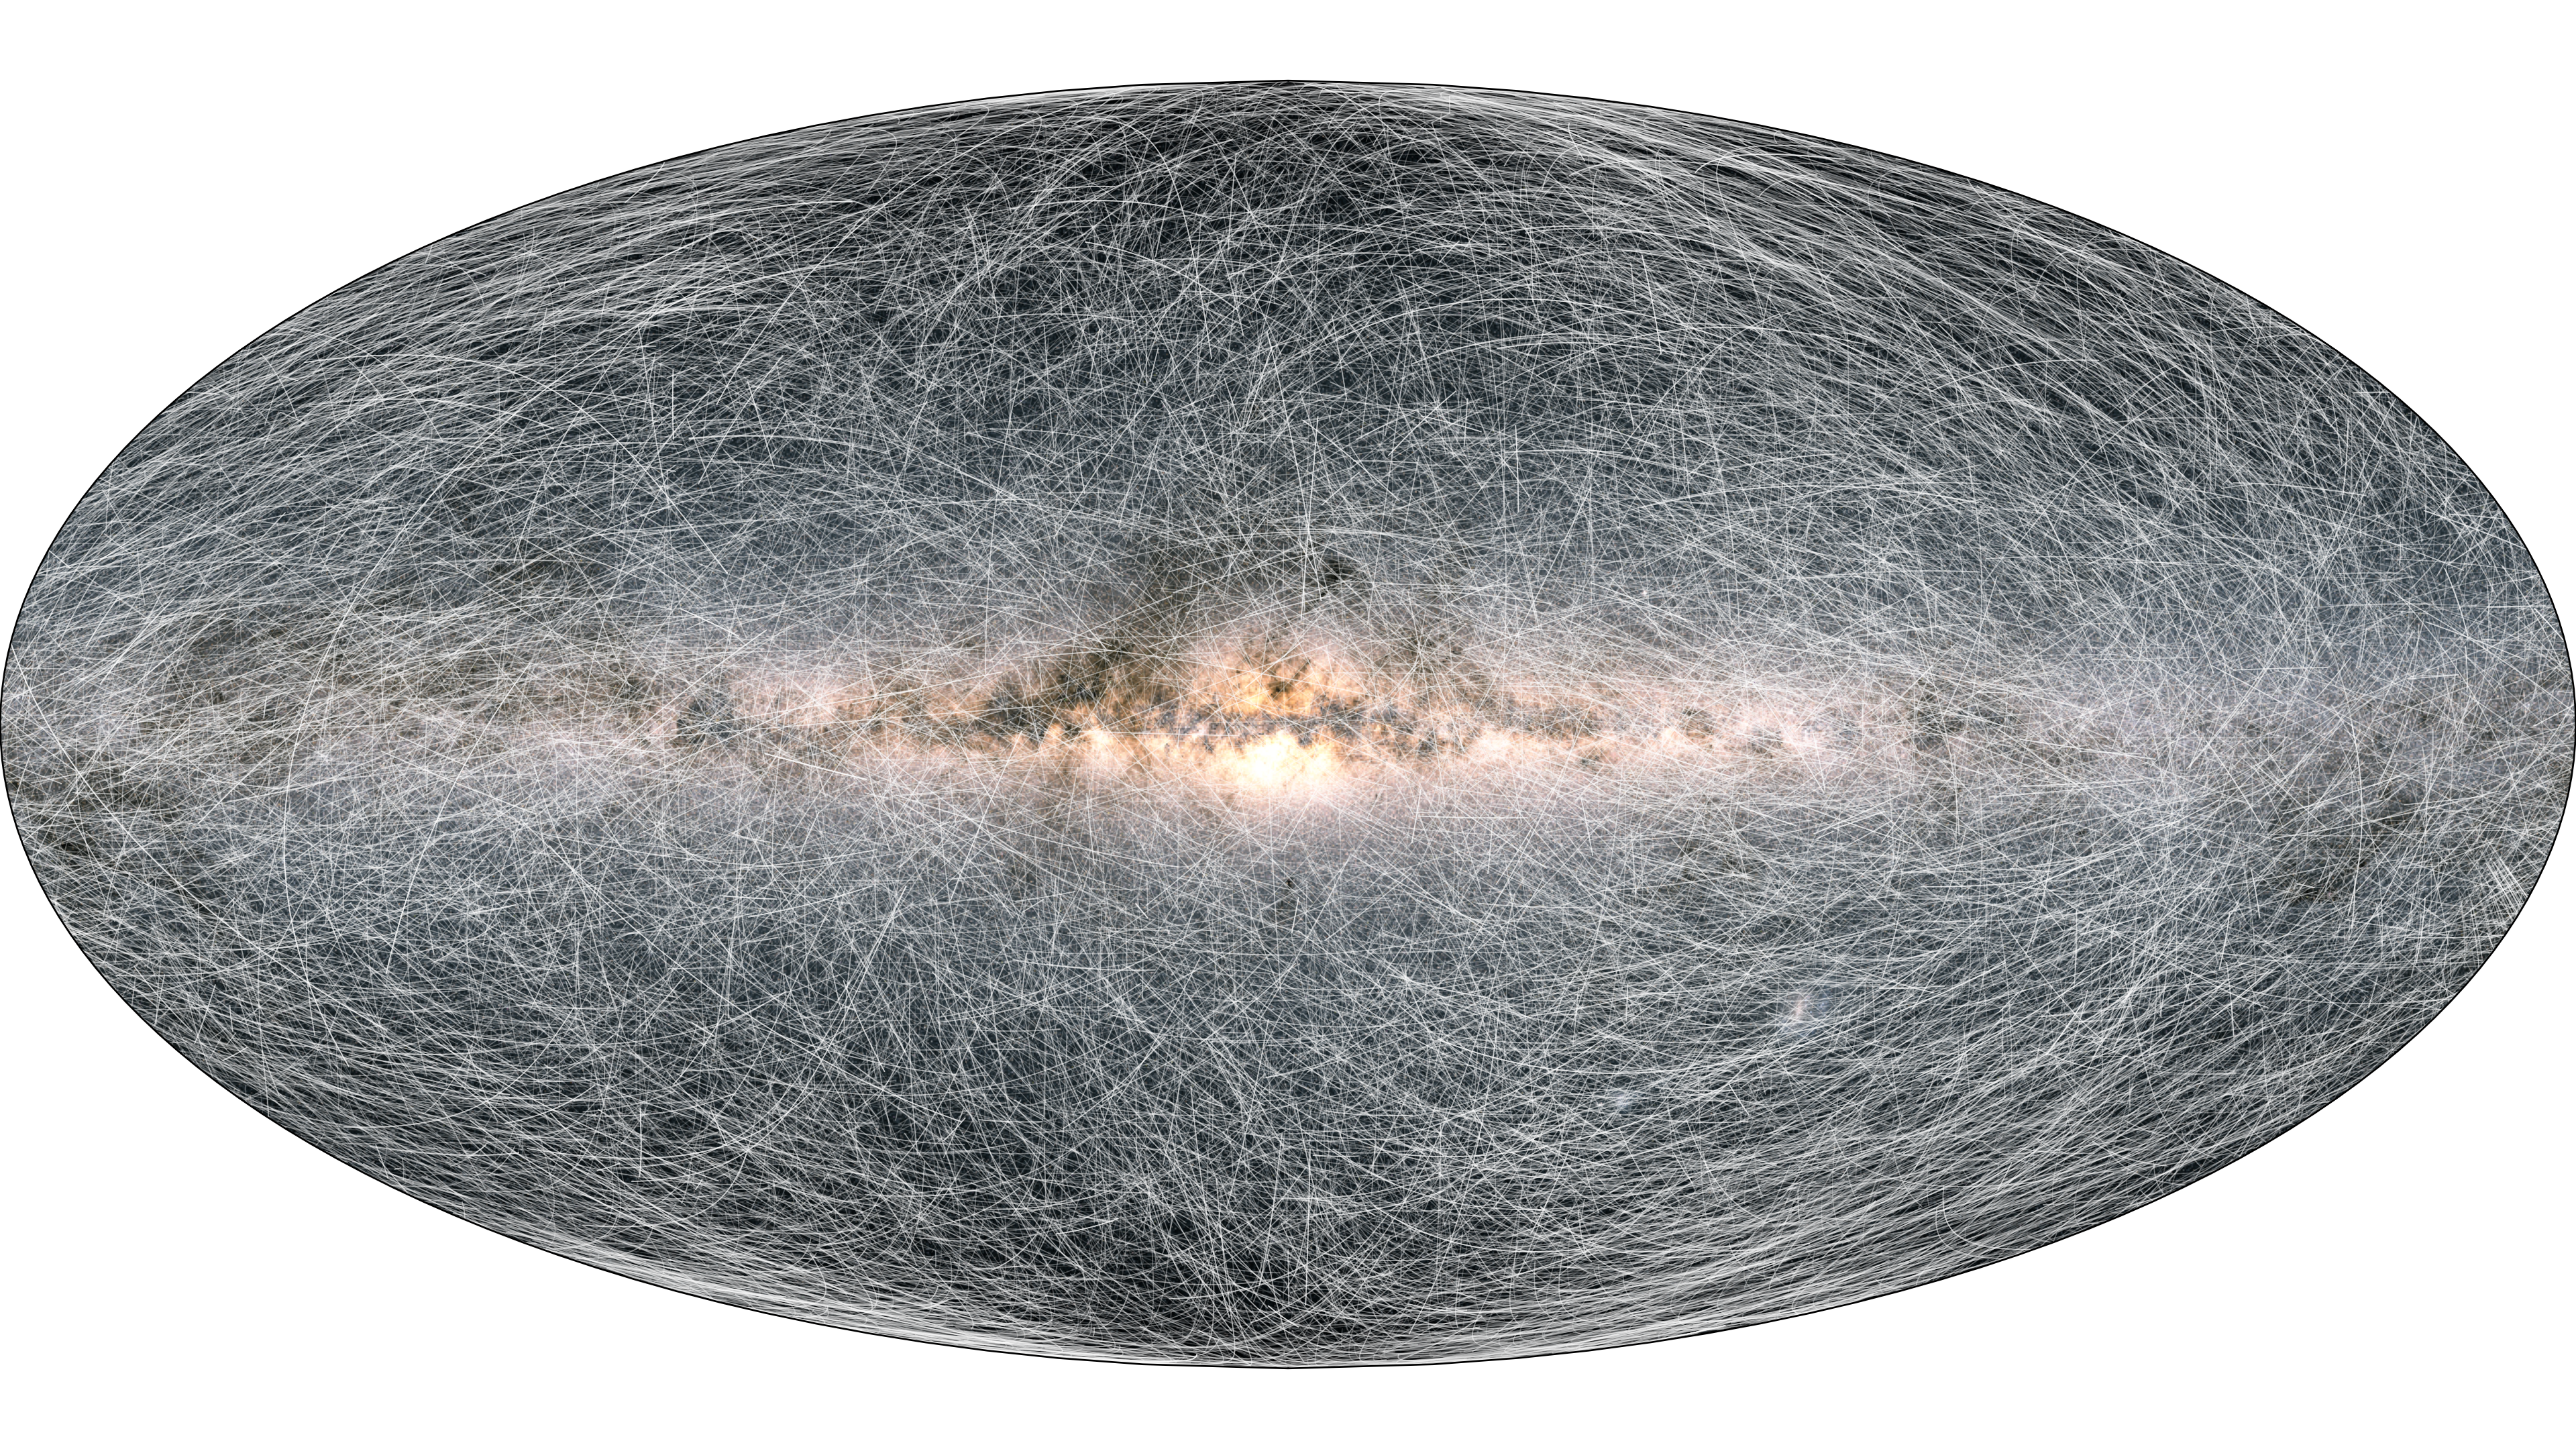
Sky map of star trails. The star trails on this image show the displacement of stars on the sky 400 thousand years into the future. (Good resolution image for download, High resolution image for download) Credit: ESA/Gaia/DPAC, CC BY-SA 3.0 IGO. Published here.
Credits: ESA/Gaia/DPAC, Anthony Brown, Yves Frémat, Orlagh Creevey, Rosanna Sordo, Céline Reylé, Tineke Roegiers, Milky Way artist’s impression: Stefan Payne Wardenaar
Acknowledgements for the video:
- Based on the paper by the Gaia Collaboration: Gaia Data Release 3: A Golden Sample of Astrophysical Parameters
- Main Video/Data sets: ESA/Gaia/DPAC, Anthony Brown, Yves Frémat, Orlagh Creevey, Rosanna Sordo, Céline Reylé, Tineke Roegiers
- Narrator: Orlagh Creevey * Ideas for video inspired by: Brunetti & Pfenniger, 2010, A&A 510, A34
- Night sky image: ESA/Gaia/DPAC/André Moitinho, CC BY-SA 3.0 IGO
- Milky Way image: Stefan Payne-Wardenaar
- The video was created with Processing, Python/Matplotlib/Cartopy, FFmpeg, and GNU Bash
- Code for this video can be found here
Published: 13 June 2022
- Removed a total of (23) style text-align:center;
- Removed a total of (22) style text-align:justify;
- Removed a total of (1) style margin:0;
More Gaia DR3 stories?
Where are the stars? How far away are they? How bright are the stars?
What colour do they have? What are the stars made of?
Where do they go? Where do they come from? Do they approach us? Do they move away?
Did something move in front of the star? What is in between the stars?
How big, warm, old, ... are they? How do they Blink?
Is it a double star? Do they go boom? Is it a galaxy?
Is it a solar system object? Is it a quasar?
Who created the data? Can I Use Gaia data with other observatories?
How did DPAC produce the data for this star? Where is the data?
-
ESA's press release of Gaia Data Release 3
-
Gaia's Early Data Release 3 stories
-
ESA's press release of Gaia Early Data Release 3
- Removed a total of (16) style text-align:center;
- Removed a total of (1) style float:right;