
 Sign in
How big or warm or old are the stars? - Gaia
How big, warm, old, ... are the stars?
Gaia's Stellar parameters
Apart from pinpointing where the stars are, measuring where they go to, or determining if something is blocking part of its light (like exoplanets or dust), Gaia provides a huge amount of data on the stars’ properties themselves like their age, radius or temperature.
In Gaia Data Release 3 there are 470 million stellar temperatures, gravities, and sizes, 230 million measures of their spectral features, 130 million stellar masses and ages, among many other stellar properties which were produced by Gaia’s Coordination Unit 8 (Creevey et al. 2022, Fouesneau et al. 2022, Andrae et al. 2022, Recio-Blanco et al. 2022, Lanzafame et al. 2022).
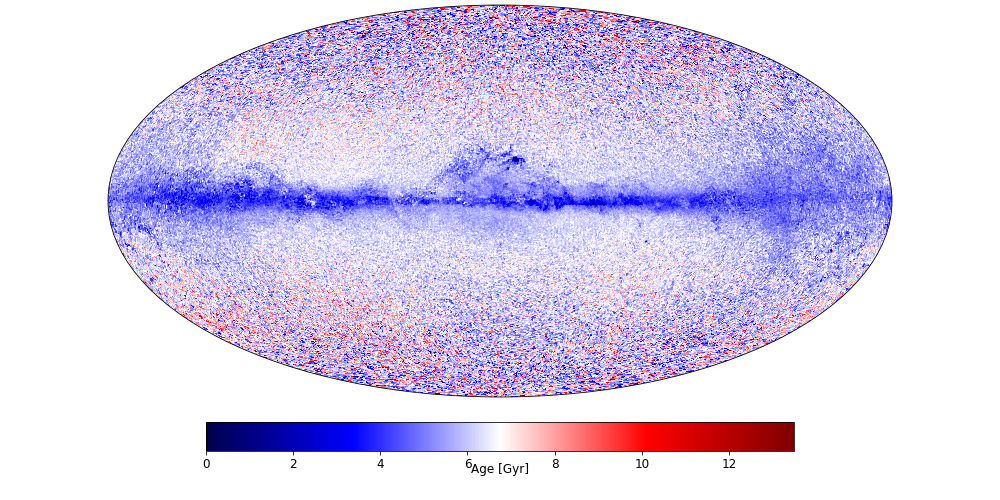
Figure 1. Sky map of stellar age obtained for Gaia Data Release 3, showing the average age of the stars in our Galaxy, with blue representing the younger stars and red representing the older stars. Most of the oldest stars are found outside the galactic disk. The age was derived with the Final Luminosity Age Mass Estimator (FLAME). Shown in this map is a random selection of 10 million stars from Gaia DR3. Credits: ESA/Gaia/DPAC - CC BY-SA 3.0 IGO. Acknowledgements: created by O.Creevey, M. Fouesneau, and the Gaia group at MPIA.
The paper “Gaia Data Release 3: A Golden Sample of Astrophysical Parameters” by the Gaia Collaboration, Creevey, O.L., et al. exploits this rich dataset of astrophysical parameters and makes some very high quality selections of various types of stars, from young hot massive stars all the way down to the ultra-cool very low-mass substellar objects. Figure 2 illustrates where these stars reside in the Hertzsprung-Russell diagram, (this could also be referred to as the Cannon-Maury diagram, see footnote*), a diagram that helps us to understand how stellar properties change as the star ages.
The exploitation of these carefully selected datasets promises a better understanding of the dynamics and evolution of our Galaxy, of the enrichment of our interstellar medium, of our own Sun and the solar system, and of the defining limits of ‘real’ and ‘failed’ stars. We illustrate some of these possibilities in the rest of this article.
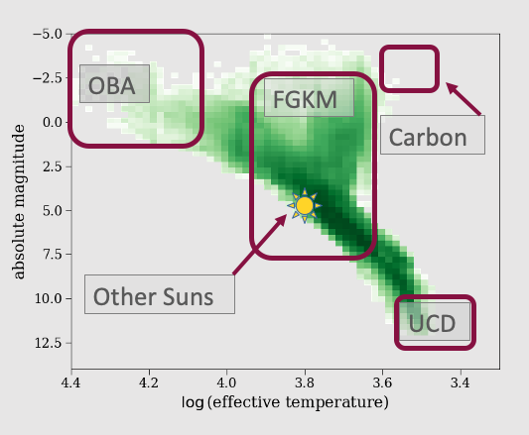
Figure 2. Hertzsprung-Russell diagram with young massive star sample (OBA), intermediate mass sample (FGKM), low-mass ultra-cool dwarfs (UCD), evolved carbon-rich stars and solar analogues. Credits: ESA/Gaia/DPAC - CC BY-SA 3.0 IGO, based on Gaia Collaboration, Creevey, et al. 2022.
Young massive stars
The young disk star (OBA) sample is great to trace the recent star formation events and spiral arm structure in our Milky Way. As they are young they have not yet moved very far from their star-forming regions. These stars also nicely trace the differential rotation of the Milky Way as described in the story on Wavy proper motion patterns and the rotation of the Milky Way disk.
Intermediate to low mass stars
The sample containing intermediate to low mass stars (FGKM) are an interesting data set for the upcoming ESA Plato mission, which aims to identify and characterize Earth-like extrasolar planets by searching around these types of stars. Our Sun is part of this sample and its location in this diagram is indicated in Figure 1. The Golden Sample of FGKM stars makes a selection of about 3 million stars based on the highest quality of various Gaia data products, and results in a very clean temperature – luminosity diagram. The animation below shows a part of the process of the selection of this high-quality sample.
Stars known as F, G, K, and M spectral types are low-mass stars, like our Sun (type G). They live for many billions of years and so they are used by astronomers to study the formation and evolution history of our galaxy, the Milky Way. This animation shows the process of selecting stars from the full Gaia Data Release 3 (DR3) in order to define a very high quality sample. We show what is known as the Hertzsprung-Russell diagram, which represents the intrinsic brightness and colour of stars but converted into the physical quantities of the stars (luminosity and effective temperature) by the data processing in Gaia DR3. Credits: ESA/Gaia/DPAC. The images in this animation are adapted from those presented in Gaia Collaboration, Creevey et al. 2022, "Gaia data release 3: A Golden Sample of Astrophysical Parameters" - CC BY-SA 3.0 IGO. Acknowledgements: This animation was produced by Orlagh Creevey, Rosanna Sordo, Celine Reylé, and Olga Suarez.
Converting from the observed to the physical stellar quantities is not straightforward as it requires precise knowledge of the distances and interstellar extinction, and the ability to disentangle these and other properties from the Gaia spectra.
It is very important, however, to get it right: measuring the chemical composition of the star requires that the temperature is known with high precision. Likewise, measuring a precise age of a star requires that both the temperature and luminosity are accurately measured. Knowing the age and chemical composition for many stars allows us to study the past history of the Milky Way, referred to as Galactic archaeology. In other words, sharp features in the diagram presented in the animation above equates to a better understanding of our Milky Way.
The resulting high-quality sample was also used to derive a homogenous set of properties of some known extrasolar planets orbiting these stars. These results are described in more detail in the story on exoplanets in Gaia DR3.
Life of a star on the HR diagram
An interactive version of this animation is available below. Credits: ESA/Gaia/DPAC - CC BY-SA 3.0 IGO. Acknowledgements: This animation was produced by Laurent Rohrbasser, Krzysztof Nienartowicz, in collaboration with Orlagh Creevey, Laurent Eyer, Celine Reylé.
INTERACTIVE VERSION - ACCESS HERE
The above animation illustrates how the physical characteristics of the stars – temperature and luminosity – are derived from Gaia observations, using the FGKM sample of stars. We then make a selection of 1-solar-mass stars with a chemical composition very similar to the Sun. These stars form an ‘evolution sequence’ in the HR diagram, and inform us how the temperature, luminosity, and radius change as the star gets older.
We first show the distribution of the sample on the sky. Then the stars are organized by using their Gaia observations of observed magnitude (phot_g_mean_mag) and colour (bp_rp, see footnote**). Then, the distance information is used (parallax) to transform the observed magnitude into the standard absolute system used in astronomy i.e. the brightness that an object would have if it were placed 10 parsecs away. The colour information is then corrected for the “colour excess” e(bp – rp) due to dust between us and the stars, and the intrinsic luminosity (lum_flame) is then determined by also considering the interstellar medium dust and the contribution of the light that Gaia does not see – this latter is known as the bolometric correction. Finally, the intrinsic colour is transformed to temperature (teff_gspphot).
The set of 1-solar-mass stars with the same chemical composition of the Sun are then highlighted in orange. This sequence describes most of the lifetime of a star and also represents the past, present, and future Sun. The evolution sequence illustrates where the Sun would be at its current age of 4.57 billion years, if it were observed by Gaia. Then one can see how the stars' temperatures and luminosities vary depending on their age. Our Sun will reach a maximum temperature at approximately 8 billion years of age, then it will cool down and move right along this diagram while also slowly increasing in size. It reaches the base of the red giant branch, an almost vertical sequence, at around 10-11 billion years of age, and then rapidly moves up this vertical sequence while also increasing significantly in size. The end of the life of the Sun will happen a short time after it leaves the giant branch, it will pass rapidly through some other regions of the diagram (see for example Carbon stars below) and then it will eventually cool down, and fade as a dim white dwarf.
Solar analogues
Another interesting subsample of the intermediate mass stars are those which have similar properties to our Sun, including their sizes and temperatures. These are known as solar analogues. Gaia Data Release 3 brings more than a 10-fold increase with respect to the currently known sample. A list of 5863 stars with temperatures, surface gravities, metallicities, masses and radii that are consistent with the Sun are proposed to the community.
The plot in Figure 3 shows the Gaia DR3 RVS spectra of 1046 of these solar analogues (the subsample with published RVS spectra). The solid black line shows the median flux. The outer grey contour includes 90% of the 1046 solar analogues, while the inner grey contour includes 68% of them. Their RVS spectra are very similar to each other, resulting in narrow grey contours. Stars very different from the Sun would show very different RVS spectra. The most prominent absorption lines are marked with vertical dashed lines (calcium in cyan, iron in red, silicon in orange, according to Table B.1 in Recio-Blanco et al. 2022).
More on solar analogues in reference to dust can be found in the story on “what colour are the stars”.
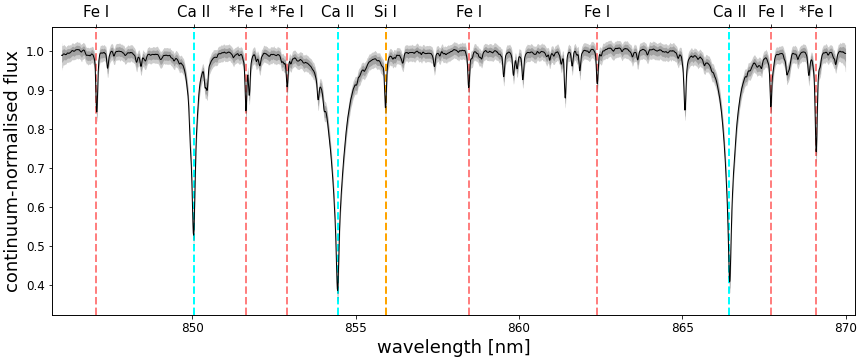
Figure 3: The Gaia DR3 RVS spectra of 1046 solar analogues. Outer grey contour includes 90% of the sample. Inner grey contour contains 68% of the sample. The most prominent absorption lines are marked with vertical dashed lines. Credits: ESA/Gaia/DPAC - CC BY-SA 3.0 IGO. The image is adapted from the one presented in Gaia Collaboration, Creevey et al. 2022. Acknowledgements: Rene Andrae, Andreas Korn, Orlagh Creevey, Georges Kordopatis, Rosanna Sordo.
Ultra-cool dwarfs
Ultra-cool dwarfs (UCDs) are very faint objects and often cannot be seen by Gaia (they are observable in the infrared). However, Gaia may be able to determine information on these stars even though it cannot observe them. This can happen if the UCD is in a binary system with a brighter star that has been observed with Gaia. We can check this by looking at the motion of the star. The presence of unseen UCDs would be revealed by tiny deviations from the expected motion. Gaia has a dedicated pipeline to process multiple-star systems and derive properties for them, as fully explained in this story.
Let’s have a closer look at 11 ultra-cool dwarfs orbiting a star seen by Gaia. Although Gaia does not observe these ultra-cool dwarfs, information can be deduced from the stars they orbit. The age of the seen companion star is used to age-date the UCD, because in binary systems the stars are born at the same time! In figure 4, the luminosities and ages of these 11 UCDs are shown, along with some theoretical models of different masses (colours). The ages derived in Gaia DR3 are then used to estimate the mass of the UCD. Now one can see more clearly which UCDs are very close to the transition zone between ‘real’ and ‘failed’ stars. These are the objects that fall near the dashed lines.
This technique reveals properties of stars never seen by Gaia. This is an precious discovery ready to be exploited by the community.
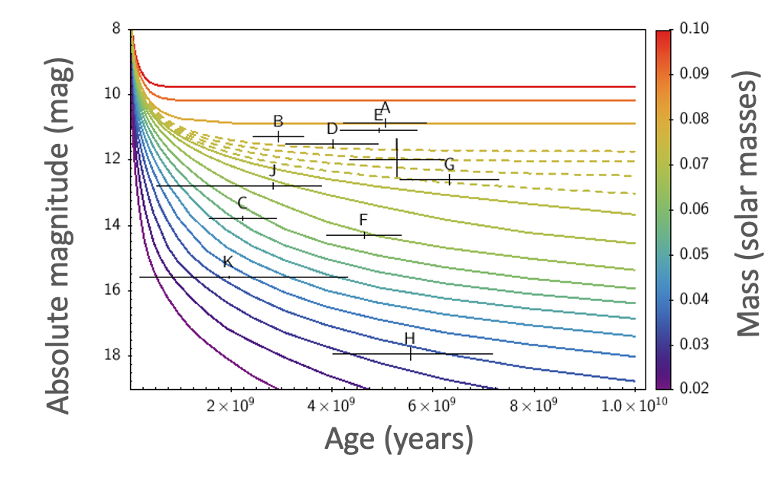
Figure 4 The luminosity and age of the unseen ultra-cool dwarfs in binary systems. Their ages are constrained by the bright companion star that is seen by Gaia. The age and luminosity allows us to estimate their masses, and we can now identify the low mass objects which are close to the transition zone of failed stars. Credits: ESA/Gaia/DPAC - CC BY-SA 3.0 IGO, based on the paper Gaia Collaboration, Creevey, et al. 2022.
Gaia does, however, also observe some ultra-cool dwarfs, but at the faint end of what it can see. In the figure below a data set of these ultra-cool dwarfs in the Gaia DR3 Golden Sample of Astrophysical Parameters is shown. They are organized by temperature and size. The temperature was obtained from Gaia processing while the size was derived by combining Gaia data with infrared data from other observatories. Between 1900 and 1500 Kelvin, the sizes of the ultra-cool dwarfs seem to increase when the temperature decreases. This was already suggested in literature in the past, and is confirmed by Gaia DR3.
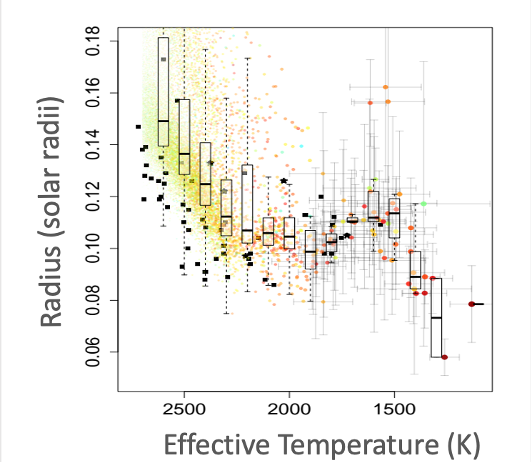
Figure 5: Ultra-cool dwarfs in the Gaia DR3 Golden Sample of Astrophysical Parameters, organized by temperature and size. Credits: ESA/Gaia/DPAC - CC BY-SA 3.0 IGO, based on Gaia Collaboration, Creevey, et al. 2022.
Carbon stars
When stars having 1 to 8 Solar masses evolve away from the main sequence having fused all their hydrogen core to helium, they first collapse to heat up their inner layers and start the nuclear reactions in the outer layers. They expand and their luminosity increases while hydrogen is burning in shells. Gradually the pressure and temperature in the core reach a point enabling the helium ashes to fuse into carbon, and they become red giants. These stars may then experience multiple phases of contraction/expansion to ignite new reactions in their interior and cross multiple times the same part of the HRD to reach the asymptotic giant branch (AGB).
The AGB phase is an important key to the understanding of stellar evolution and nucleosynthesis in this particular mass range. AGB stars are the progenitors of planetary nebulae, of white dwarfs, and contribute to the chemical enrichment of the interstellar medium. As a consequence of their nuclear history, they are mainly made of carbon, oxygen, helium, and hydrogen, and form a population with a diverse range of chemical "anomalies". Some AGB stars have more carbon than other M giants, and exhibit strong molecular features made of carbon such as C2 or CN. The profile of these features are nicely seen in the BP/RP spectra and the RVS spectra.
In Gaia Data Release 3, we identify 386936 BP/RP spectra that present some common features with the spectra of observed known carbon stars. We found that a small fraction of these “candidate carbon stars” show significant features belonging to carbon-based molecules (i.e. C2 and CN). A new sample of 15740 bone fide carbon stars were identified in this way. Their distribution in the sky is shown in Figure 6. Noteworthy is the small feature in the map that we can attribute to the Sagittarius Stream, and which results from the tidal interaction of the Milky Way and the Sagittarian dwarf spheroidal Galaxy. Carbon stars are indeed often used as tracers to study the complex structure of the stream.
This same effect is also very beautifully seen in the sky map of Gaia DR3 radial velocities.
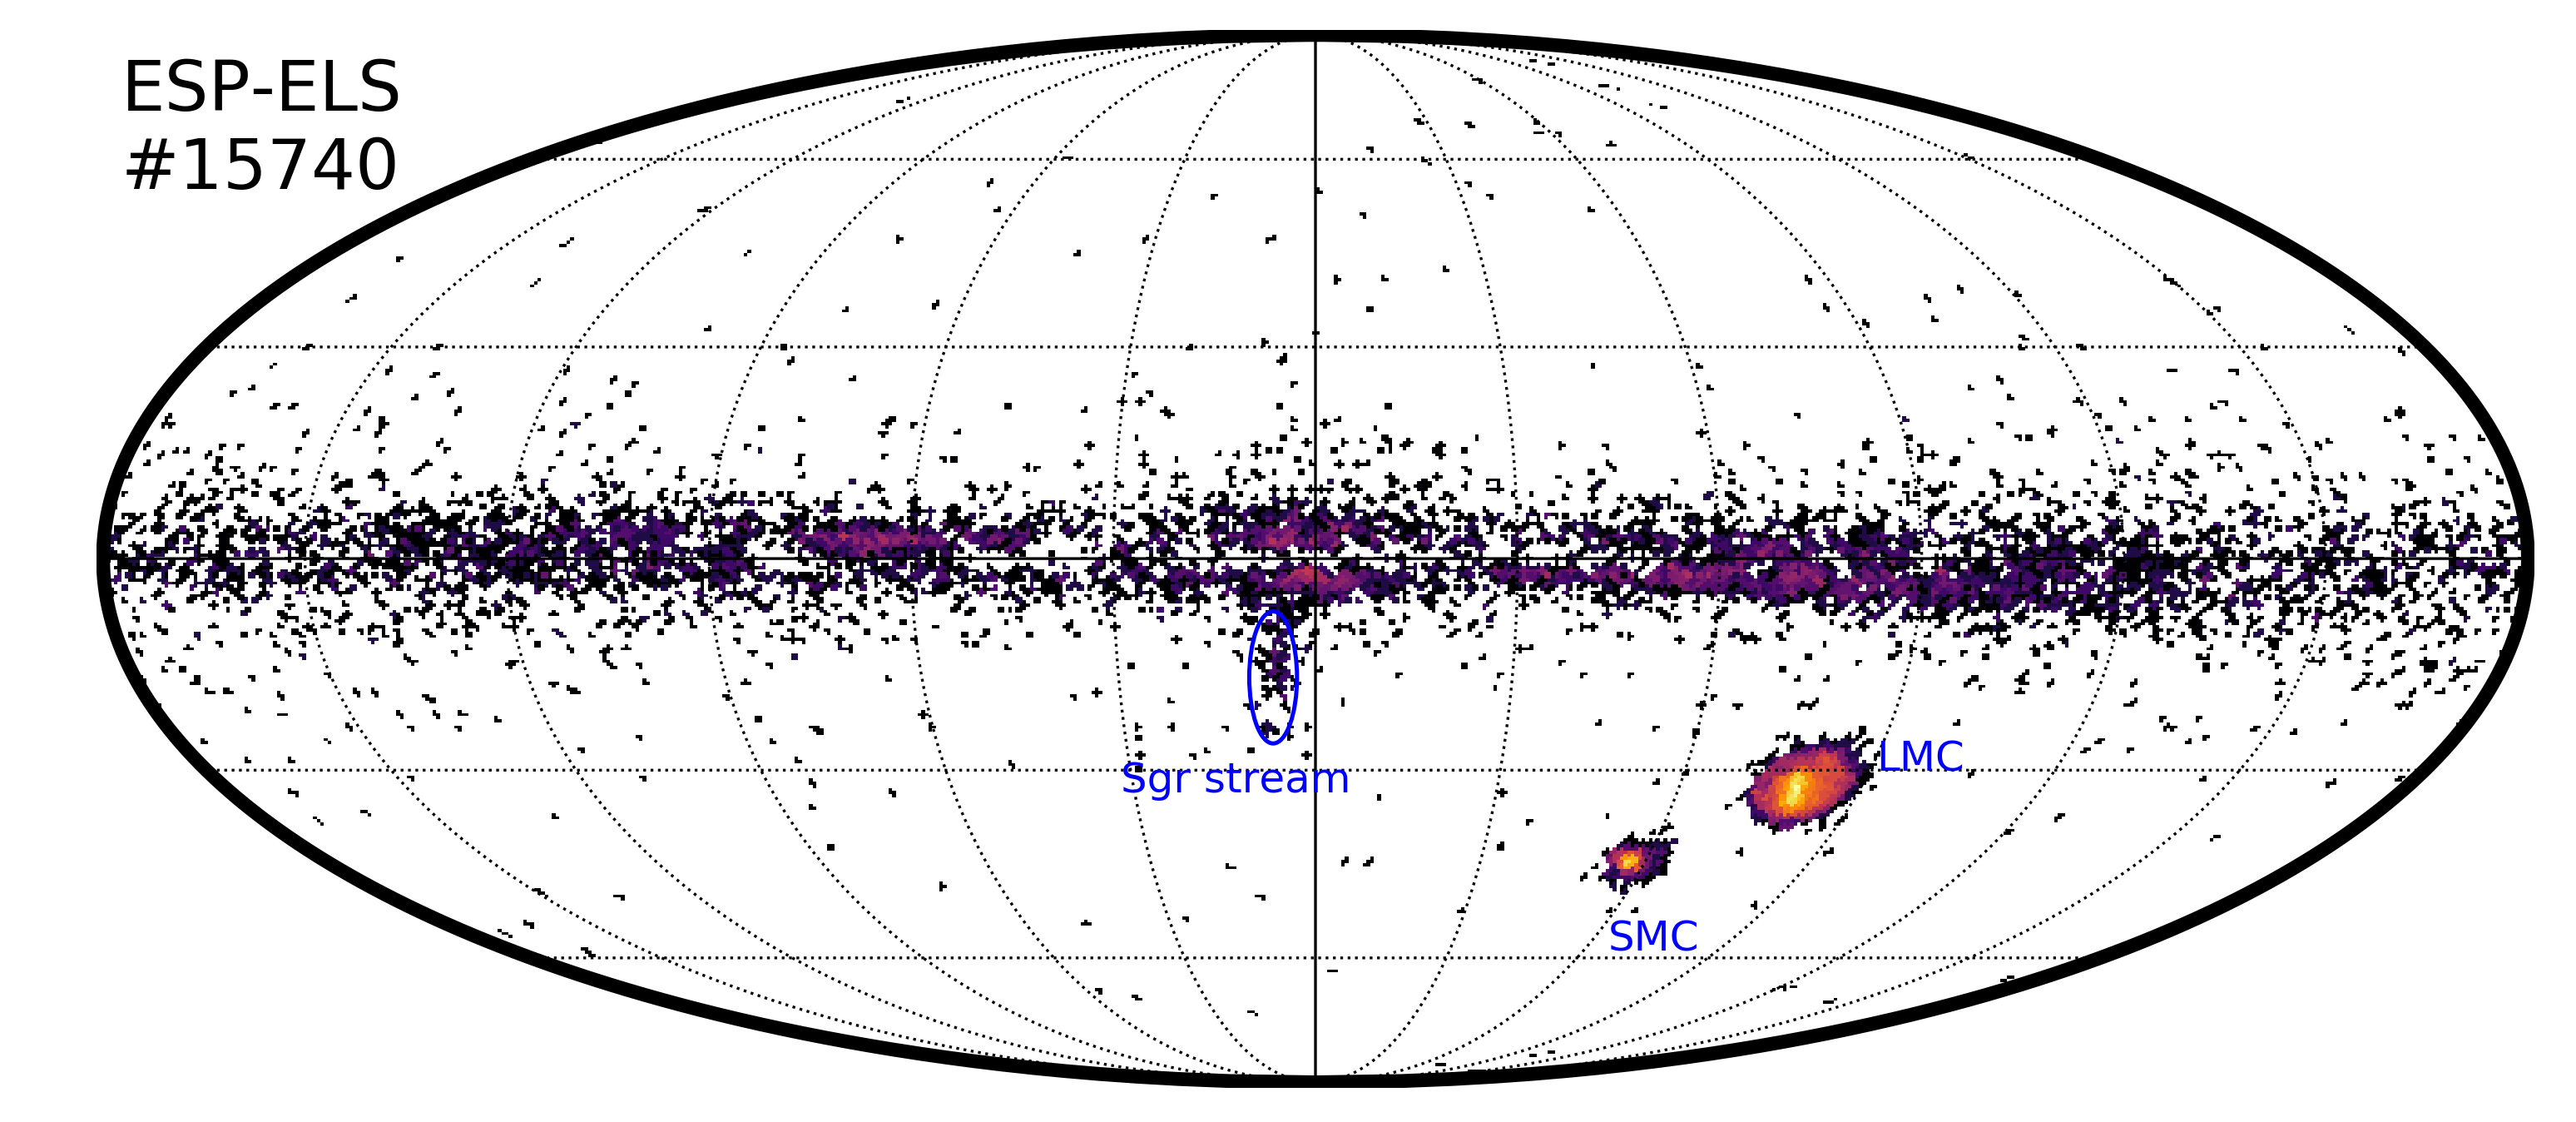
Figure 6. Sky map of the carbon star sample from the Gaia DR3 golden sample of astrophysical parameters. Credits: ESA/Gaia/DPAC – CC BY-SA 3.0 IGO., image from the paper by the Gaia Collaboration, Creevey, et al. 2022.
(*) These women astronomers were the first to classify stars by spectral types (temperature) and luminosity (or equivalently absolute magnitude) at the end of the XIX and XX century, but their achievements were mostly unrecognised. Annie Jump Cannon proposed the classification of stellar spectra in spectral types, accounting for their temperatures (x-axis). Antonia Maury proposed a classification taking into account also the luminosity of the stars (y-axis). The diagram is now most often referred to as the Hertzsprung-Russell diagram.
(**) bp_rp is obtained from phot_bp_mean_mag - phot_rp_mean_mag
Credits: ESA/Gaia/DPAC
Story written by: Tineke Roegiers, Orlagh Creevey, Yves Fremat, Anthony Brown, Céline Reylé, Ricky Smart, and Luis Sarro.
Published: 13 june 2022
- Removed a total of (20) style text-align:center;
- Removed a total of (24) style text-align:justify;
More Gaia DR3 stories?
Where are the stars? How far away are they? How bright are the stars?
What colour do they have? What are the stars made of?
Where do they go? Where do they come from? Do they approach us? Do they move away?
Did something move in front of the star? What is in between the stars?
How big, warm, old, ... are they? How do they Blink?
Is it a double star? Do they go boom? Is it a galaxy?
Is it a solar system object? Is it a quasar?
Who created the data? Can I Use Gaia data with other observatories?
How did DPAC produce the data for this star? Where is the data?
-
ESA's press release of Gaia Data Release 3
-
Gaia's Early Data Release 3 stories
-
ESA's press release of Gaia Early Data Release 3
- Removed a total of (16) style text-align:center;
- Removed a total of (1) style float:right;