
 Sign in
What is in between the stars? - Gaia
What is in between the stars?
Gaia's view on dust and the interstellar medium
The space between the stars is not empty but mostly filled with dust and gas that we call the interstellar medium (ISM). When starlight travels through a dust cloud, some of the light is scattered, and thus the star will appear a little dimmer than without the dust, an effect known as extinction. For light at different wavelengths measured by Gaia, so for the different observed colors, the effect varies: light at shorter wavelengths (towards the blue end of the spectrum) is scattered more strongly than those at longer wavelengths (red end of the spectrum). This characteristic wavelength-dependence allows astronomers to reconstruct the amount of the extinction starlight has undergone, which relates to how much dust and gas happens to be between us and that star.
However, Gaia can only inform us about the total extinction along the line of sight to a star, but cannot say where the dust is along this path. Is there a cloud close to Gaia, closer to the star, or multiple clouds at various locations instead? To answer this question, we would have to combine information from different distances along a given line of sight while combining many extinction measures in different directions; only then a three-dimensional map of extinction in the Milky Way could be constructed.

Figure 1. This animation shows the impact of interstellar dust along the line of sight onto the Gaia DR3 low-resolution BP/RP spectra of Solar-like stars. These stars have been selected to have temperatures, surface gravities, metallicities, masses and radii that are consistent with the Sun (see Sect. 7 in Creevey et al. 2022). The interstellar dust attenuates the BP/RP spectra, leading to a reduced flux received by the telescope onboard the Gaia satellite. In simple words, the stars get dimmed by the interstellar dust. The impact of the dust attenuation is not the same for all wavelengths. Rather, shorter wavelengths (corresponding to blue light) are attenuated more strongly than longer wavelengths (corresponding to red light). Again, in simple words, the stars not only get dimmed but also reddened by the interstellar dust. The left panel shows the BP/RP spectra in the internal system (see De Angeli et al. 2022) as they have been used to estimate astrophysical parameters for Gaia DR3. The right panel shows the exact same BP/RP spectra after external calibration as described in Montegriffo et al. 2022. ESA/Gaia/DPAC - CC BY-SA 3.0 IGO. The images in this animation are adapted from those presented in Gaia Collaboration, Creevey et al. 2022 A&A. Acknowledgements: Rene Andrae, Andreas Korn, Anthony Brown, Orlagh Creevey.
Different techniques allow us to determine the amount of extinction associated with one star. The most common approach uses the wavelength dependence of the extinction mentioned above. Together with the Gaia parallaxes, astronomers can disentangle the distribution of the interstellar medium from the measured extinction through the analysis of the many stars with Gaia BP and RP spectra. GSP-Phot is the software that analyzed about 500 million stars in the Gaia DR3 data release. More specifically, it deduced the distance, temperature, chemistry, and the amount of extinction for each of these stars.
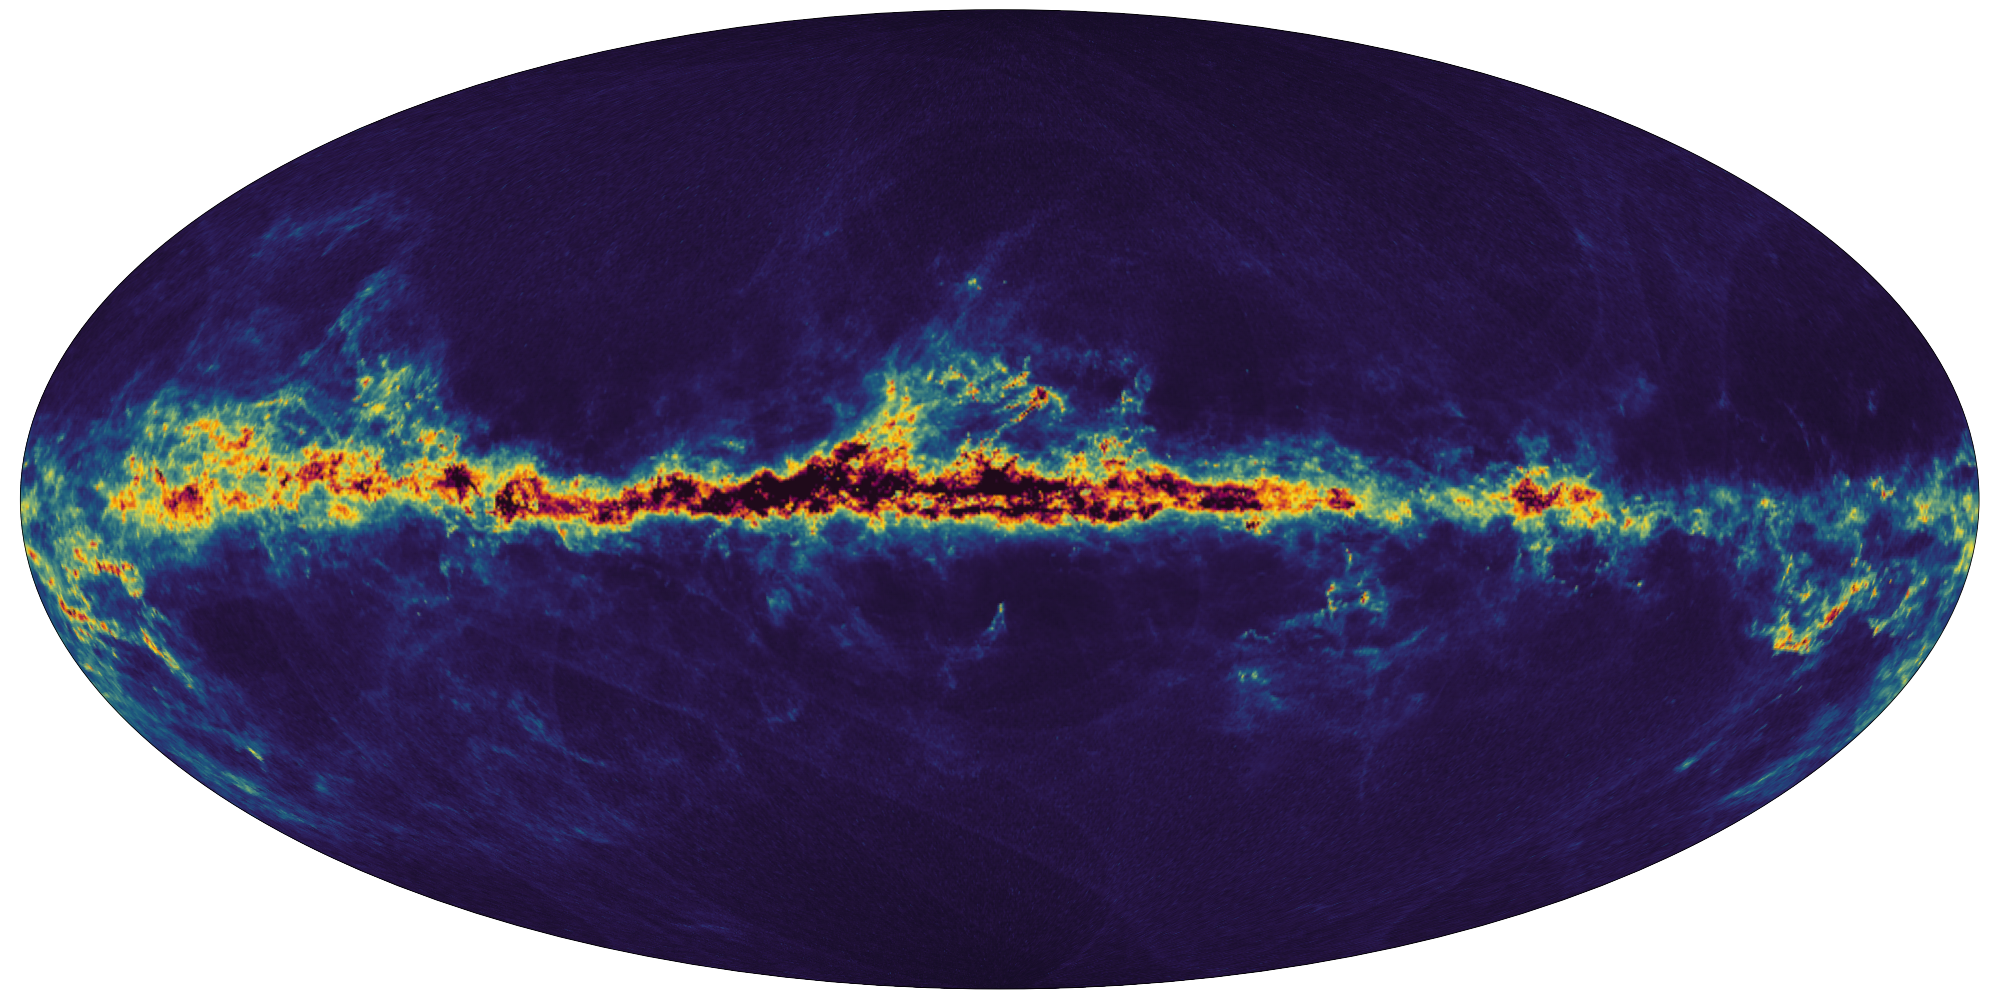
Figure 2: Sky map of GSPPhot extinction. GSPphot provides extinction for individual stars. These stars are combined into healpixels at level 10 to create these sky maps. The extinction is shown from A0 = 0 to 4 on the colour bar scale. In Gaia DR2 an extinction map using ~220 million sources binned into level 10 healpixels was shown. In this current map for Gaia DR3 ~470 million sources were used, binned into level 10 healpixels. This sky map has been smoothed. See Andrae et al., 2022 for more details. Note also that the colour map used here is different from that of the GSPphot Gaia DR2 images as published here and here. Details on the data used for this sky map: GSPphot - healpix level 10 data as available from the Gaia Archive. Credits: ESA/Gaia/DPAC - CC BY-SA 3.0 IGO. Acknowledgements: Created by T.E.Dharmawardena, Gaia group @ MPIA
The above map updates the first extinction map published with Gaia Data Release 2 here and here. Although Gaia DR2 provided some insight into Gaia astrophysical parameters like extinction, only now, with Gaia Data Release 3, do we see the full power of Gaia for determining parameters like extinction.
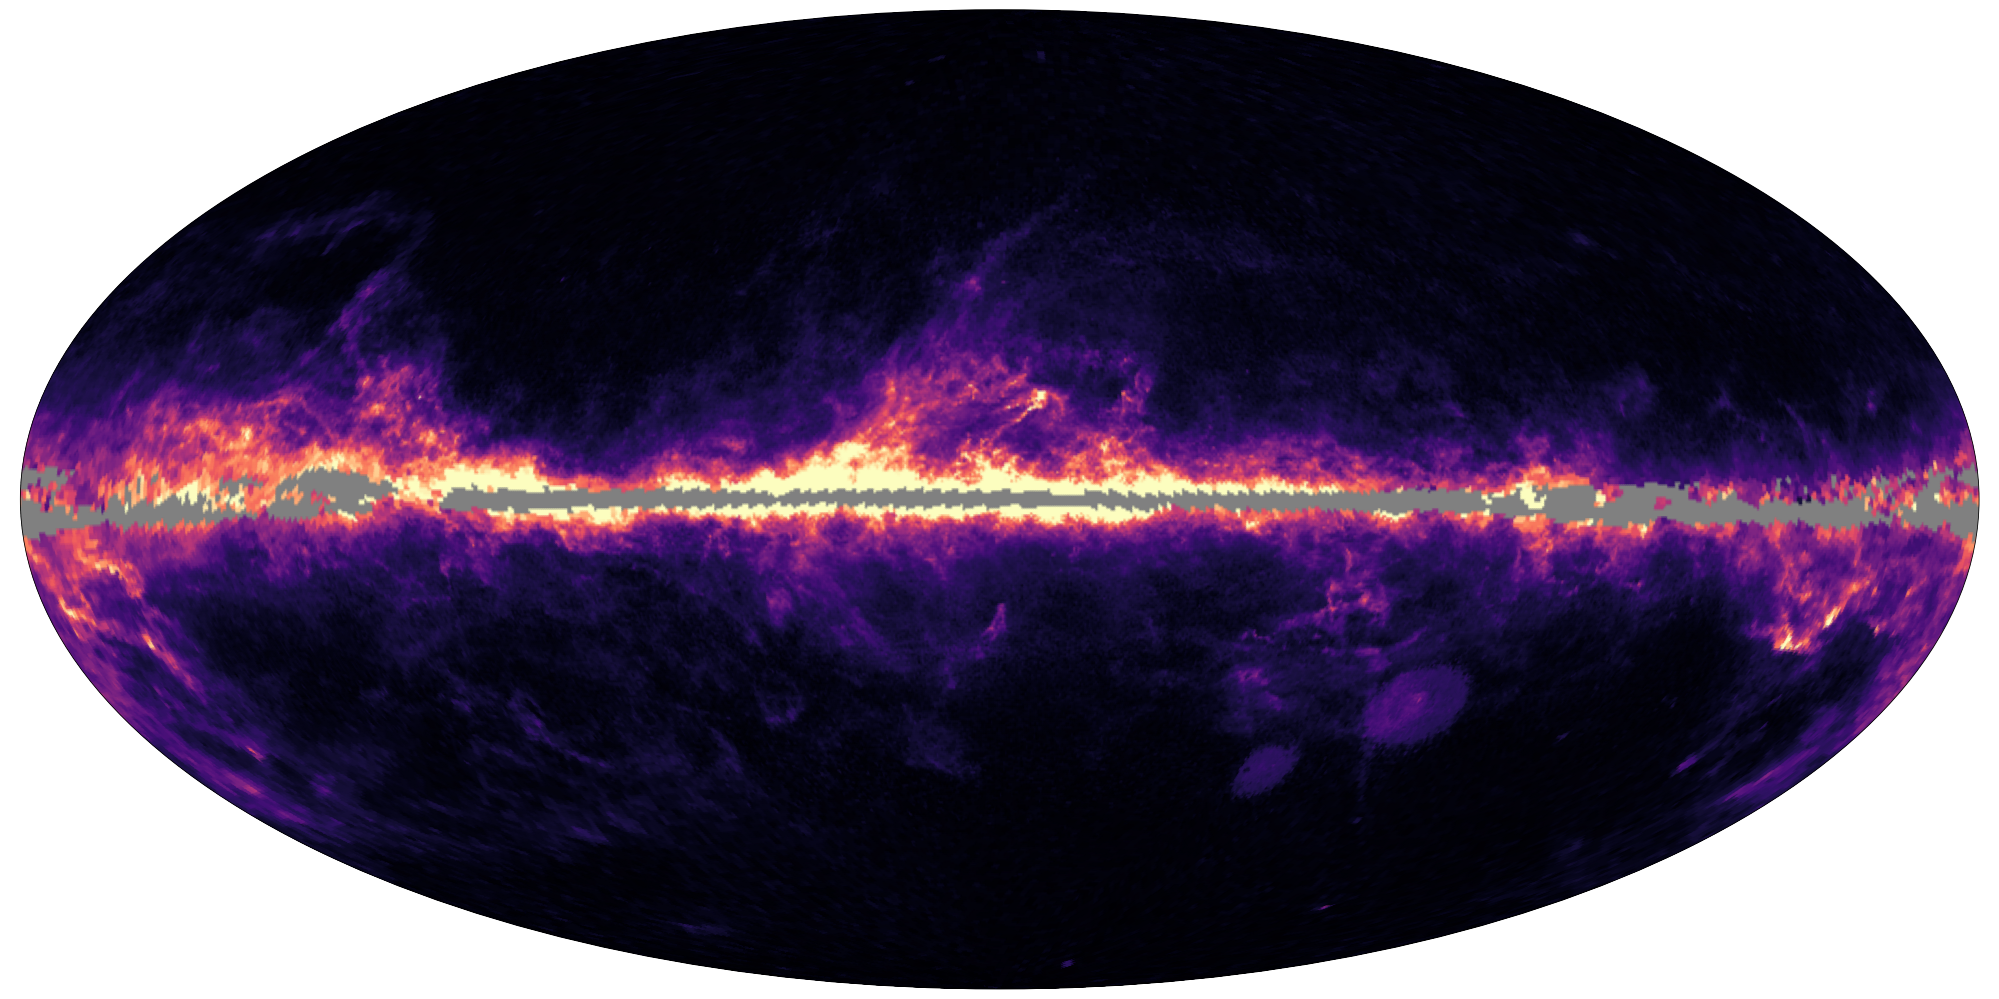
Figure 3. Sky map of total galactic extinction (TGE). The sky map of total galactic extinction shows the total extinction from the Milky Way' interstellar medium, as observed from the Sun to the edge of the Milky Way. This was created using GSPhpot extinction measurements of red giant stars in the Gaia DR3 sample. While the colour bar is not shown, the colours represent extinction A0 from 0 to 5 magnitudes. Details on the data used for this sky map: Total Galactic Extinction - optimised healpix map based on the DR3 table total_galactic_extinction_map_opt. This sky map has not been smoothed. See Delchambre et al. 2022 for more details. Credits: ESA/Gaia/DPAC - CC BY-SA 3.0 IGO. Acknowledgements: Created by T.E.Dharmawardena, Gaia group @ MPIA
From the distant stars that GSP-Phot analyzed most precisely (typically bright red giant stars), the Total Galactic Extinction (TGE) software module estimated the total galactic extinction on any line of sight through our Galaxy. However, the thin disc of the Milky Way is so densely populated with stars and the ISM that Gaia cannot see very distant stars in these regions. As a result, TGE cannot produce estimates, so the parts of the TGE map along this disc are incomplete (shown in grey). However, TGE estimates the total extinction of distant galaxies over most of the sky.
With Gaia DR3, all-sky total galactic extinction maps at different spatial resolutions are available from the Gaia Archive. Maps provided are at HEALPix levels 6, 7, 8, and 9.
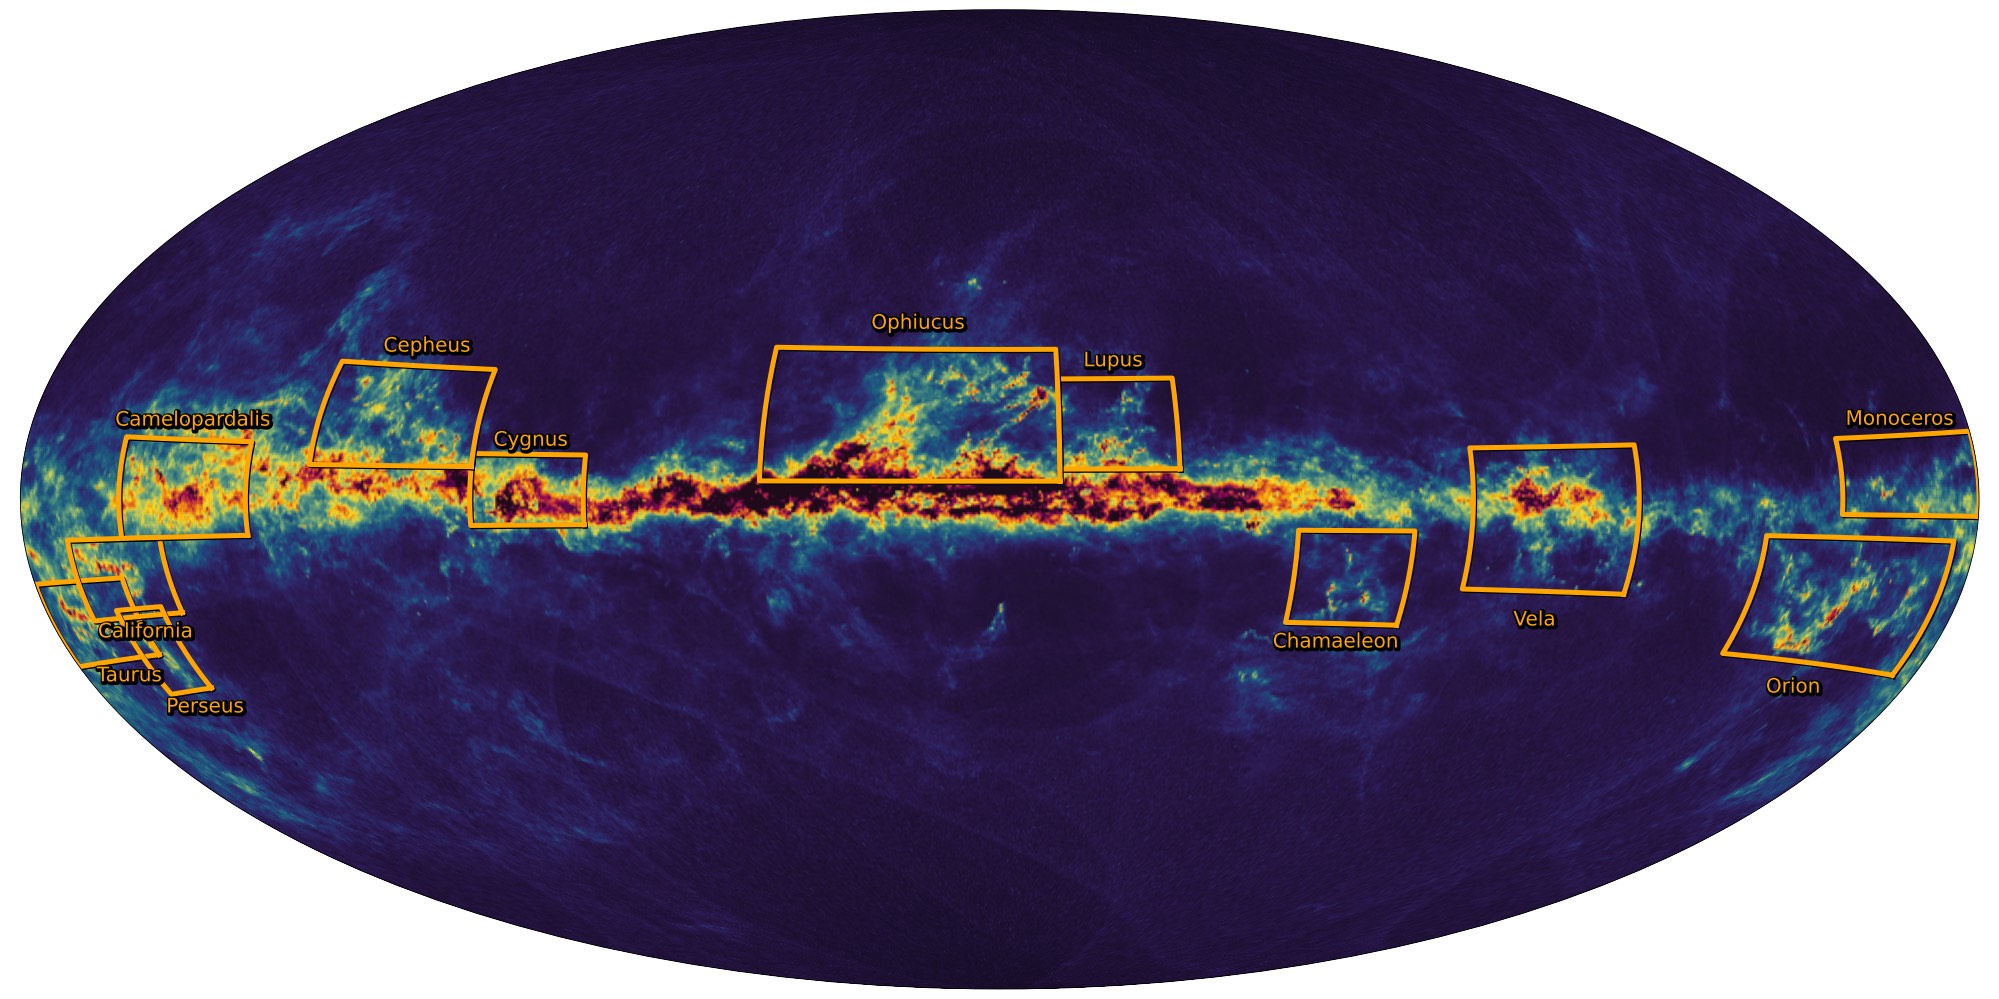
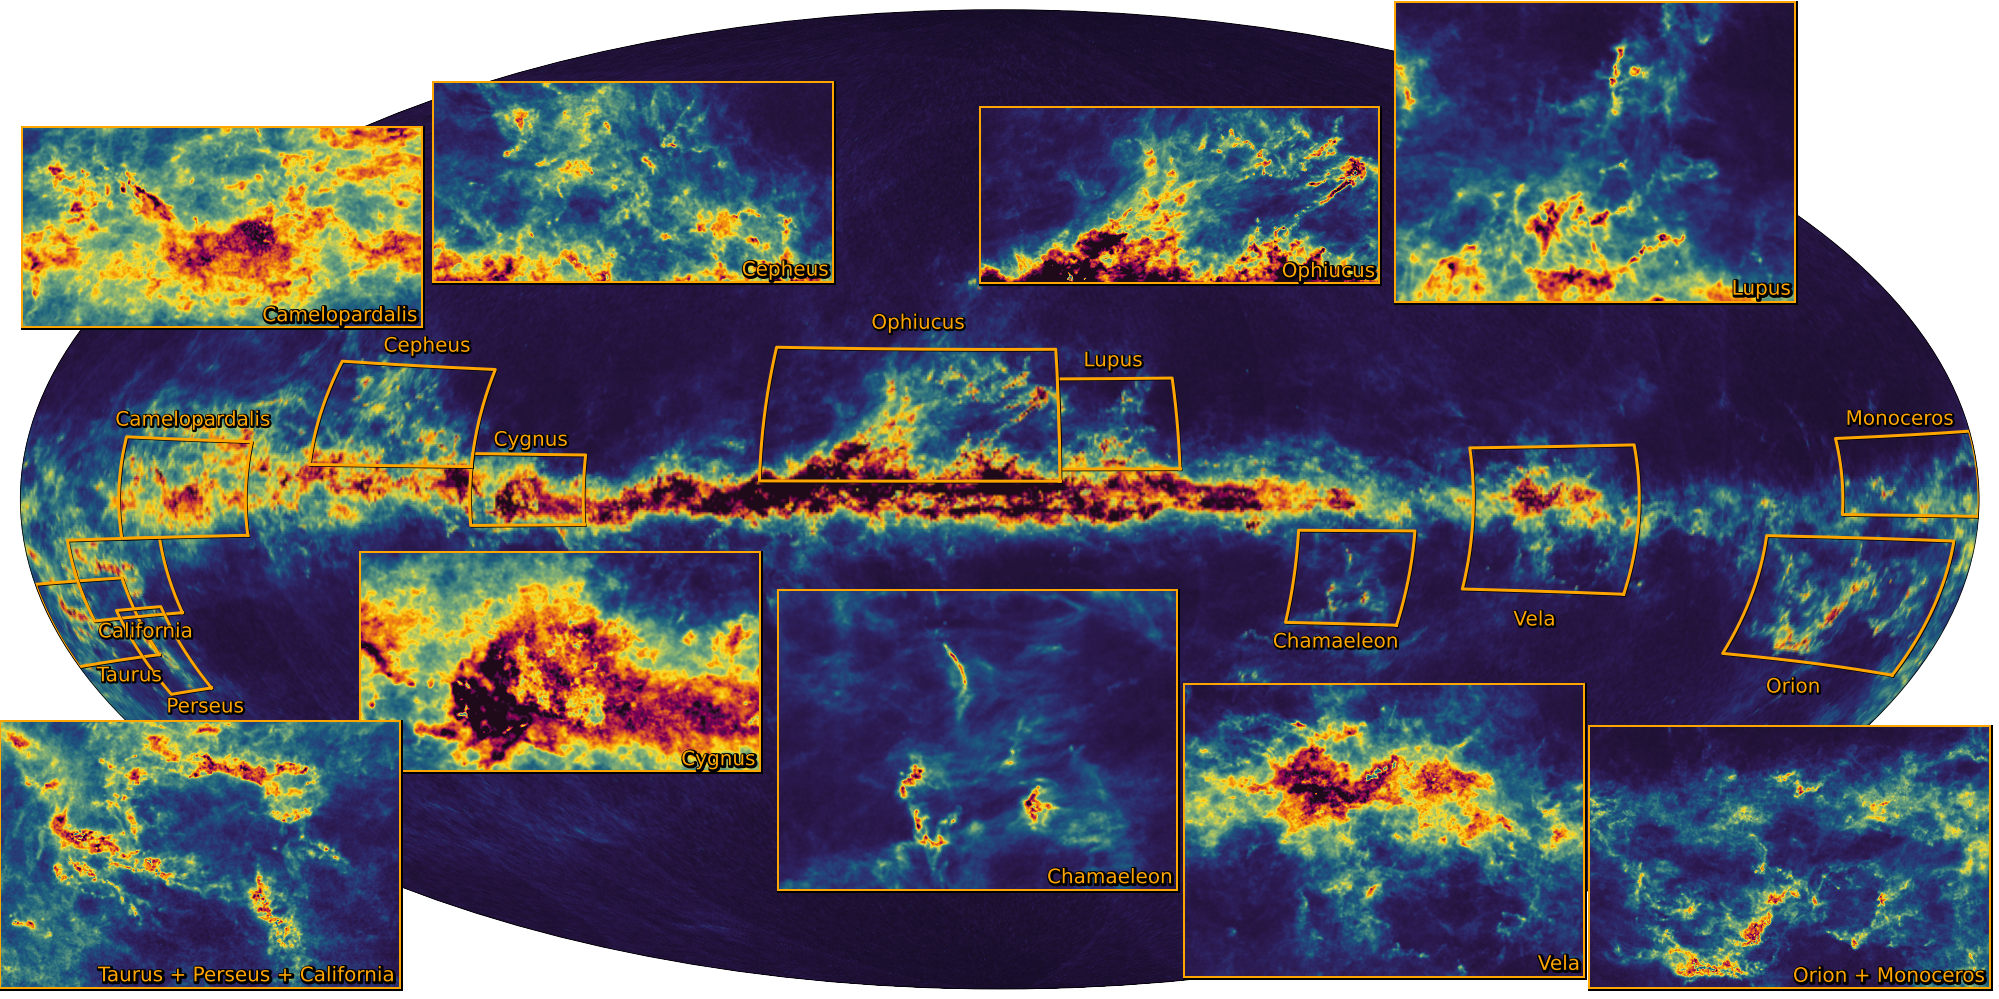
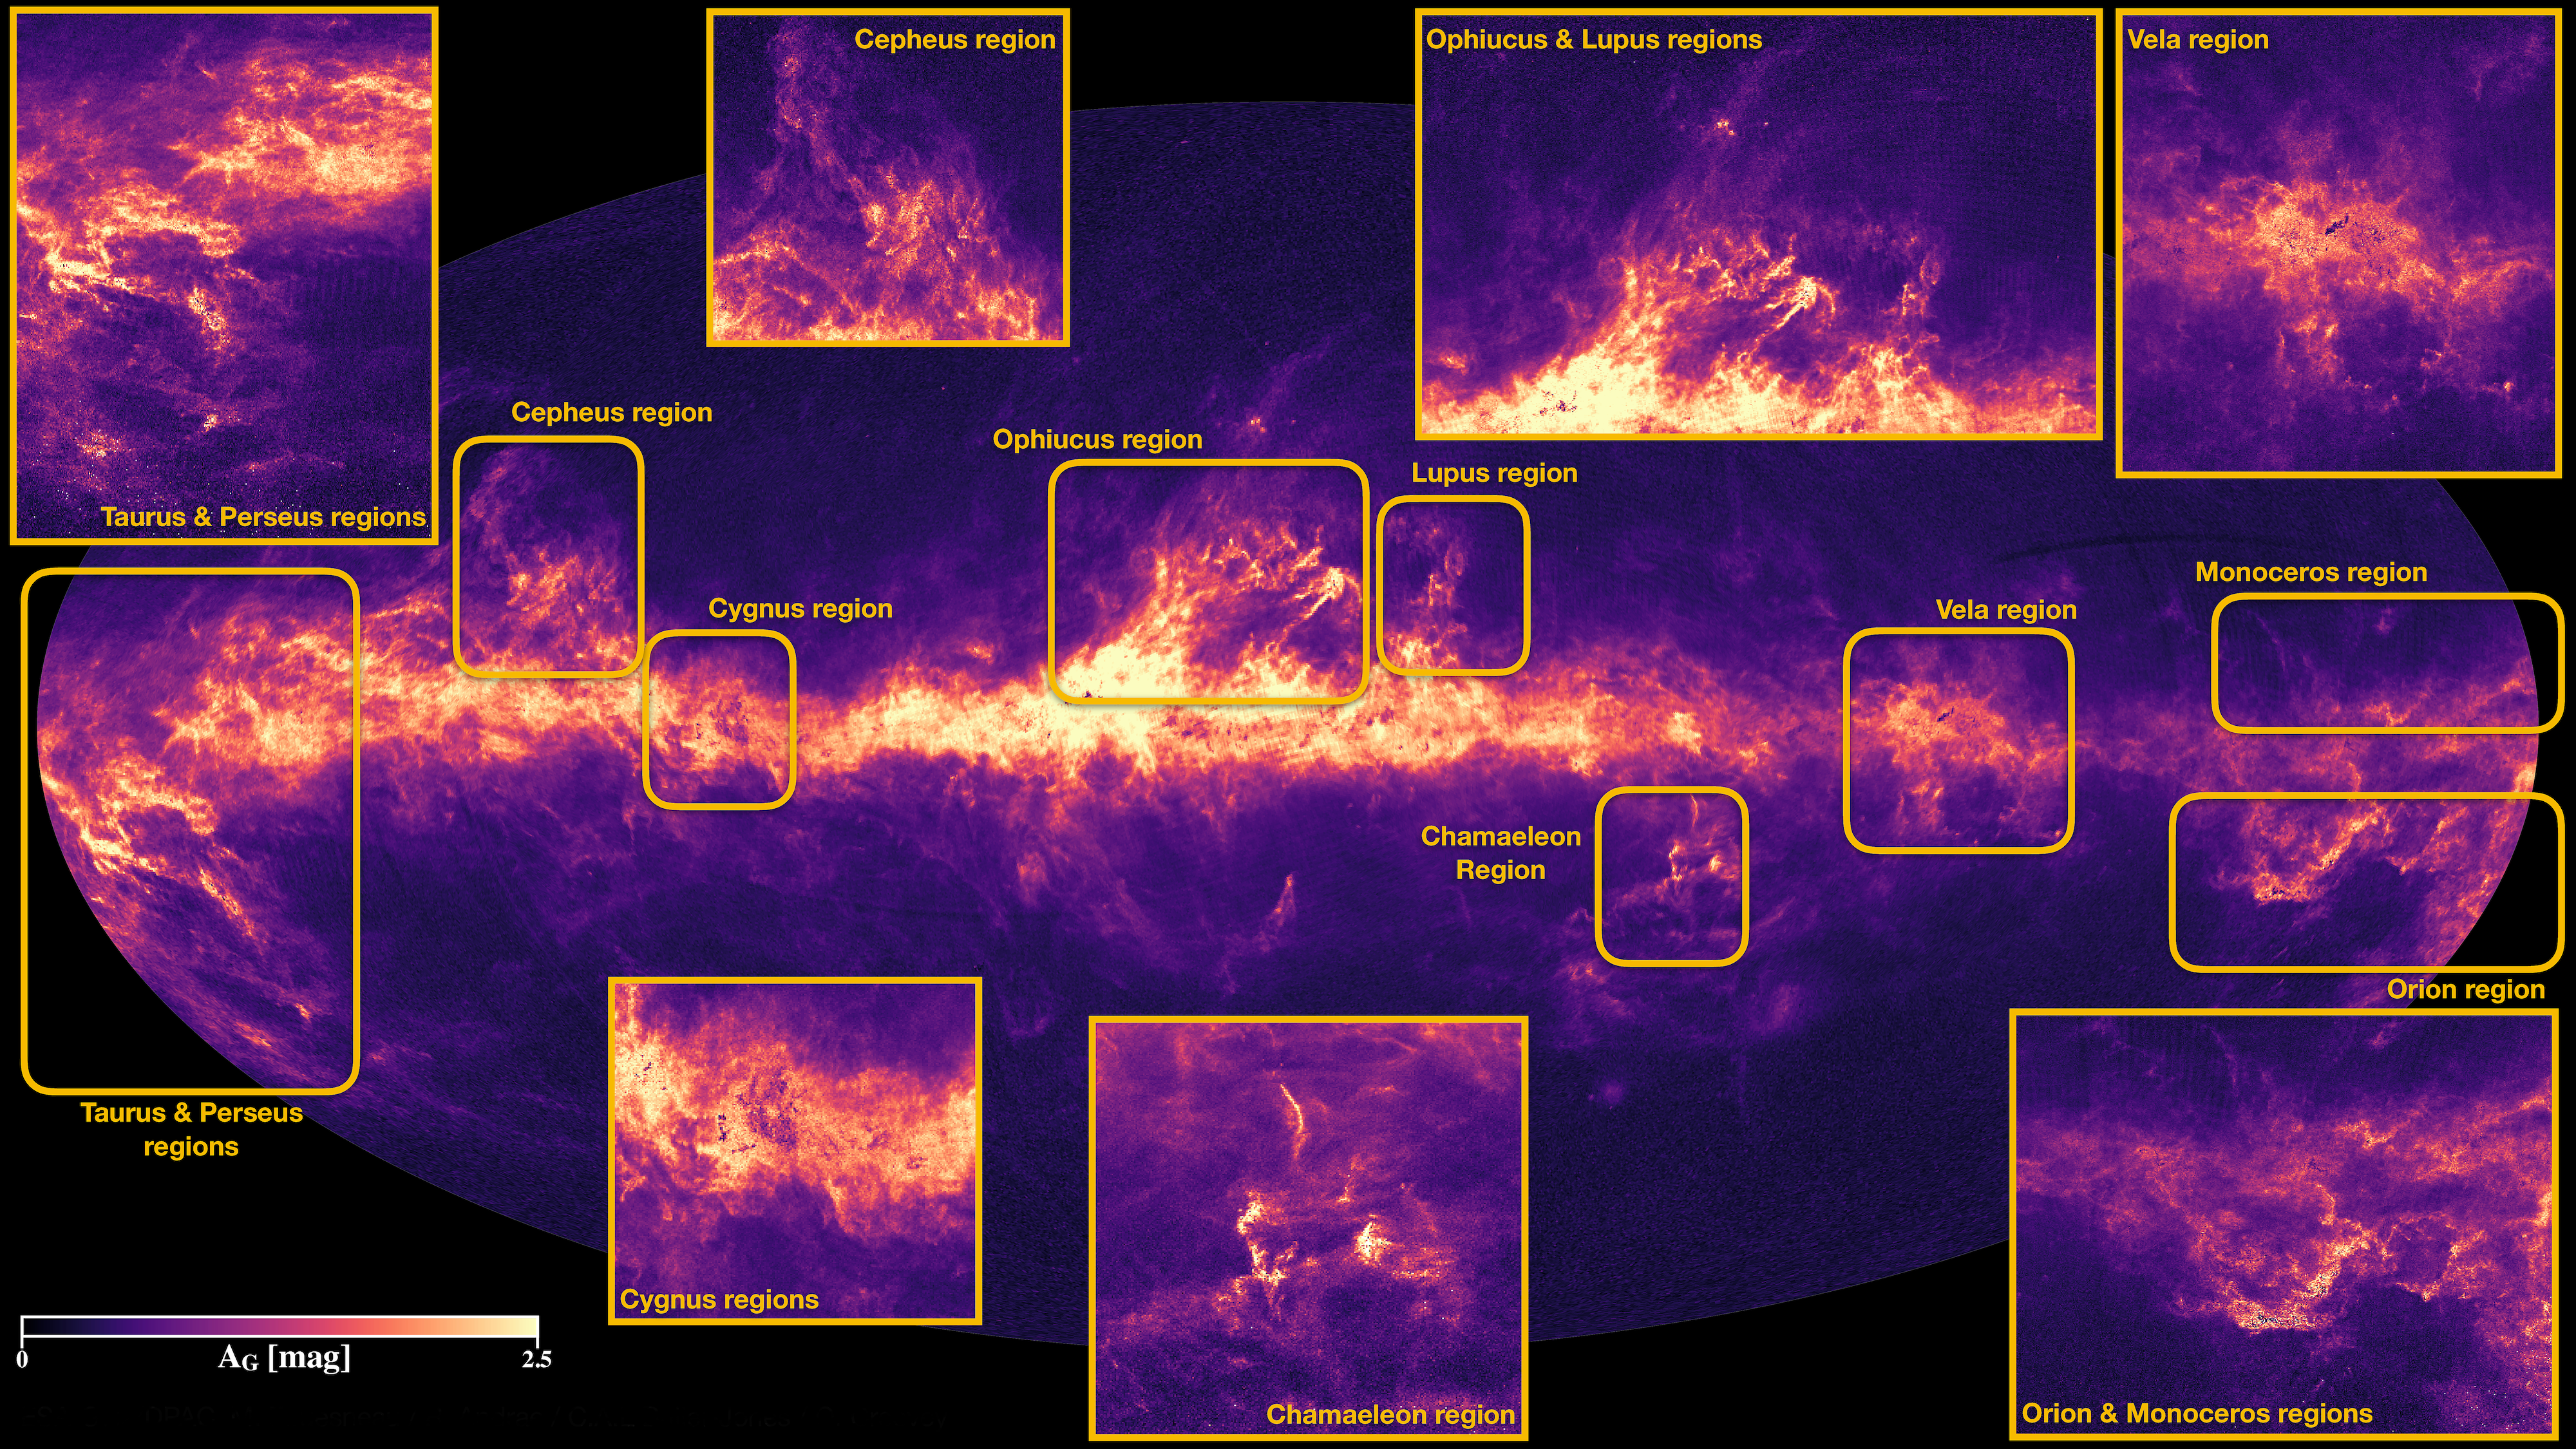
Figure 4. Sky map of GSPPhot extinction (as described in Figure 2) with on the left insets added to highlight the known star formation regions, and on the right zoom-ins of these same star formation regions. Credits: ESA/Gaia/DPAC - CC BY-SA 3.0 IGO. Acknowledgements: Created by T.E.Dharmawardena, Gaia group @ MPIA
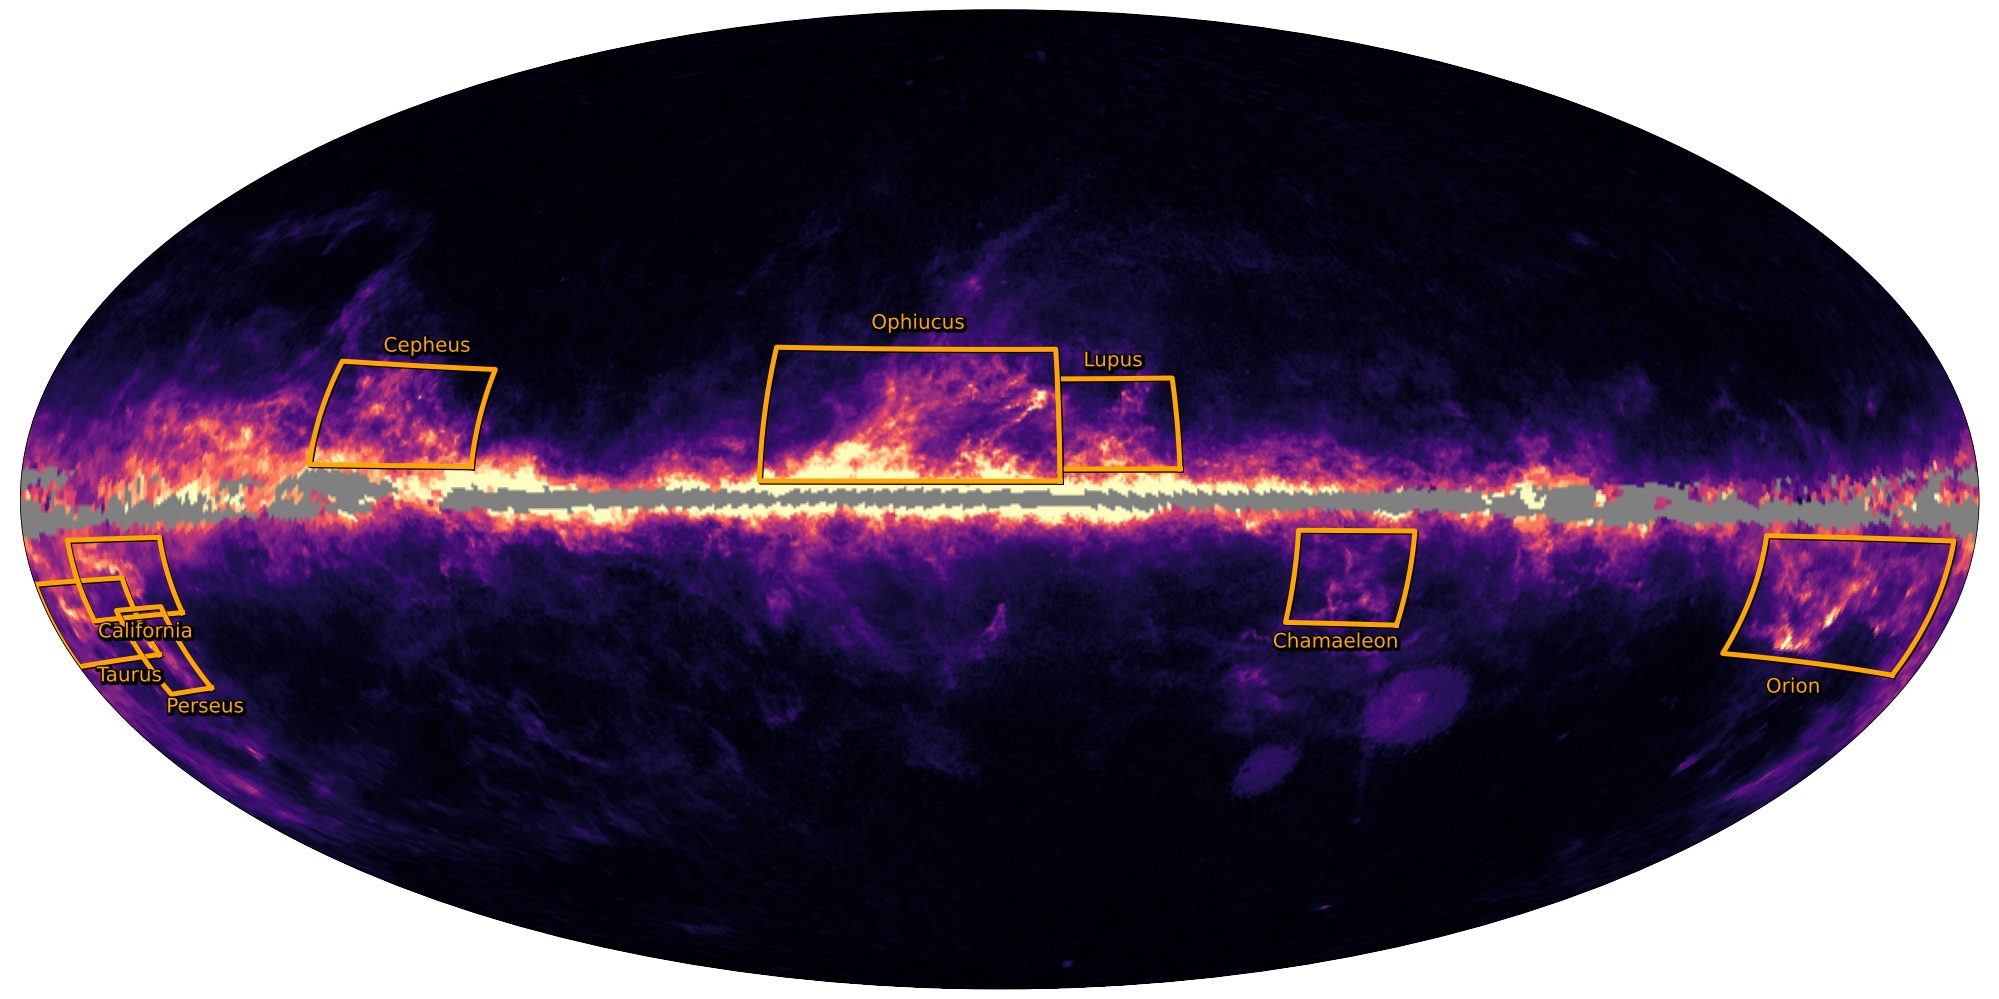
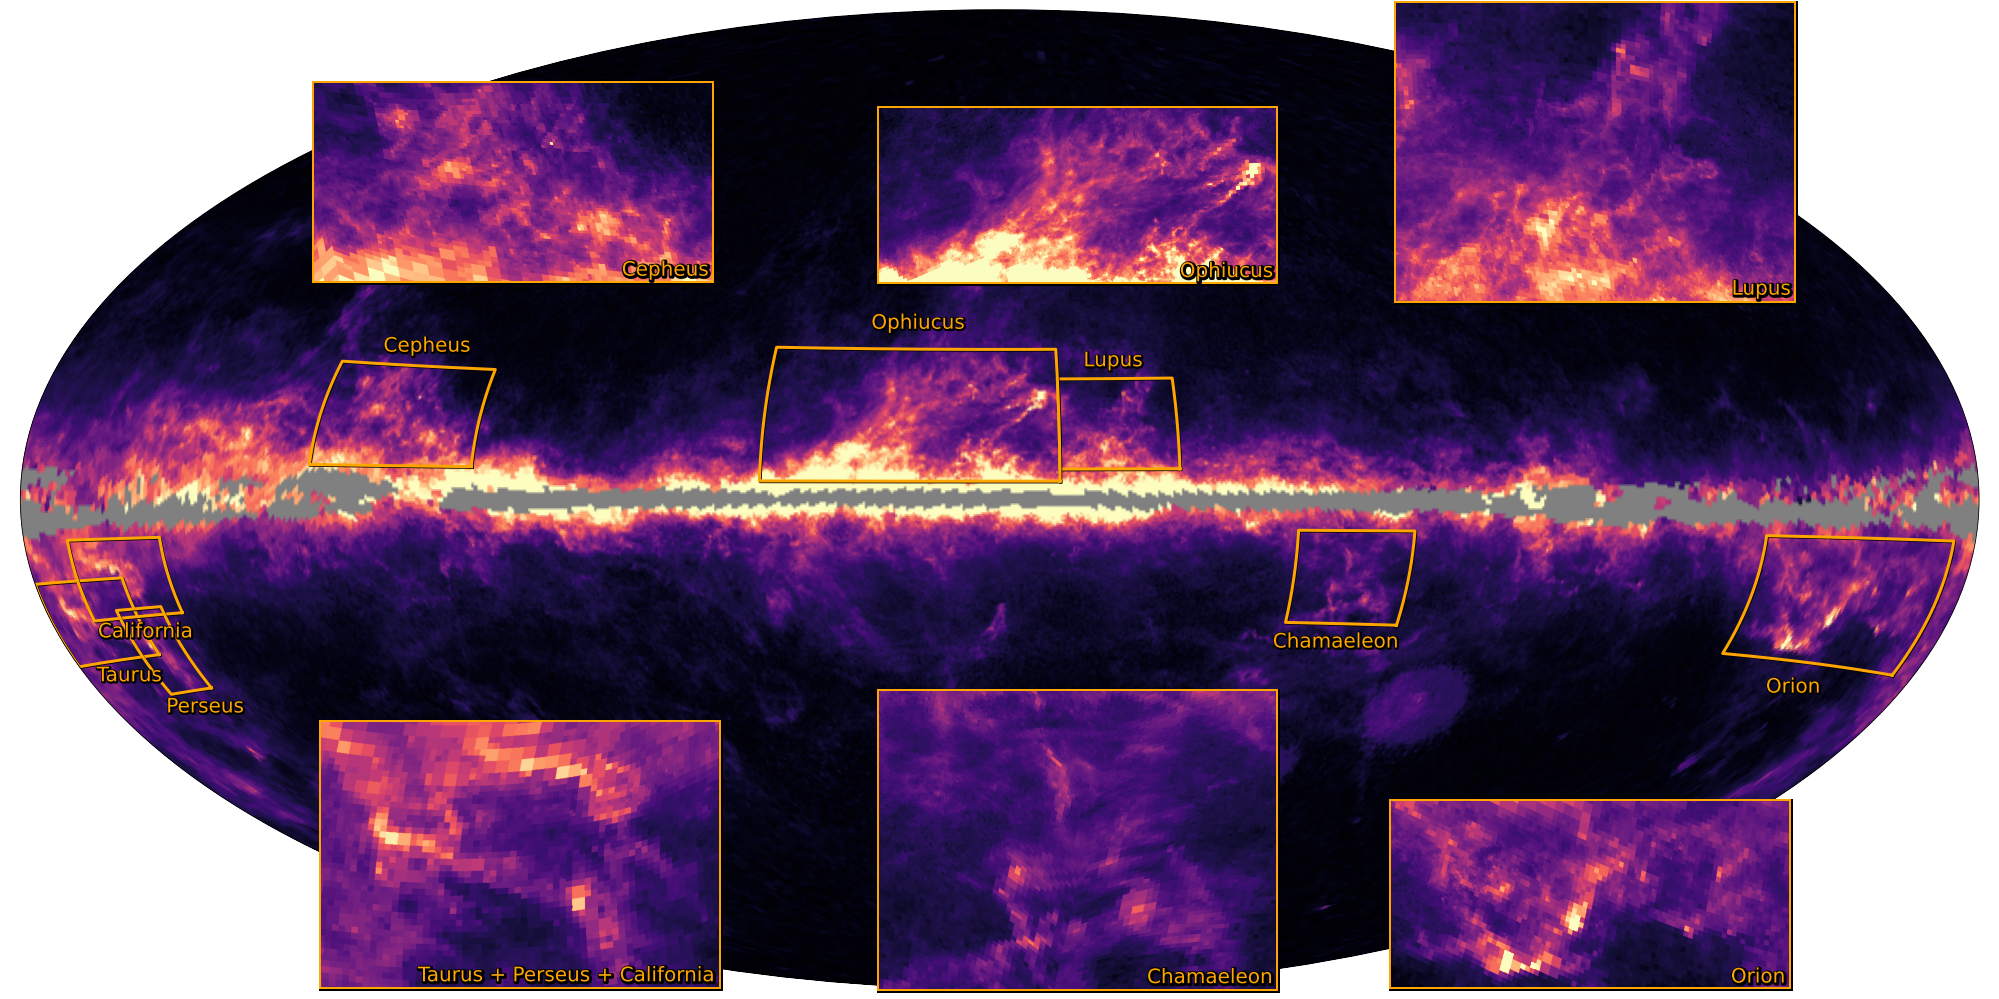
Figure 5. Sky map of total galactic extinction (as described in Figure 3) with on the left insets added to highlight the known star formation regions, and on the right zoom-ins of these same star formation regions. Credits: ESA/Gaia/DPAC - CC BY-SA 3.0 IGO. Acknowledgements: Created by T.E.Dharmawardena, Gaia group @ MPIA
Another technique to characterize the interstellar medium (ISM) is by measuring its chemical imprints on the dispersed light of the stars. One of these imprints, the diffuse interstellar bands (DIBs), are absorption features often attributed to organic molecules in the ISM. However, their exact origin remains unknown even after a century.

Figure 6. Animation showing multiple Gaia RVS Spectra and highlighting the DIB 862nm imprint of the ISM along the line of sight to those stars. Gaia measurements of the stellar flux are indicated in black; the red line indicates the best model description. The colored vertical stripes indicate the different atoms and molecules present in the stellar atmosphere. A green square indicates the DIB. Credits: ESA/Gaia/DPAC - CC BY-SA 3.0 IGO. Acknowledgements: ESA/Gaia/DPAC/CU8, Recio-Blanco and the GSP-Spec team.

Figure 7. Animation showing how the DIB 862nm imprint of the ISM gets stronger along the line of sight with distance. The black line indicates the best model description. Credits: ESA/Gaia/DPAC - CC BY-SA 3.0 IGO, based on images published in Gaia Collaboration, Schultheis, et al. 2022. Acknowledgements: M. Schultheis.
DIBs are challenging to observe from ground-based telescopes because of the Earth’s atmosphere. Still, at Gaia’s location (about 1,5 million km from Earth in the direction away from the Sun), the observing conditions are ideal, and the RVS data provides high-quality measurements of the strength of the DIB at the 862nm wavelength.
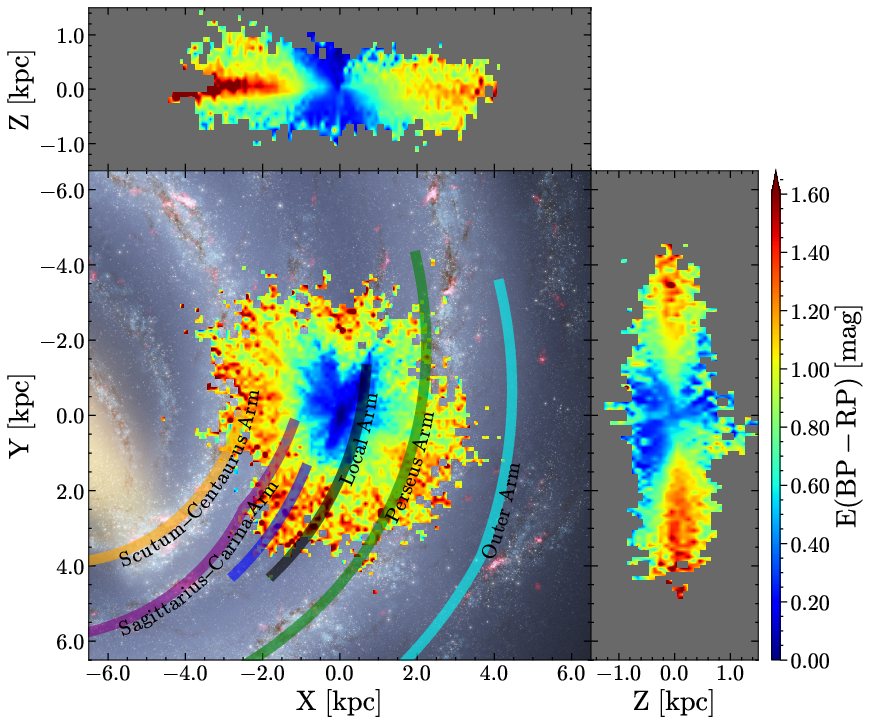
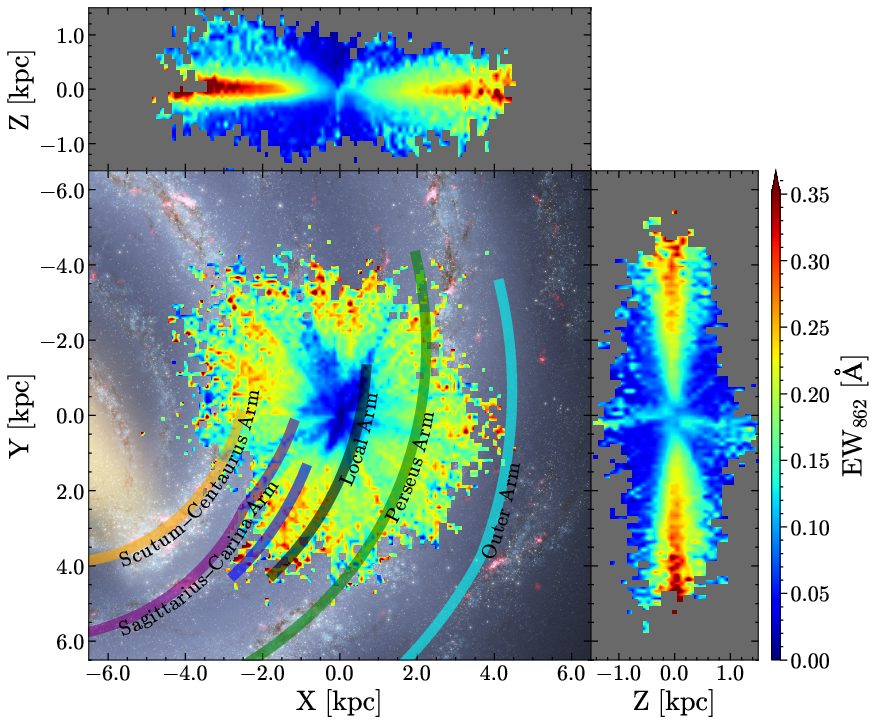
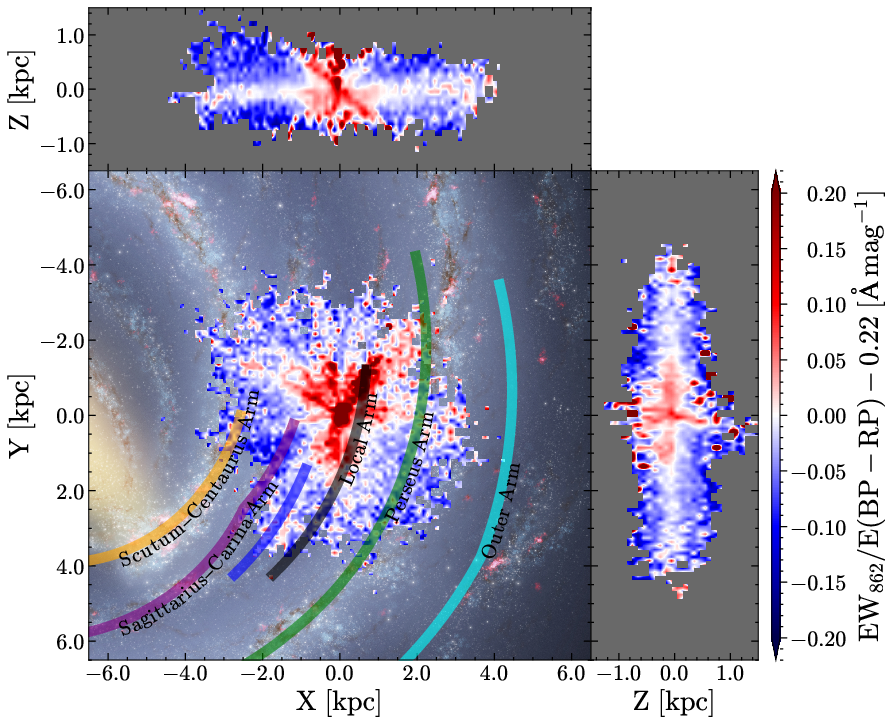
Figure 8. Three-dimensional maps of extinction (left) and DIB (middle) measurements using Gaia DR3 data. The left panel illustrates the strong correlation between extinction and DIBs. According to the astronomers ' best knowledge, we highlighted the Milky Way spiral arms. The Sun lies at the center (0, 0) of these maps, and the Galactic Center is located towards the left (-8kpc, 0). The image behind is an artistic view of our Galaxy by Robert Hurt and Robert Benjamin (Churchwell et al. 200). Figures from Gaia Collaboration, Schultheis, et al. 2022 - CC BY-SA 3.0 IGO.
Finally, we can also construct maps of extinction in the Milky Way, as seen from outside the Galaxy, thanks to the Gaia distances. Figure 8 illustrates the construction of the extinction (left panel) and DIBs (middle) maps, respectively. The extinction and DIB maps are very similar, but they also have significant differences (highlighted in the left panel), particularly in the Local Bubble (less than 1kpc around the Sun). The latter is the nearby area which nowadays contains very little gas and dust due to the past supernovae, those explosive events that pushed gas and dust away.
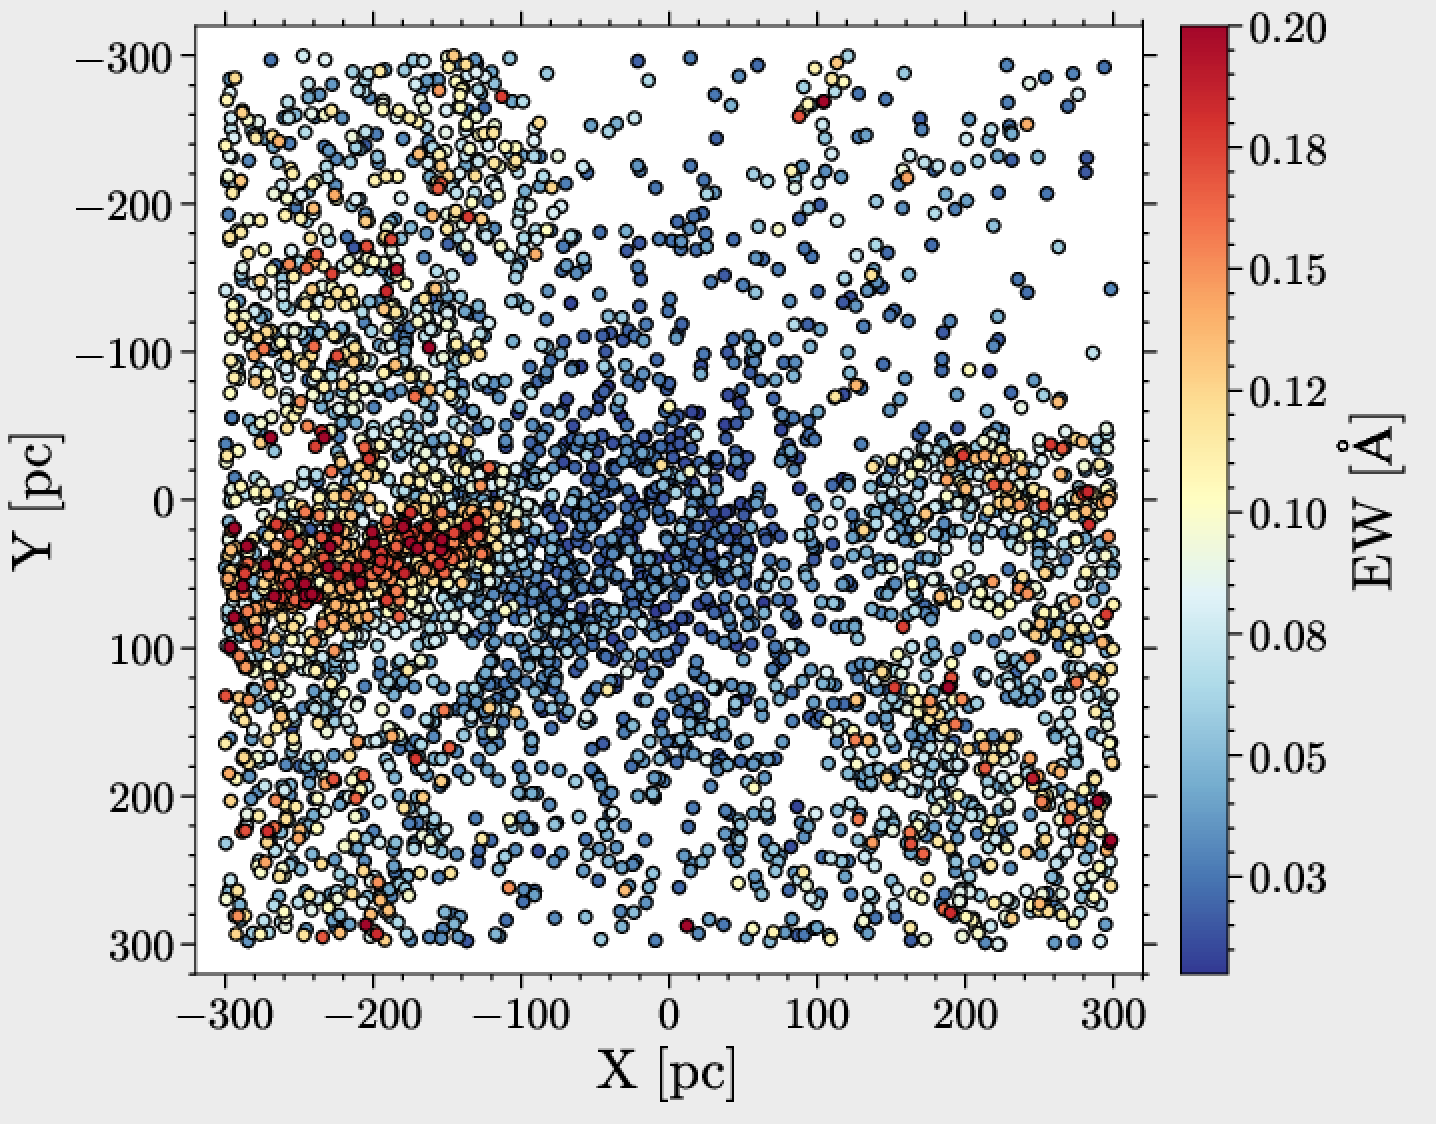
Figure 9. A zoom-in into the local bubble, highlighting the existence of DIB inside the bubble. Figure from Gaia Collaboration, Schultheis, et al. 2022 - CC BY-SA 3.0 IGO.
The Gaia observations revealed a significant mystery in the Local Bubble: what mechanisms led to having little to no extinction but the presence of the molecules responsible for the DIBs? Either the latter were not blown away by the supernovae, or they formed after. Both scenarios will help us understand the interstellar medium's nature and open new views on the cosmic history in the local bubble.
On the other hand, Gaia also measures the movement of stars. From those movements, astronomers were able to infer the spiral structure of the Milky Way, for instance. But these movements also revealed the wavy kinematics of the DIB at 862nm carriers, which correlates nicely with the CO gas motion in the Milky Way. This correlation hints that the DIB carriers could relate to gaseous macro molecules in the ISM (see paper “Gaia Data Release 3: Exploring and mapping the diffuse interstellar band at 862nm” by the Gaia Collaboration, Schultheis, et al. 2022).
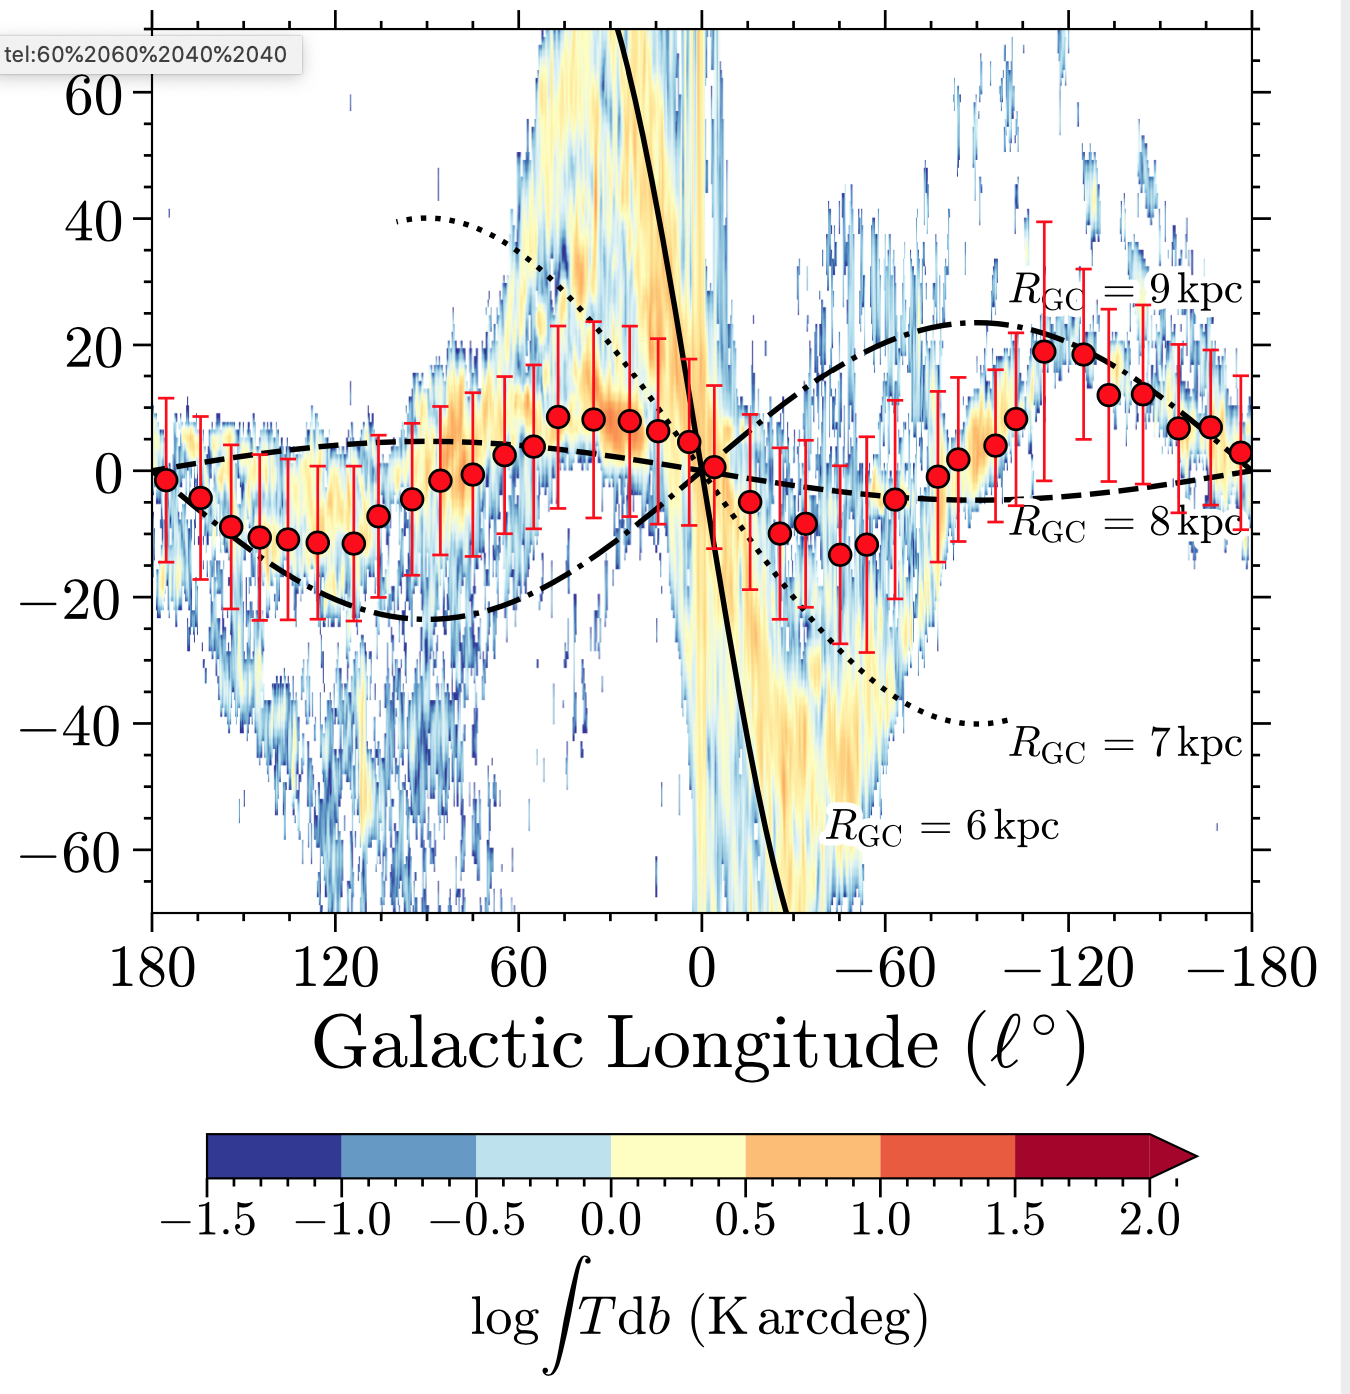
Figure 10. Longitude–velocity diagram for the Gaia DIB λ862nm compared with 12CO from Dame et al. (2001). The red circles and vertical bars indicate the median velocities and uncertainty. We also indicated velocity curves for different galactocentric distances (Reid et al. 2019). Credits: Gaia Collaboration, Schultheis, et al. 2022 -CC BY-SA 3.0 IGO. Acknowledgements: ESA/Gaia/DPAC/CU8, created by H. Zhao and M. Schultheis.
It is the first time that the Galactic rotation curve could be traced so clearly by a DIB feature. The RVS spectra have proven a compelling data product from Gaia! Gaia is first and foremost a “billion-star surveyor,” but maybe surprisingly, its observations allow us to map the interstellar medium with precision. By using the BP, RP, and RVS spectra in Gaia DR3, scientists can measure multiple independent quantities – extinction and DIBs – revealing the characteristics of the ISM. With Gaia Data Release 3, Gaia becomes the largest topography of the interstellar medium.
Gaia data will allow astronomers to reconstruct the three-dimensional dust density of the Milky Way, gaining critical insight into the distribution of the interstellar medium – the gas and dust between the stars. The ISM is the material from which stars are born. These stars, in turn, heat up the interstellar medium when they die and seed it with the new chemical elements they have produced via nuclear fusion throughout their lives. The dust in the ISM also shields molecules from destruction by the UV radiation of the stars. This shielding is crucial for forming planets and for what kind of molecules end up as part of newly forming planets. Studying the properties of dust, such as its three-dimensional distribution and variations in density, is essential to understanding the physics of this delicate balance. It provides us with essential clues to the physical mechanisms of the formation of stars and galaxies and the history of the Milky Way.
In Gaia DR3 GSP-phot provides extinctions and distances for ~470 million individual stars. In this video the extinction is mapped as a function of 3D positon of the full sample of stars from the GSP-phot catalogue as particle data to show the extinction variation of the Milky Way in 3D. The video starts with an artist impression of the top down view of the Milky Way and then shows the top down view of the Milky Way as seen in extinction using the GSP-phot data. Then the view of the Galactic plane from the sun is seen, followed by a zoom in to see the view of several well known Galactic Molecular Clouds, including California, Perseus, Taurus and Orion. See Andrae et al., 2022 for more details on the input data from GSP-phot. Credits: ESA/Gaia/DPAC. Acknowledgements: T. Müller, Max Planck Institute for Astronomy / Haus der Astronomie (Artist impression of Milky Way is based on "NASA/JPL-Caltech/ESO/R. Hurt", eso1339g, Music: "Planet Earth", Jeremusic70, pixabay) .
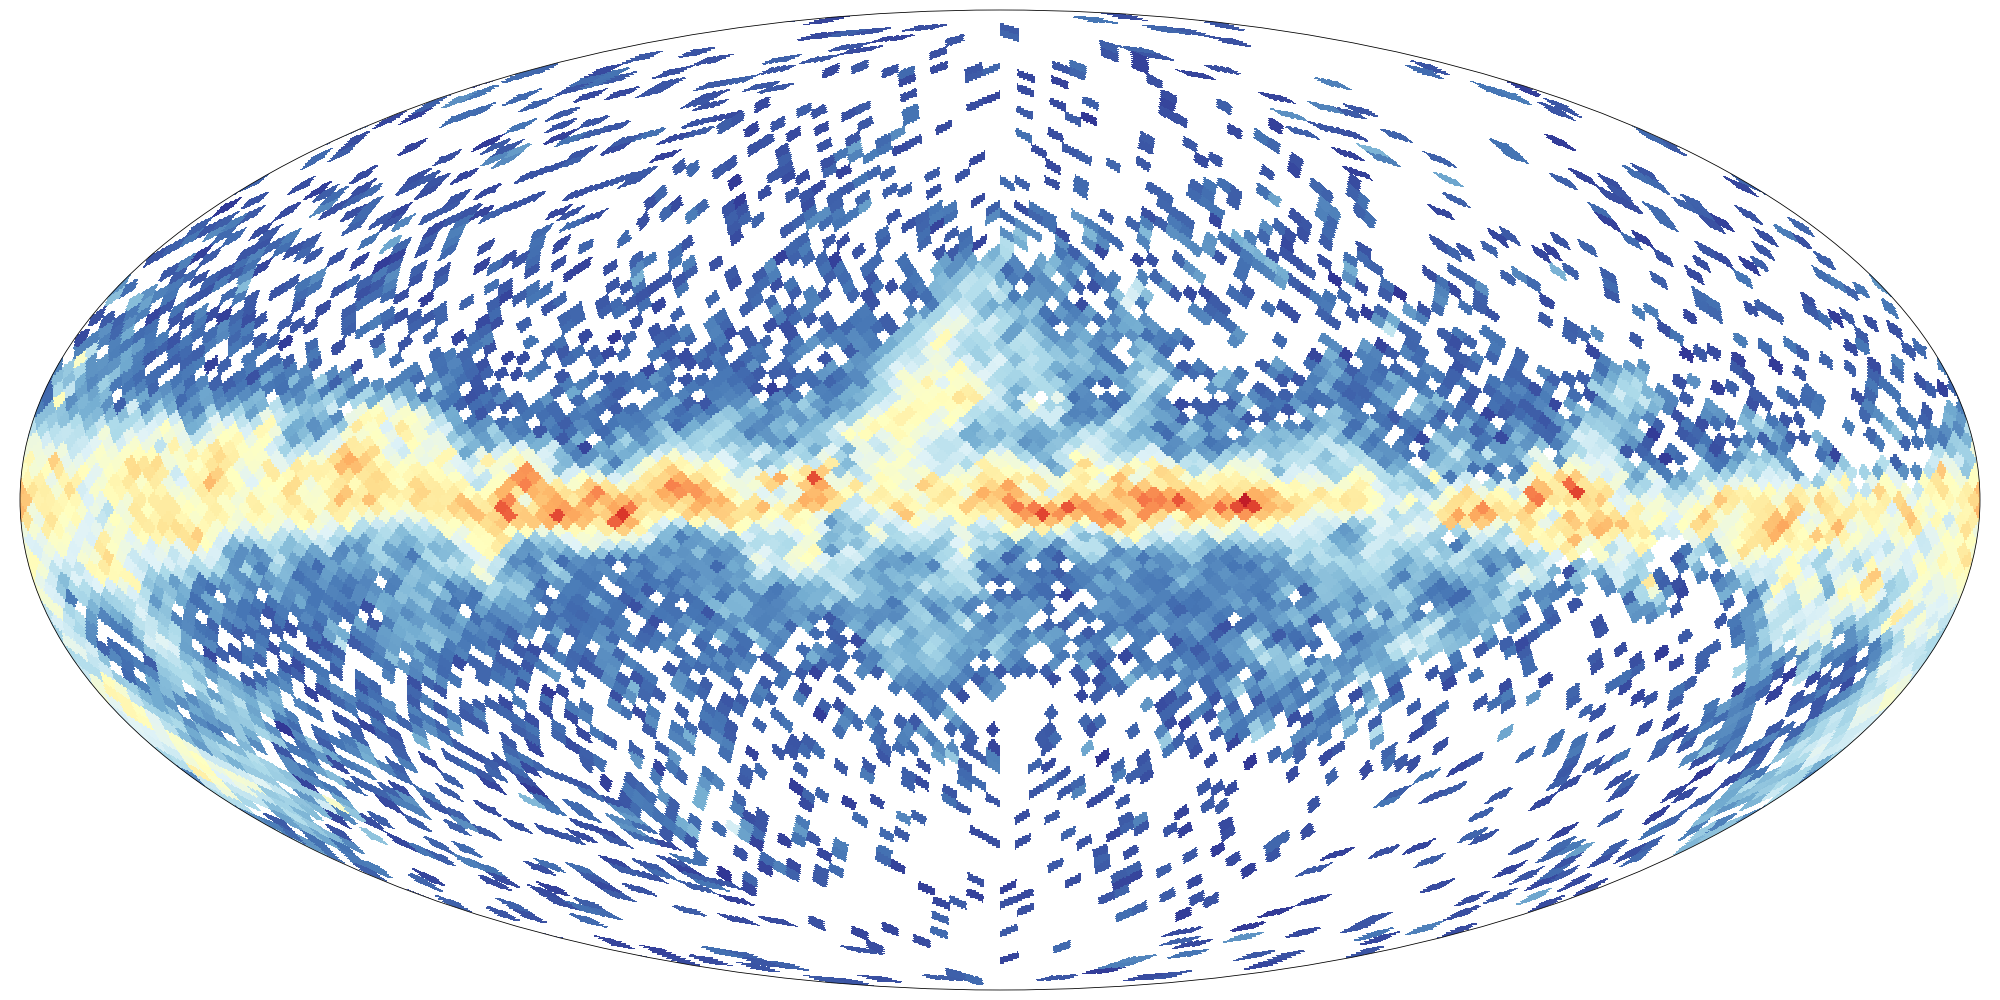
Figure 11. This sky map shows the global distribution of the diffuse interstellar bands (DIB) colour coded by the equivalent width of the DIB at HEALPIx level 5 (~1.8 sq degree resolution). We see clearly strong DIBs concentrated towards the galactic plane. Clearly visible are also some extended features towards higher latitudes for the inner Galaxy (|l| < 30 degrees). Credit: ESA/Gaia/DPAC - CC BY-SA 3.0 IGO. Acknowledgements: ESA/Gaia/DPAC/CU8/GSP-SPec, created by H. Zhao and M. Schultheis.
Comparison between Gaia's data release 2 and Gaia's data release 3 GSPPhot extinction map
Sky map of GSPPhot extinction from Gaia's data release 2 on the left, Sky map from GSPPhot extinction from Gaia's data release 3 on the right. Different colour maps were used to highlight the different Gaia releases they are based upon. Credits: ESA/Gaia/DPAC - CC BY-SA 3.0 IGO.
Credits: ESA/Gaia/DPAC
Story written by: Tineke Roegiers, Morgan Fouesneau, Ronald Drimmel, Mathias Schultheis, Thavisha Dharmawardena, Orlagh Creevey
Published: 13 June 2022
- Removed a total of (30) style text-align:center;
- Removed a total of (14) style text-align:justify;
More Gaia DR3 stories?
Where are the stars? How far away are they? How bright are the stars?
What colour do they have? What are the stars made of?
Where do they go? Where do they come from? Do they approach us? Do they move away?
Did something move in front of the star? What is in between the stars?
How big, warm, old, ... are they? How do they Blink?
Is it a double star? Do they go boom? Is it a galaxy?
Is it a solar system object? Is it a quasar?
Who created the data? Can I Use Gaia data with other observatories?
How did DPAC produce the data for this star? Where is the data?
-
ESA's press release of Gaia Data Release 3
-
Gaia's Early Data Release 3 stories
-
ESA's press release of Gaia Early Data Release 3
- Removed a total of (16) style text-align:center;
- Removed a total of (1) style float:right;