
 Sign in
OA self-organising map tool - Gaia
Gaia DR3 OA Self-Organising Map Tool (GUASOM)
a Gaia utility for the analysis of self-organising maps in Gaia DR3
For Gaia DR3 the Coordination Unit 8 Outlier Analysis working group analysed 56 million objects, with a probability of membership to typical astronomical object classes below a certain threshold (see Gaia DR3 documentation, i.e., classification outliers). Self-Organizing Maps (SOM) is the unsupervised clustering method selected to perform this task.
A free access web environment was designed to facilitate the analysis work of the Gaia DR3 Self-Organising map (Gaia Utility for the Analysis of Self-Organizing Maps). It was implemented with Web technologies, to benefit from their flexibility and easy access to the information.
The version of GUASOM that has been developed precisely for the spectra processed by the Outlier Analysis work package for the Gaia DR3 is called "GUASOM flavour DR3" and contains several visualization utilities that allow a user-friendly analysis of the information present on the map. The tool provides both classical and specific domain representations:
- U matrix: This representation shows the distance among the different neuron prototypes, where less distance means more similarity. This is useful to identify groups of neurons populated by objects with similar Spectral Energy Distributions (SEDs). In our application the user can control the boundaries of the distance among neurons through a slider, with the objective of exploring the inner structure of the map.
- Hits: It displays the number of objects for each neuron, allowing to identify dense regions in the map.
- Parameter distribution: This visualisation shows the distribution of a particular parameter of the domain in the map, displaying the average values calculated in each neuron.
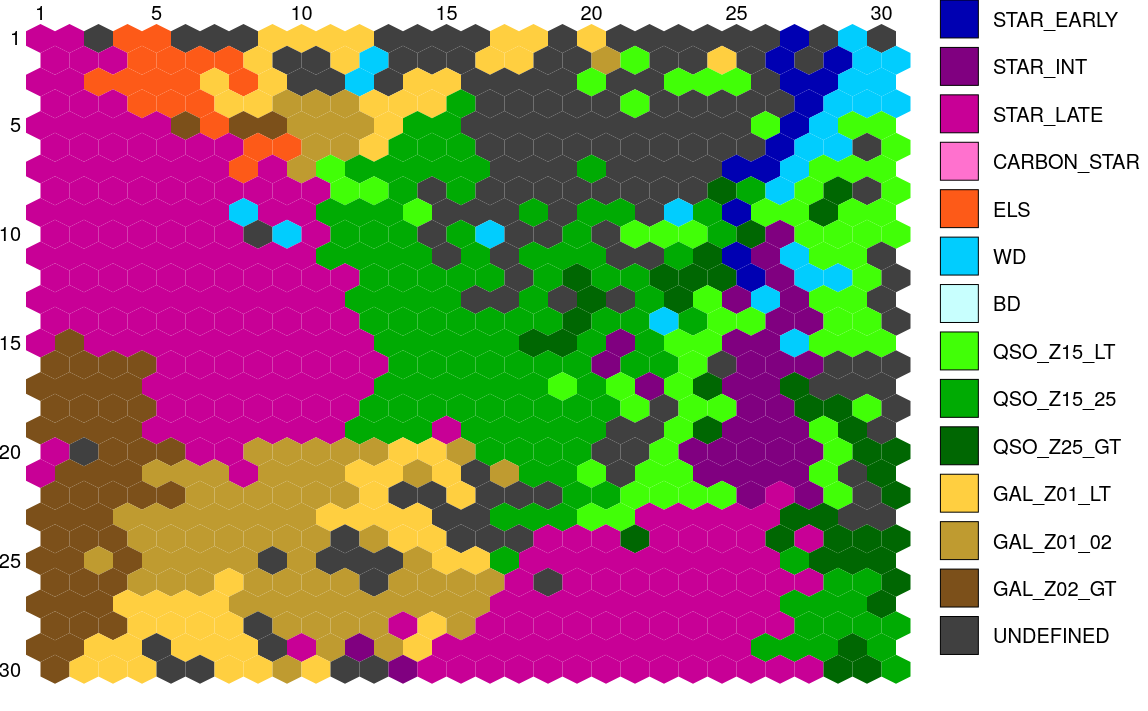
- Catalogue labels: This graphic shows the representative label of each neuron according to a specific catalogue chosen by the user. The labels of the objects were obtained through the cross-matching procedure mentioned before. The user can control the qualified majority limit that the label has to reach to be representative through a slider.
- Template labels: It is similar to the Catalogue labels visualisation, but in this case, it uses the representative label of each cluster based on a template. It selects the template that best fits with the prototype using the Euclidean Distance. One slider allows the user to control the distance between the prototype and its corresponding template to decide the adjustment threshold between them that allows assigning the label with sufficient confidence.
- Category distribution: In this representation the distribution of a unique type of object is shown. The user can select the category to be displayed between a set of labels, according to the templates and catalogues available for the map. With this graphic the user can easily observe the regions of the map containing objects of the chosen type.
- Colour distribution: It shows the colour distribution of the objects in the map, derived as the difference in magnitudes between two photometric bands, which correspond to the two photometers, the blue photometer (BP) and the red photometer (RP), and the colour is calculated as GBP-GRP.
- Novelty: This visualisation displays the distance between a selected template and its prototype. Less distance means less novelty because the template associated with the neuron is quite similar to the prototype, so it refers to a well-known object type. The user can select the set of templates to render.
The strength of the tool lies in its ability to explore the neurons and the objects assigned to them by means of the following specific representations:
- Spectra: Represents the matched template, the object-centroid, and the prototype of a particular neuron. The user can also visualise the spectra of those objects in a neuron that best and worst fit the prototype.
- Population: It shows the frequency of the different types of objects in the neuron according to the available templates or catalogues.
- Statistical summary: The summary shows a table with the statistical information available for a neuron.
Furthermore, in order to perform additional analysis in different environments, GUASOM also allows selecting multiple neurons to download their content in fits format and constructing a query to retrieve the data using the Gaia Archive.
Access the Gaia utility for the analysis of self-organising maps in Gaia DR3 (GUASOM) here
When using the GUASOM tool, we ask you to recognise the ESA/Gaia/DPAC/OA team by adding an acknowledgement to your work as follows: "This research makes use of public analysis products and the visualization tool GUASOM provided by ESA/Gaia/DPAC/CU8/OA”
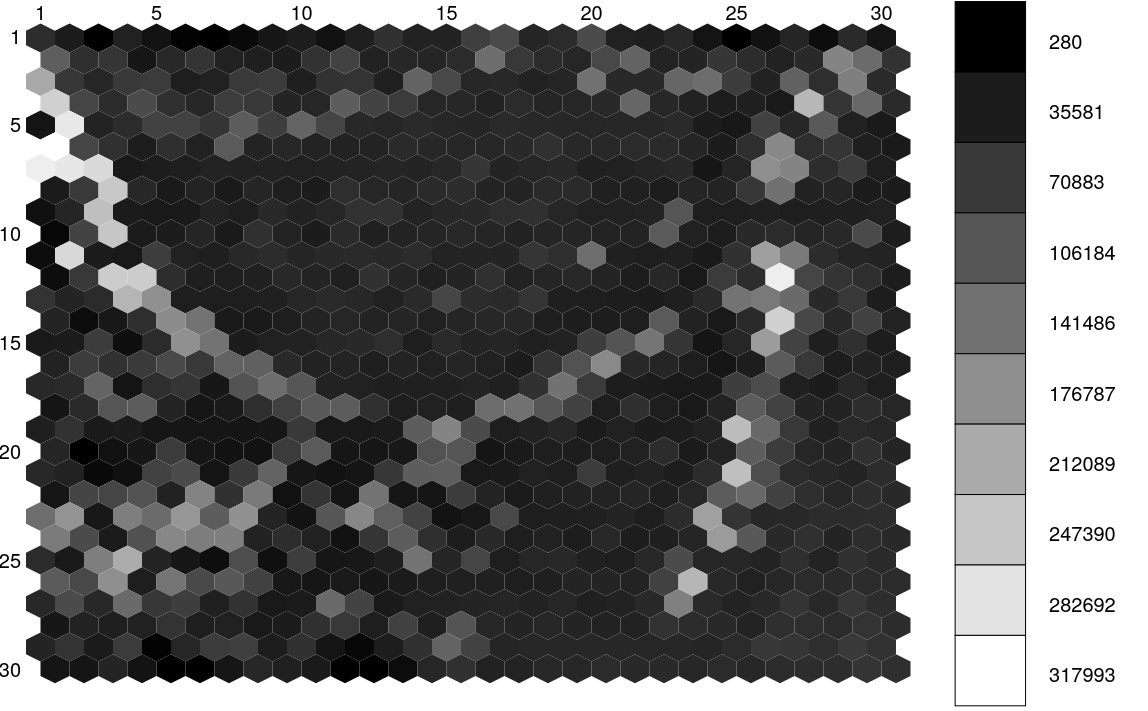
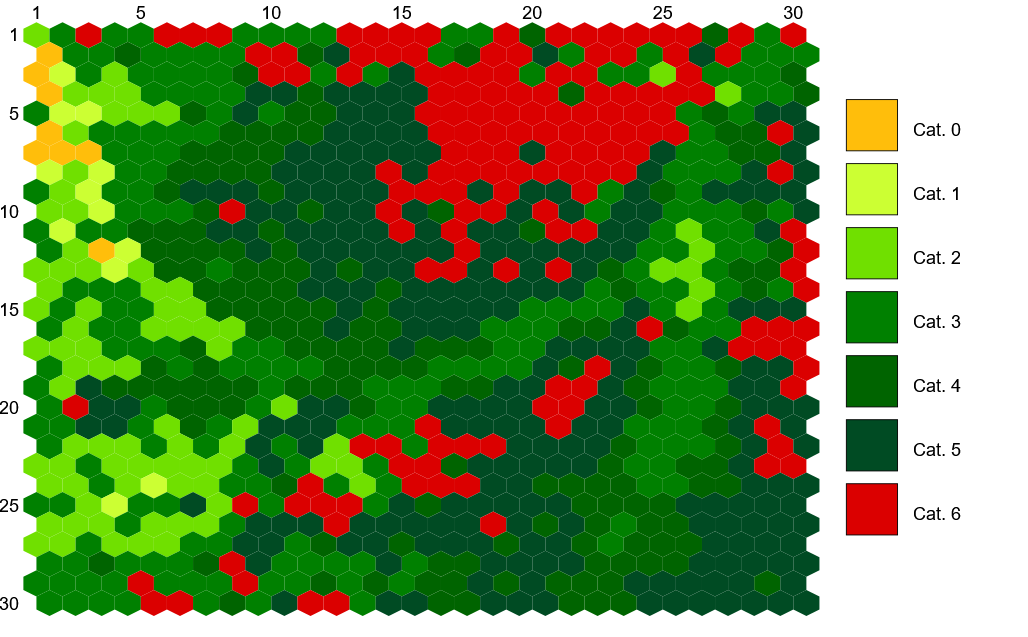
SOM map lattice that represents the population or hits of each neuron or cell through a greyscale (left panel), and their quality category values (right panel)
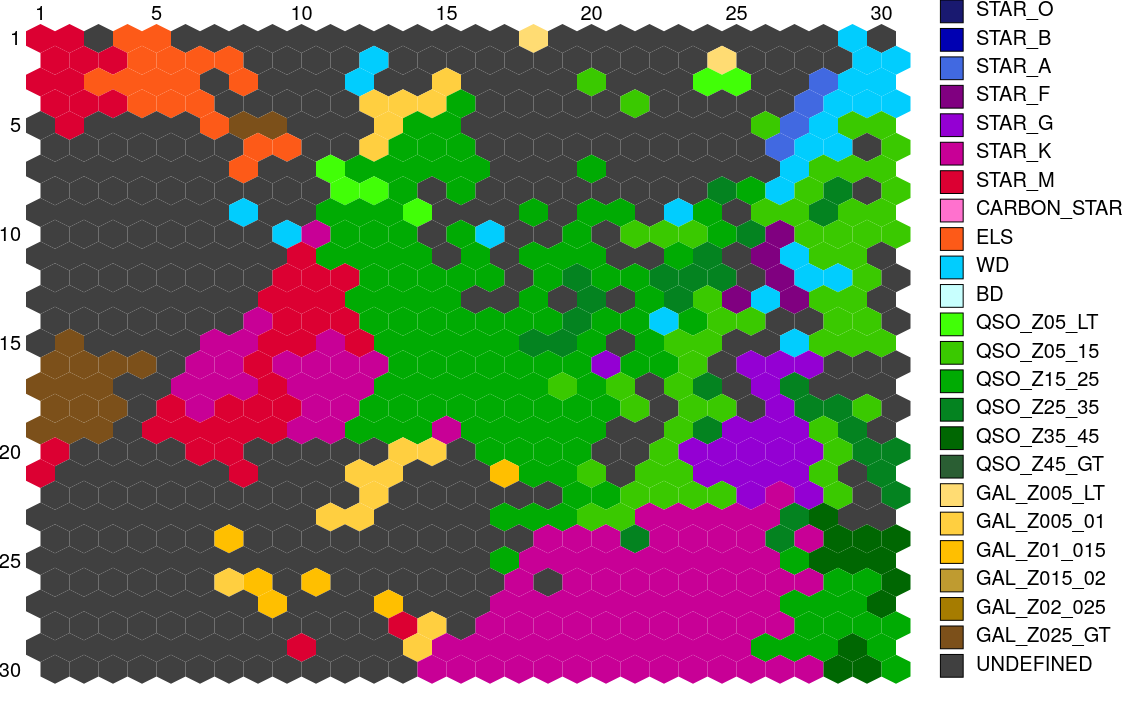
SOM map lattice that represents the basic class labels assigned to each neuron or cell (left panel), and the specific class labels (right panel)
References:
- L. Delchambre, et al.; Gaia Data Release 3: Apsis III - Non-stellar content and source classification; Astronomy and Astrophysics; 2022
- M. A. Álvarez, C. Dafonte, M. Manteiga, D. Garabato and R. Santoveña; GUASOM: an adaptive visualization tool for unsupervised clustering in spectrophotometric astronomical surveys; Neural Computing and Applications; Volume 34(5); 2021
- C. Dafonte, D. Garabato, M. A. Álvarez and M. Manteiga; Distributed Fast Self-Organized Maps for Massive Spectrophotometric Data Analysis; Sensors; Volume 18(5); 1419; 2018
- D. Fustes, M. Manteiga, C. Dafonte, B. Arcay, K. Smith, A. Vallenari, X. Luri; SOM ensemble for unsupervised outlier analysis. Application to outlier identification in the Gaia astronomical survey; Expert System with Applications; Volume 40; 1530-1541; 2013
- D. Fustes, M. Manteiga, C. Dafonte, B. Arcay, K. Smith, R. Borrachero, R. Sordo; An approach to the analysis of SDSS spectroscopic outliers based on self-organizing maps. Designing the outlier analysis software package for the next Gaia survey; Astronomy and Astrophysics; Volume 559; A7; 2013
- D. Ordóñez, C. Dafonte. M. Manteiga, B. Arcay; HSC: A Multi-Resolution Clustering Strategy in Self-Organizing Maps applied to astronomical observations; Applied Soft Computing; Volume 12; 204-215; 2012
Published: 13 June 2022
- Removed a total of (6) style text-align:center;
- Removed a total of (1) style float:right;