
 Sign in
What colour do they have? - Gaia
What colour do they have?
Gaia's blue and red photometer data in DR3
Gaia Data Release 3 gives access for the first time to low-resolution spectra obtained with the blue and red photometers (BP/RP). This great new data set allows the determination of a wealth of astrophysical parameters to better characterize the sources in the Gaia catalogue from temperatures to metallicities, from dust to colour, from stellar age to mass…
Averaged over the observations collected for each source, BP/RP spectra are available for the brightest 220 million objects (with a small selection of fainter objects). These cover the entire sky and all types of objects as can be appreciated in the figure below showing a selection of the catalogue in a Hertsprung-Russell diagram (typically used to study stellar evolution) showing how the spectra change across different stages in the life of stars.
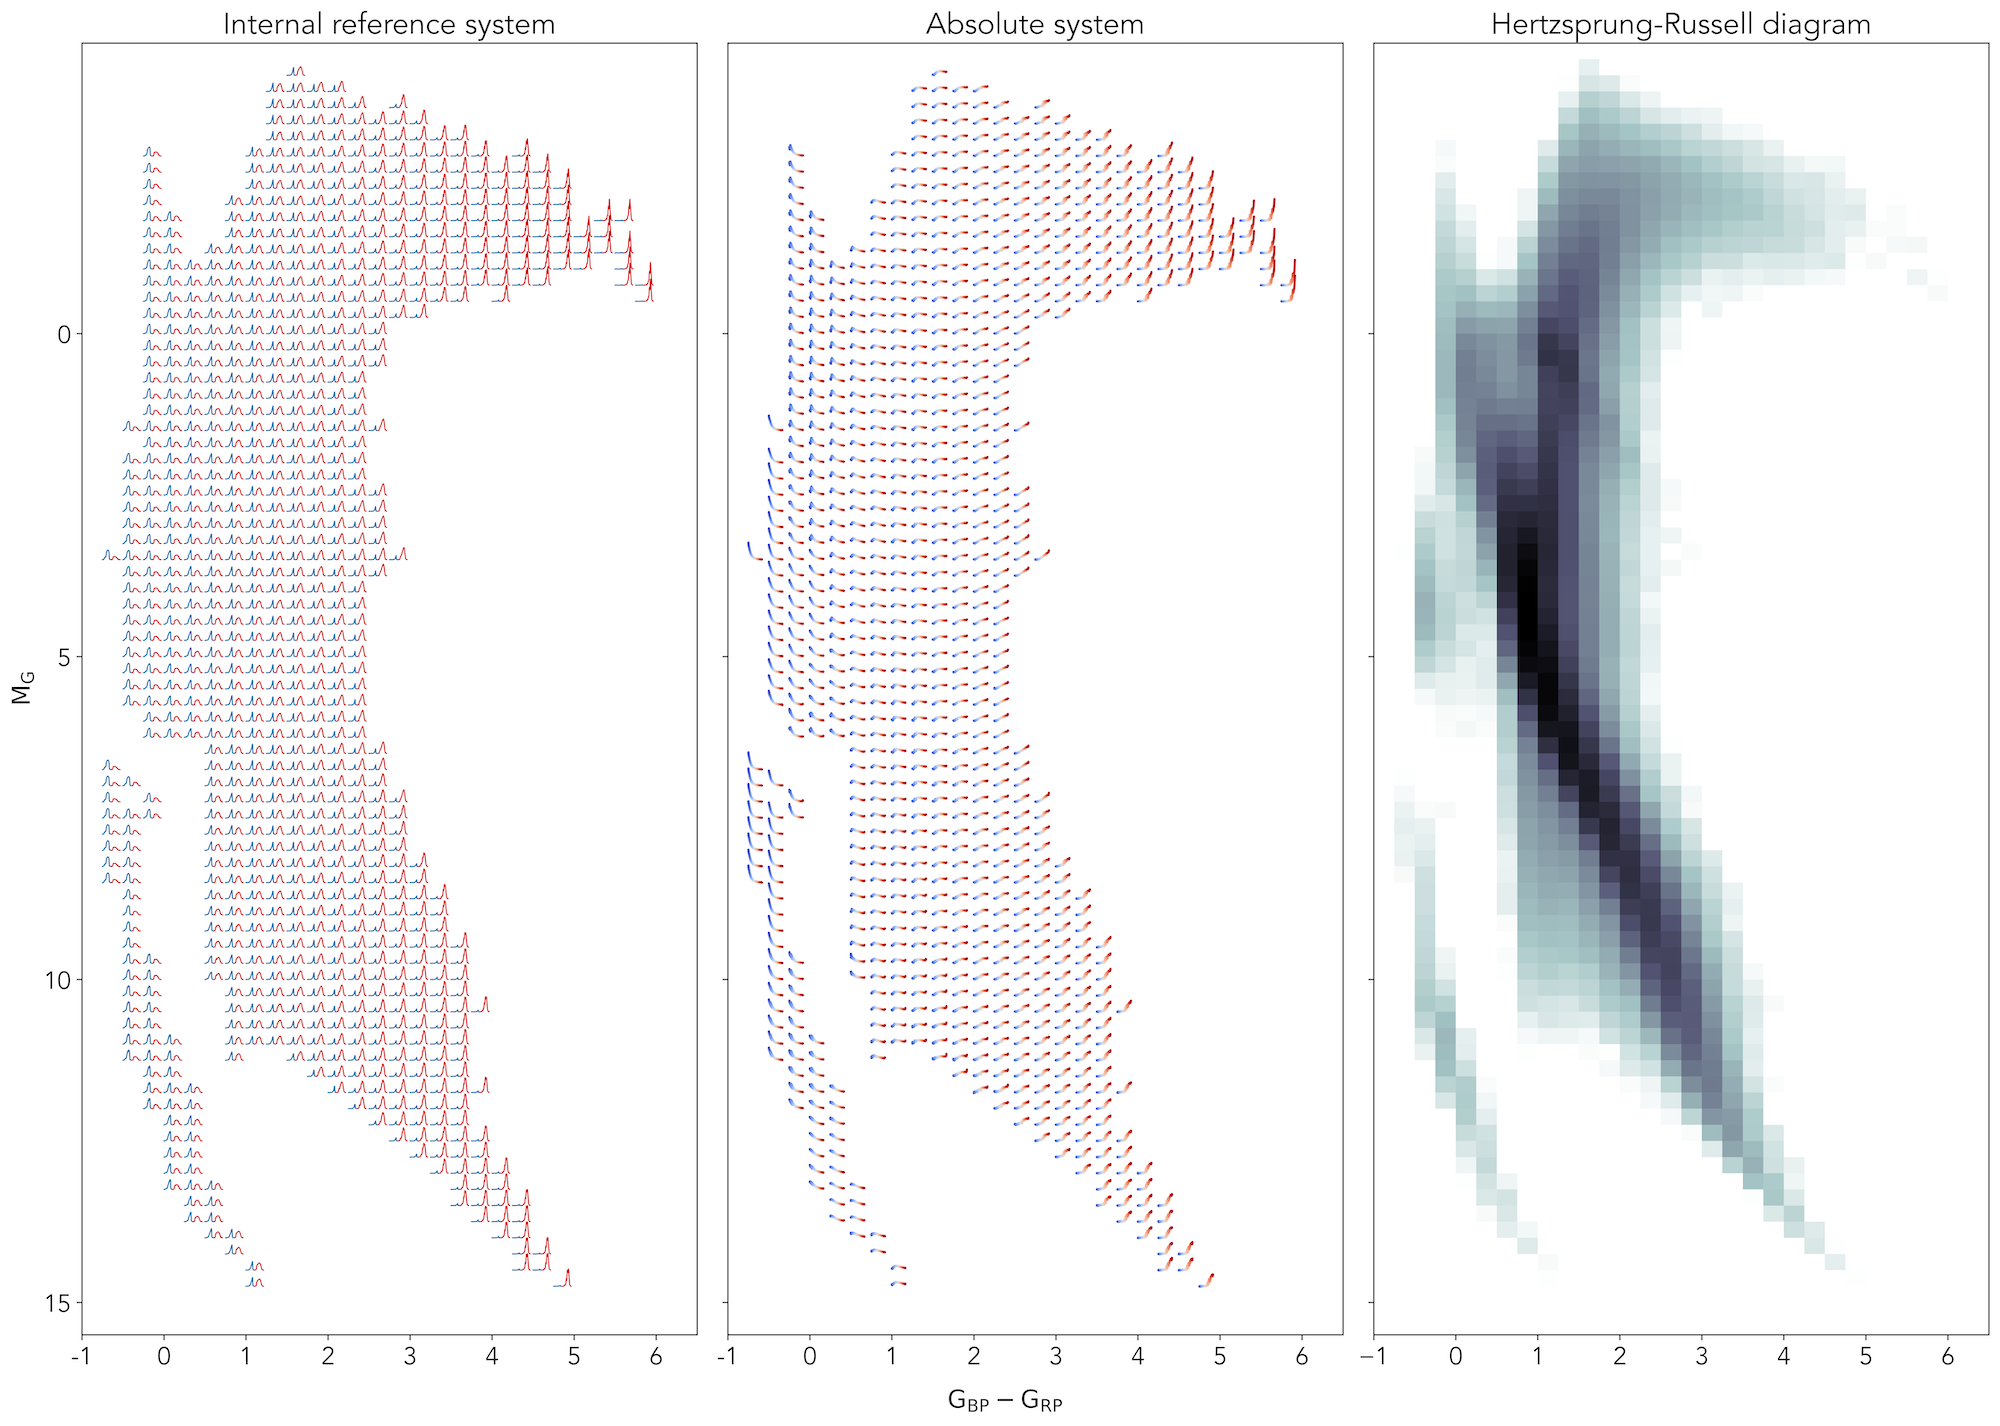
Figure 1: BP/RP spectra from Gaia DR3 in the internal (left panel) and absolute (central panel) systems across the Hertzsprung-Russell diagram (right panel). Image credits: ESA/Gaia/DPAC - CC BY-SA 3.0 IGO. Acknowledgements: ESA/Gaia/DPAC/CU5/DPCI, Z. Kostrzewa-Rutkowska. Published as Gaia DR3 preview here.
Solar analogues
Solar analogues are stars with very similar properties to our Sun. One would expect that in that case, the BP/RP spectra obtained for them are also very similar. But the light coming from them is affected by the medium it has to travel through. The spectra seen by Gaia get distorted in shape because the blue light (at shorter wavelengths) gets absorbed more than the red light (at longer wavelengths). This variation can be used to study the properties of dust in the interstellar medium (ISM).
In the figure below the low-resolution spectra of the solar analogues as seen by the Gaia instrument are shown. This figure has also been animated, and the animated version can be found here.
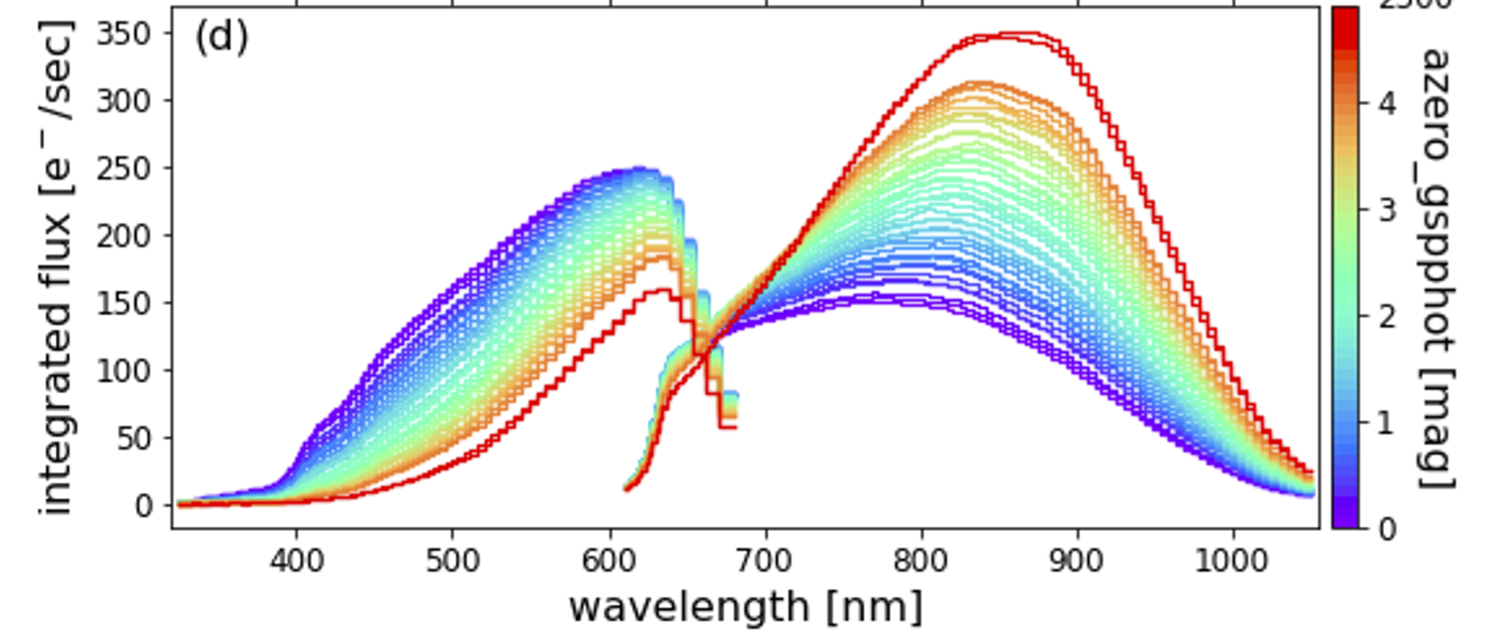
Figure 2. Example of variations in the observed BP and RP spectra due to extinction. The amount of extinction is measured as A0 by GSP-Phot; greater values indicate more ISM extinction. All spectra were rescaled to an apparent magnitude of G = 15 to be able to compare. BP spectra approximately cover the wavelength range from 325 nm to 680 nm and RP spectra from 610 nm to 1050 nm. Credits: from the paper Creevey et al. 2022 - CC BY-SA 3.0 IGO.
The effect of the temperature of a star on its spectrum
While the spectrum of a star can be affected by external sources (e.g. the amount of extinction in the line of sight to the star), it can also be affected by properties of the star itself . In the below animation is shown how the Gaia DR3 low-resolution BP/RP spectra (see De Angeli et al. 2022) change their shape as their effective temperature increases.
The stars selected for this animation have near-zero line of sight extinction, so that the full focus in this animation can go to the effect of the temperature. All BP/RP spectra have been scaled to an apparent G magnitude of 15 mag in order to make their BP/RP spectra comparable.
Cool stars with low temperatures exhibit more flux at long wavelengths than at short wavelengths. They are red. The coolest stars even display molecular absorption bands in the red photometer. As the temperature increases, the fluxes at short wavelengths increase and the stars look increasingly blue.

Figure 3: Animation showing the Gaia BP/RP spectra change their shape as their effective temperature increases for a Gaia DR3 star sample with near-zero extinction in the line of sight. Credit: ESA/Gaia/DPAC- CC BY-SA 3.0 IGO. The images in this animation are adapted from those presented in Gaia Collaboration, Creevey et al. 2022. Acknowledgements: created by Rene Andrae.
Gaia’s sky map of colour
Gaia's mean BP and RP magnitudes were published already in December 2020 with the Early release of a part of Gaia Data Release 3. The below sky map shows the sky in colour based on these Gaia BP and RP magnitudes.
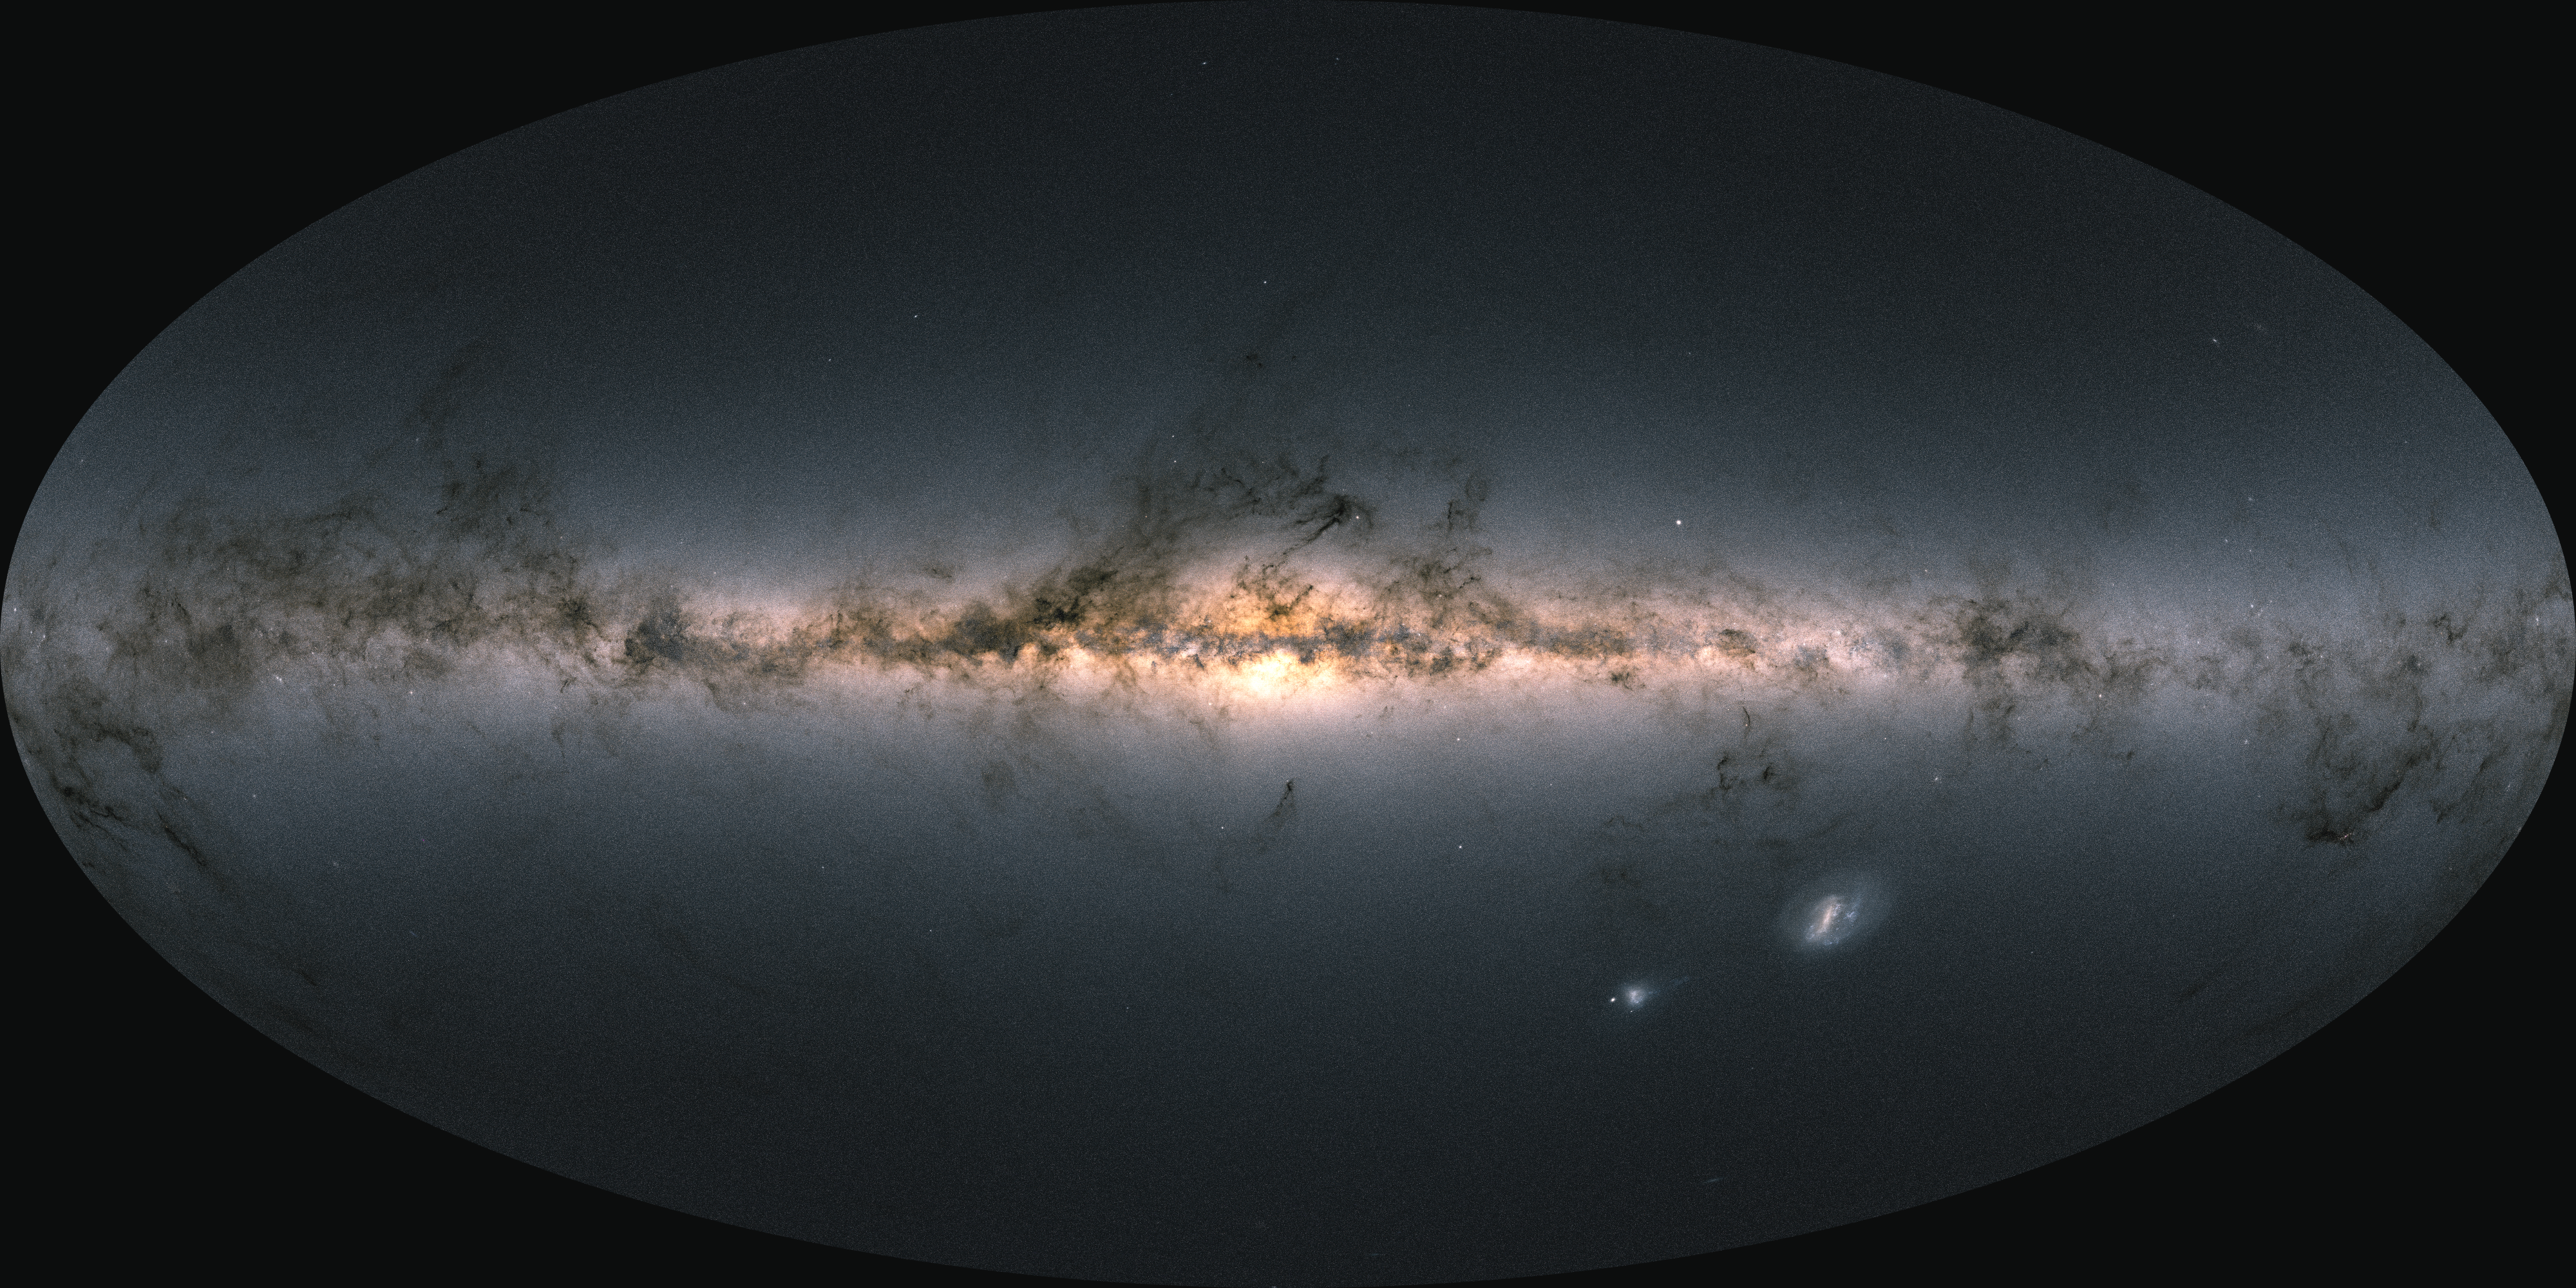
Figure 4: Sky map showing the total brightness and colour of stars observed by Gaia and released as part of Gaia’s Early Data Release 3 (Gaia EDR3). Published here. Credits: ESA/Gaia/DPAC - CC BY-SA 3.0 IGO.
Synthetic photometry
Thanks to the high precision of the spectra and to the accurate calibration in flux, it is also possible to derive accurate colours of all these sources in different (both well-known and not-yet implemented) systems as a helpful tool to calibrate other catalogues and assess performances of future instruments (as explained in the paper Gaia Collaboration, Montegriffo et al. 2022).
As we have seen so far, celestial sources are coloured! At first approximation, the stars are hotter if they are bluer (shorter wavelengths), or colder if they are redder. Astronomers found that the observed colours for the stellar sources are tied as well to other properties of stars, like the metallicity, the evolutionary stage, the dust attenuation on the line of sight.
Combinations of specific colours thus have a strong scientific meaning, and they can lead to the determination of the properties of the observed sources. The more accurately the colour is measured, the better defined the properties, which in turn allow to discriminate the different stellar types, a huge step forward towards a more dedicated follow-up from other facilities.
Starting with the Gaia spectra, we can generate specific colours of a given source, as if observing them with a different telescope, even a non-existing one.
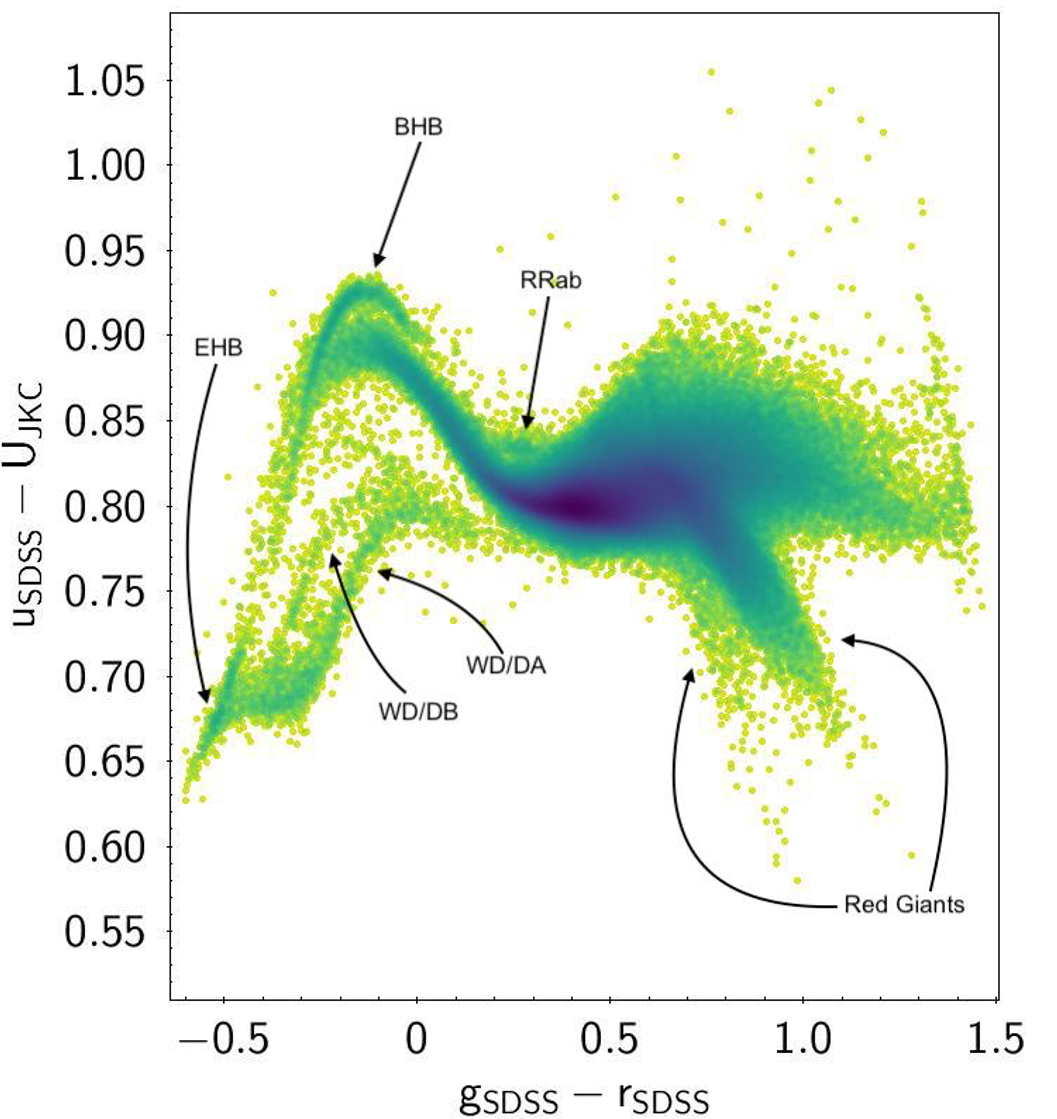
Figure 5: Colour-colour diagram generated by combining the Johnson-Kron-Cousins U magnitude, and magnitudes in the SDSS system (u, g, r) as measured from the Gaia XP spectra using synthetic photometry. Some loci of the stellar evolutions are marked (Red Giants; BHB: Blue Horizontal Branch; EHB: Extreme HB; RRab: RR Lyrae stars; WD/DA, WD/DB: White Dwarfs of type DA and DB). Image credits: ESA/Gaia/DPAC - CC BY-SA 3.0 IGO. Acknowledgements: M. Bellazzini.
Credits: ESA/Gaia/DPAC
Story written by Tineke Roegiers, Rosanna Sordo, Francesca De Angeli, Dafydd Wyn Evans
Published: 13 June 2022
- Removed a total of (12) style text-align:center;
- Removed a total of (12) style text-align:justify;
More Gaia DR3 stories?
Where are the stars? How far away are they? How bright are the stars?
What colour do they have? What are the stars made of?
Where do they go? Where do they come from? Do they approach us? Do they move away?
Did something move in front of the star? What is in between the stars?
How big, warm, old, ... are they? How do they Blink?
Is it a double star? Do they go boom? Is it a galaxy?
Is it a solar system object? Is it a quasar?
Who created the data? Can I Use Gaia data with other observatories?
How did DPAC produce the data for this star? Where is the data?
-
ESA's press release of Gaia Data Release 3
-
Gaia's Early Data Release 3 stories
-
ESA's press release of Gaia Early Data Release 3
- Removed a total of (16) style text-align:center;
- Removed a total of (1) style float:right;