
 Sign in
Gaia Data Release 3: Gaia astrometry highlighted - Gaia
where are the stars?
Gaia's astrometry highlighted
The largest structure in the Milky Way is easily seen from Earth. Looking up into the sky, the clear bright band of stars shows the Milky Way to be a flat disc with the largest population of stars in the direction of the galactic centre. We know from observations taken of other disc galaxies that many have typically a spiral form with several arms. While we can observe other galaxies in their entirety, getting a good overview of our own galaxy is a lot more complicated. We are embedded in the Milky Way and see only the stars and dust clouds around us. Much like looking at a forest from within as opposed to viewing it from an airplane, we cannot see the entire forest for all the trees.
The Galaxy is made up of a disc of stars with gas and dust between them. The central portion of the Milky Way is called the Galactic Bulge with an elongated shape at the centre called the bar. Beyond the disc and bulge is the stellar halo (see the anatomy of the Milky Way for more details).

Figure 1: Combination of a density representation of the young star sample on top of an artistic impression of the Milky Way. Credit: ESA/Gaia/DPAC, CC BY-SA 3.0 IGO. Acknowledgements: The overlay was created by Kevin Jardine based on data from the paper "Gaia Data Release 3: Mapping the asymmetric disc of the Milky Way" by Gaia Collaboration, Drimmel, et al. 2022. The background Milky Way artistic impression was created by Stefan Payne-Wardenaar.
With Gaia’s precise positions, we are able to see detailed structures in the Sun’s vicinity. The signature of the spiral arms closest to us are already seen in many data sets using Gaia DR2 and Gaia EDR3. Gaia’s data release 3 brings further improvements to our knowledge of the arms closest to the Sun. The astrophysical parameters from Gaia DR3 allow to differentiate between the young stars (OB stars) and the old stars (Red Giant Branch stars).
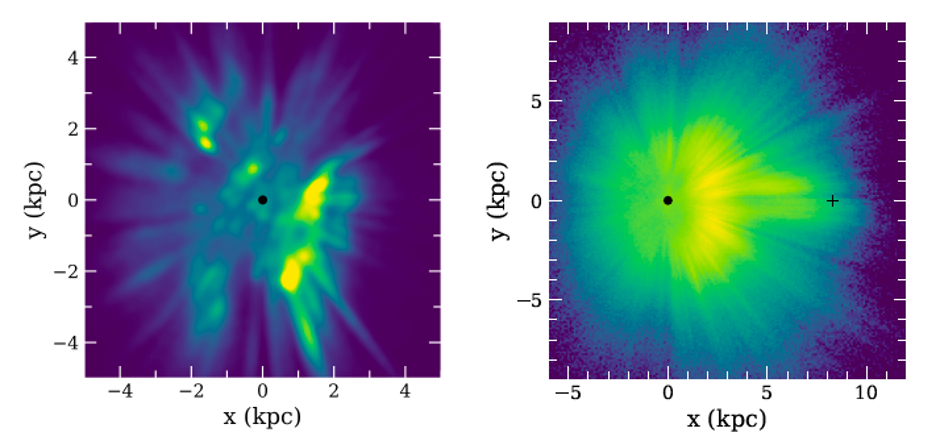
Figure 2: Spatial distribution mapping of star samples. Left panel: young star sample. Right panel: old star sample. Credits: images taken from the paper "Gaia Data Release 3: Mapping the asymmetric disc of the Milky Way" by Gaia Collaboration, Drimmel, et al. 2022 - CC BY-SA 3.0 IGO.
In the paper "Gaia Data Release 3: Mapping the asymmetric disc of the Milky Way" by Gaia Collaboration, Drimmel, et al. 2022 the spatial distribution mapping is compared with the current state of our knowledge on Milky Way arms. In the left panel of Figure 2, the young star sample shows clear clumps of stars along longer segments stretching from bottom to top right, the spiral arms. In the right panel though, no clear structures are seen in the old star sample. This is due to older stars being more dispersed with respect to younger stars, which trace the star formation that happens principally in the spiral arms. The radial features seen are due to extinction changing along different lines of sight.
Using the young stars, a density map was created, highlighting different density regions with surfaces of equal density. In Figure 3, four of these surfaces are shown, the denser regions embedded within the less dense regions. To better visualize the different densities, the surfaces have been placed on top of one another from a “top down” perspective, to make it resemble the more familiar terrestrial elevation maps with “mountains” representing the denser regions of stars.
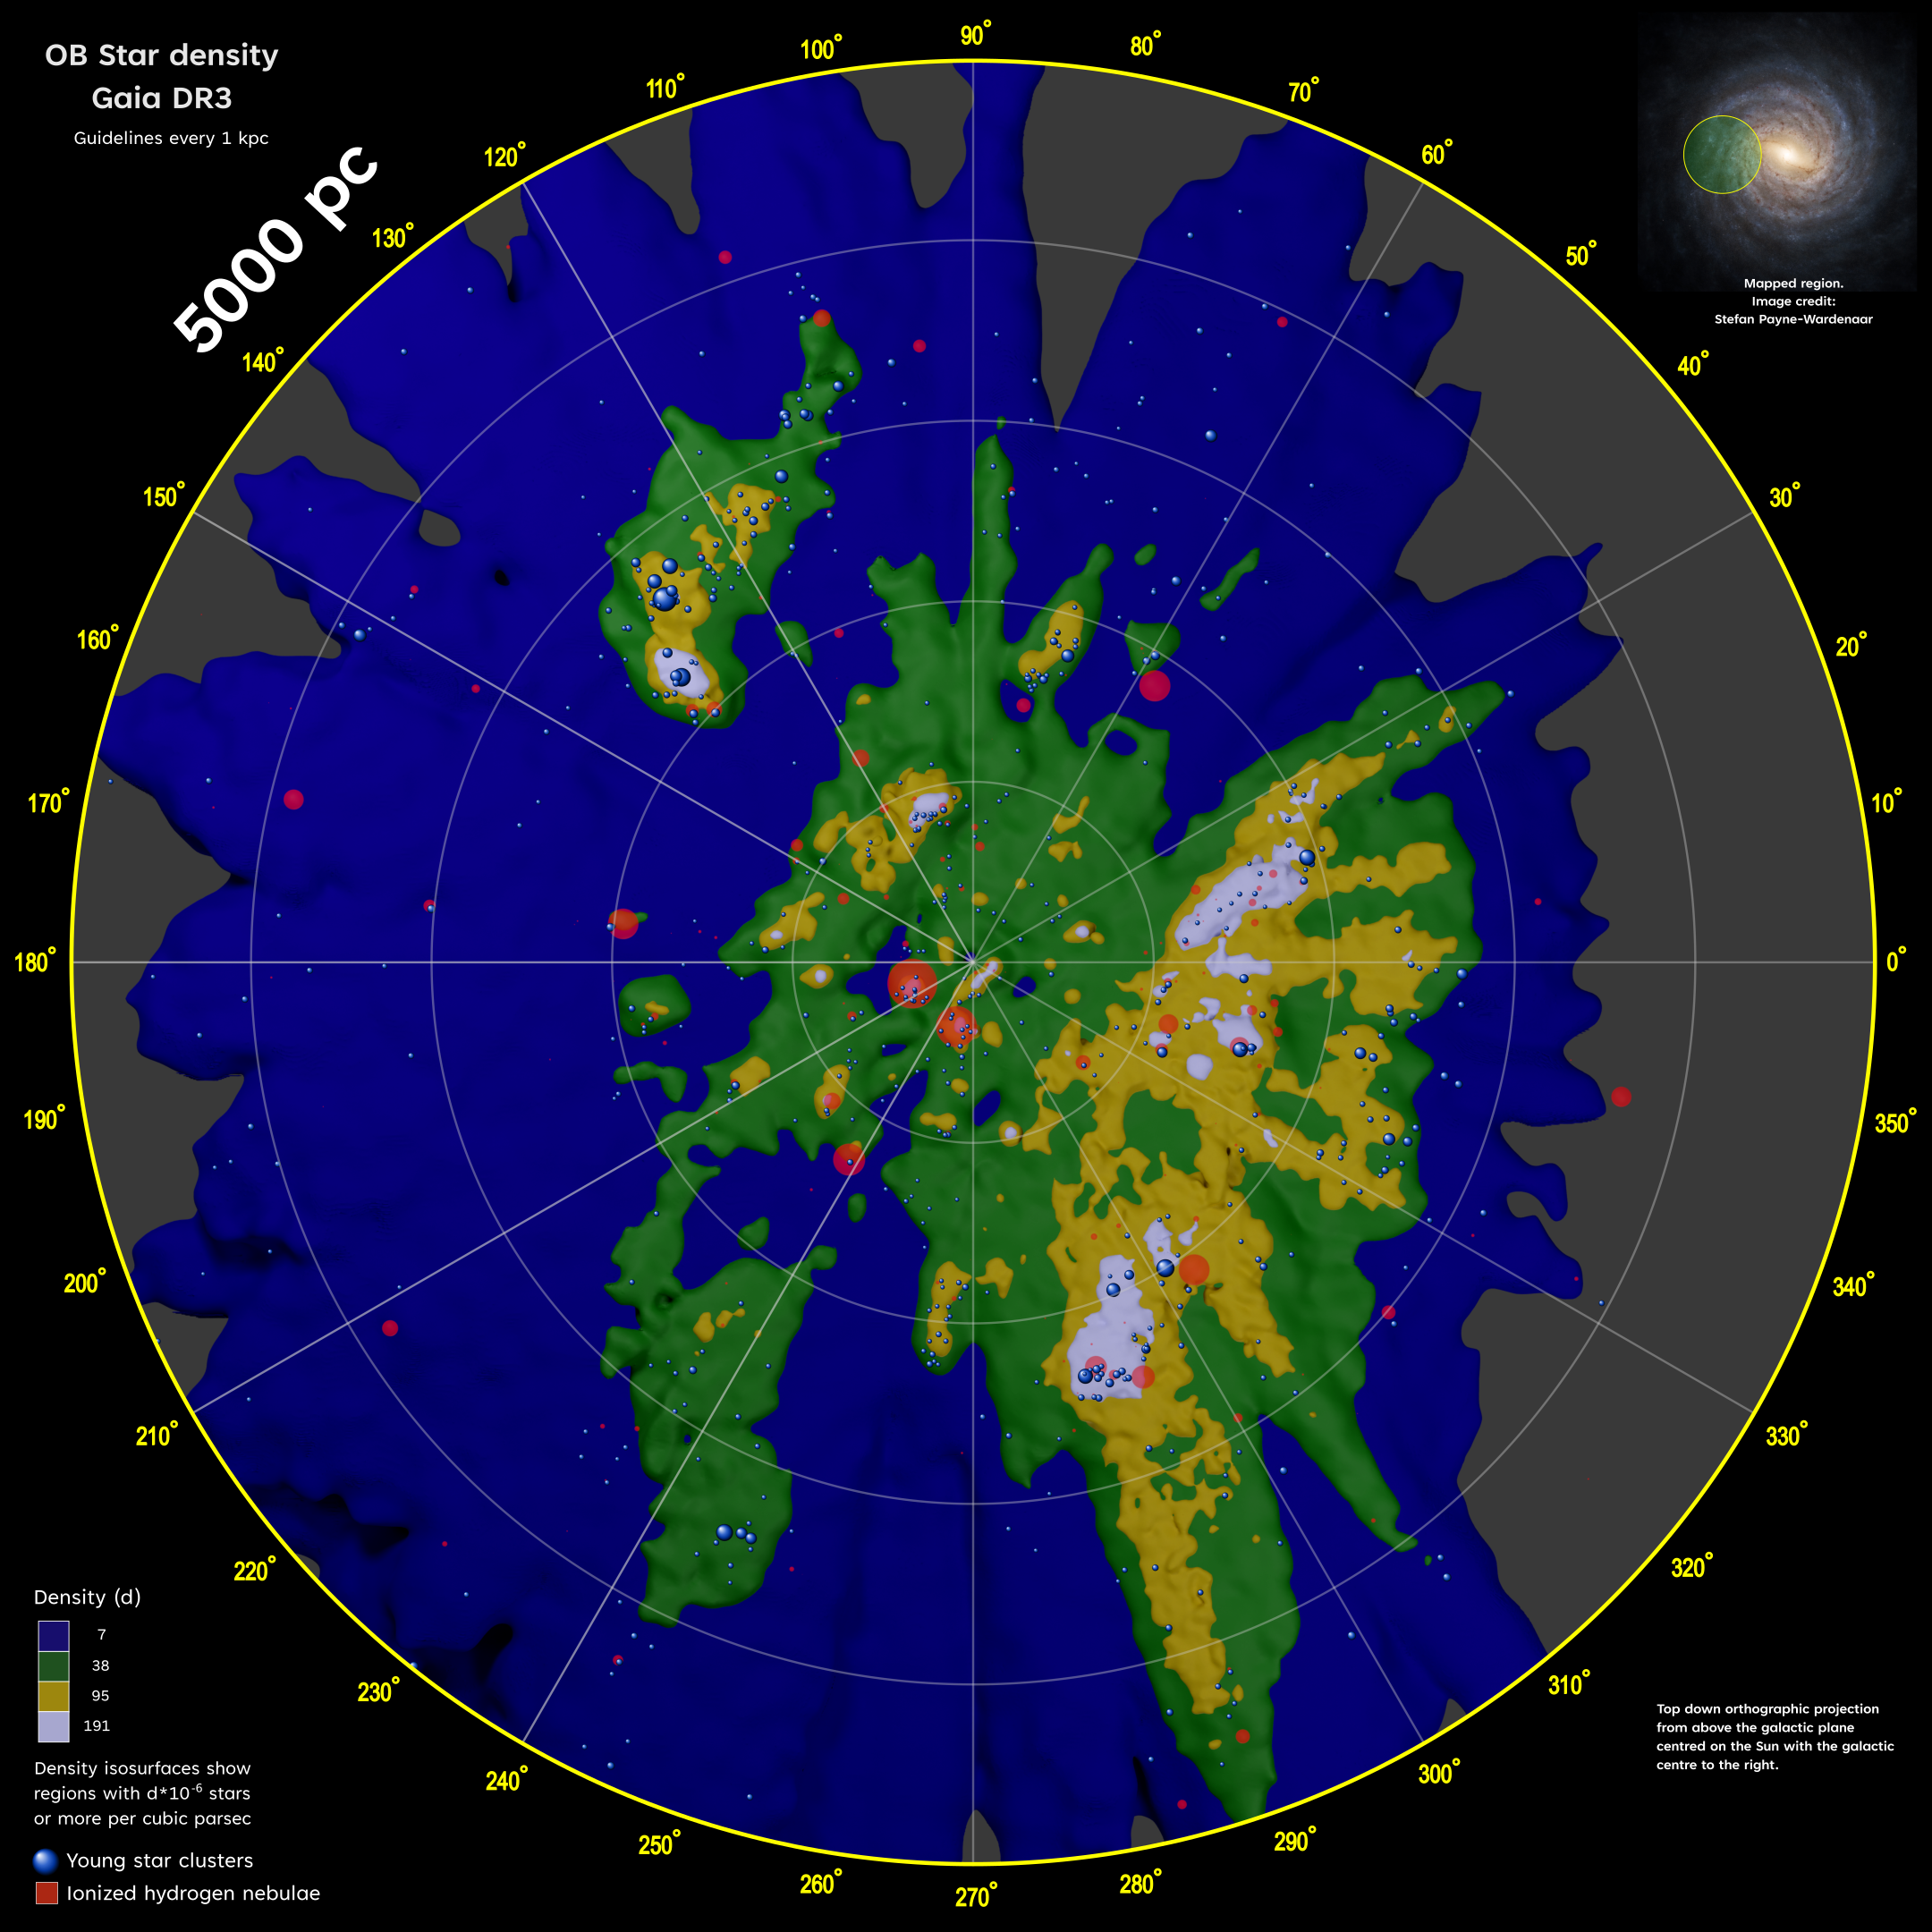
Figure 3: The density of the OB star sample out to 5 kpc from the Sun is provided on this image in the form of isodensity surfaces. The isodensity surfaces provide insight in the structure of our galaxy. The higher the density, the more young stars are found in this area. The lower the density, the less stars. This image also contains young star clusters with an age less than 40 million years, rendered using a radius based on the number of luminous members with absolute magnitude brighter than 0; as well as HII regions with distances based on known ionizing star clusters or known ionizing stars in Gaia EDR3. Credit: ESA/Gaia/DPAC, CC BY-SA 3.0 IGO. Acknowledgements: This poster was created by Kevin Jardine, based on data from the paper "Gaia Data Release 3: Mapping the asymmetric disc of the Milky Way" by the Gaia Collaboration, Drimmel, R., et al. 2022.
Looking in closer detail to the young sample obtained from Gaia DR3, a plot of over-density of the OB stars from the paper “Gaia Data Release 3: Mapping the asymmetric disc of the Milky Way” by Gaia Collaboration, Drimmel, et al. 2022 is in great agreement with the recently published paper by Poggio et al. 2021 on this same topic, which was based on Gaia EDR3 data, but with stars selected using near-infrared photometry. These newest results thus confirm that the Local (Orion) arm that passes close to the Sun’s position is indeed longer than previously thought, and is not a minor “spur” of another arm. In general these maps show more detail in directions poorly mapped by past studies, and suggest that the geometry of the spiral arms in our galaxy may need some revision.
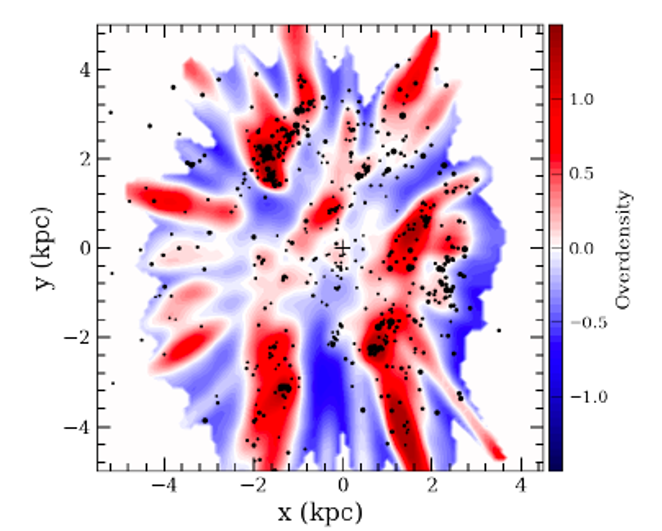
Figure 4: Over-density plot of the OB stars sample, where the imprint of the spiral arms is clearly distinguished. Image credits: “Gaia Data Release 3: Mapping the asymmetric disc of the Milky Way” by Gaia Collaboration, Drimmel, et al. 2022 - CC BY-SA 3.0 IGO.
The paper “Gaia Data Release 3: Chemical cartography of the Milky Way Gaia Collaboration, Recio-Blanco, A., et al.” also extracted a sample of massive stars based on the even more precise astrophysical parameters that can be obtained for the brightest stars, in this case, they were derived with spectroscopic data. A map of the positions of this sample also shows the structure of the nearby spiral arms as well (see Figure 6). This sample consists of massive bright stars hotter than the Red Giants branch. The arms seen here are again in nice agreement with the figures above and the results from Poggio et al. 2021.
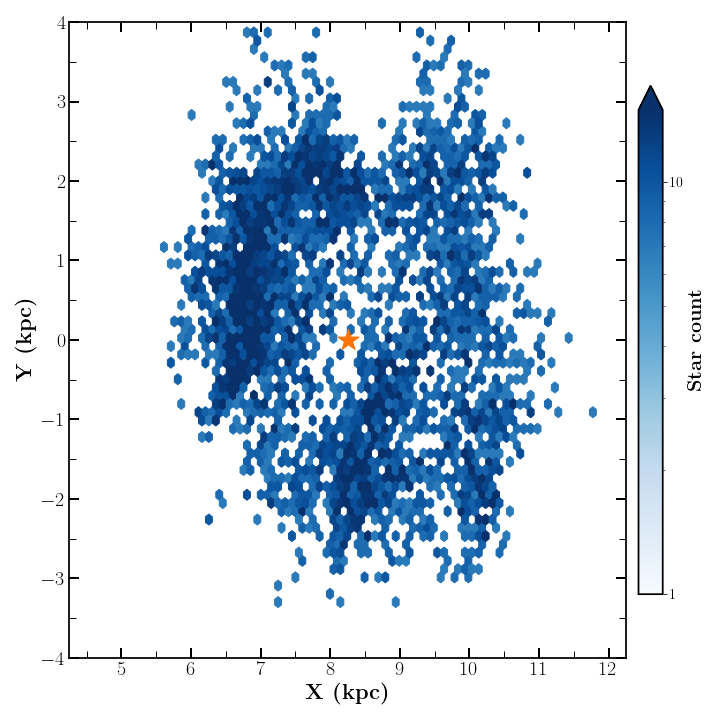
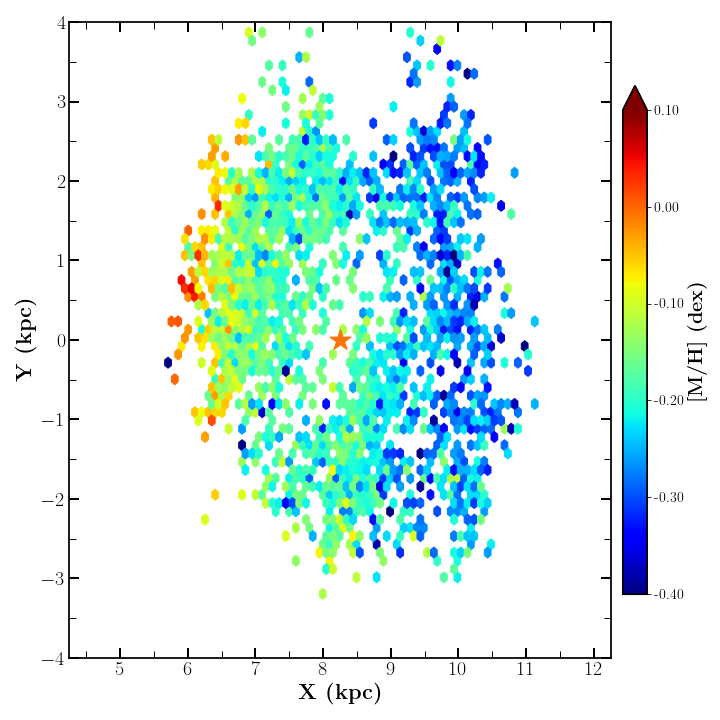
Figure 5: Plot of a sample of massive bright stars, hotter than the Red Giants branch. The spiral arms can be seen in the panel on the left, which shows the star count of this sample in galactic coordinates. The panel on the right shows the amount of metals (elements other than hydrogen or helium) present in this sample. A result highlighted in our story on "what are stars made of?". These images are flipped as compared to the images in Figures 1,2,3 and 4. Image credit: "Gaia Data Release 3: Chemical cartography of the Milky Way" by the Gaia Collaboration, Recio-Blanco, A., et al. 2022 - CC BY-SA 3.0 IGO
While lots of structures are seen by investigating clumps of stars, they can also be revealed from the kinematic investigation of our Milky Way. This topic is investigated in more detail in our story on Gaia’s radial velocities. The mapping of the local arm and surroundings helps us to understand the Milky Way and our place in it. While much of the metropolis of the Milky Way remains to be mapped in detail, Gaia is allowing us to extend our street-level knowledge beyond our immediate neighbourhood. Much like we once mapped the Earth, we now map further and further out into the Milky Way, expanding our knowledge a bit at a time.
Video: Zoom-in into our local neighbourhood starting from the Milky Way artistic impression all the way to the Earth and Moon, passing through: (1) Milky Way artistic impression by Stefan Payne-Wardenaar, (2) Density maps created by Kevin Jardine of the hot star data for the paper "Gaia Data Release 3: Mapping the asymmetric disc of the Milky Way" by the Gaia Collaboration, Drimmel, R., et al. 2022, (3) Density maps created by Kevin Jardine for the paper "Gaia Early Data Release 3: The Gaia Catalogue of Nearby Stars" by the Gaia Collaboration, R.L. Smart, et. al. 2020, (4) Density map created by Kevin Jardine for the 10 parsecs sample from the paper "The 10 parsec sample in the Gaia era" by C. Reylé et.al. 2021. Combining the model with maps at three different scales allows a video showing a fly in from the entire galaxy right to the Earth. Credits: see at the bottom of the page.
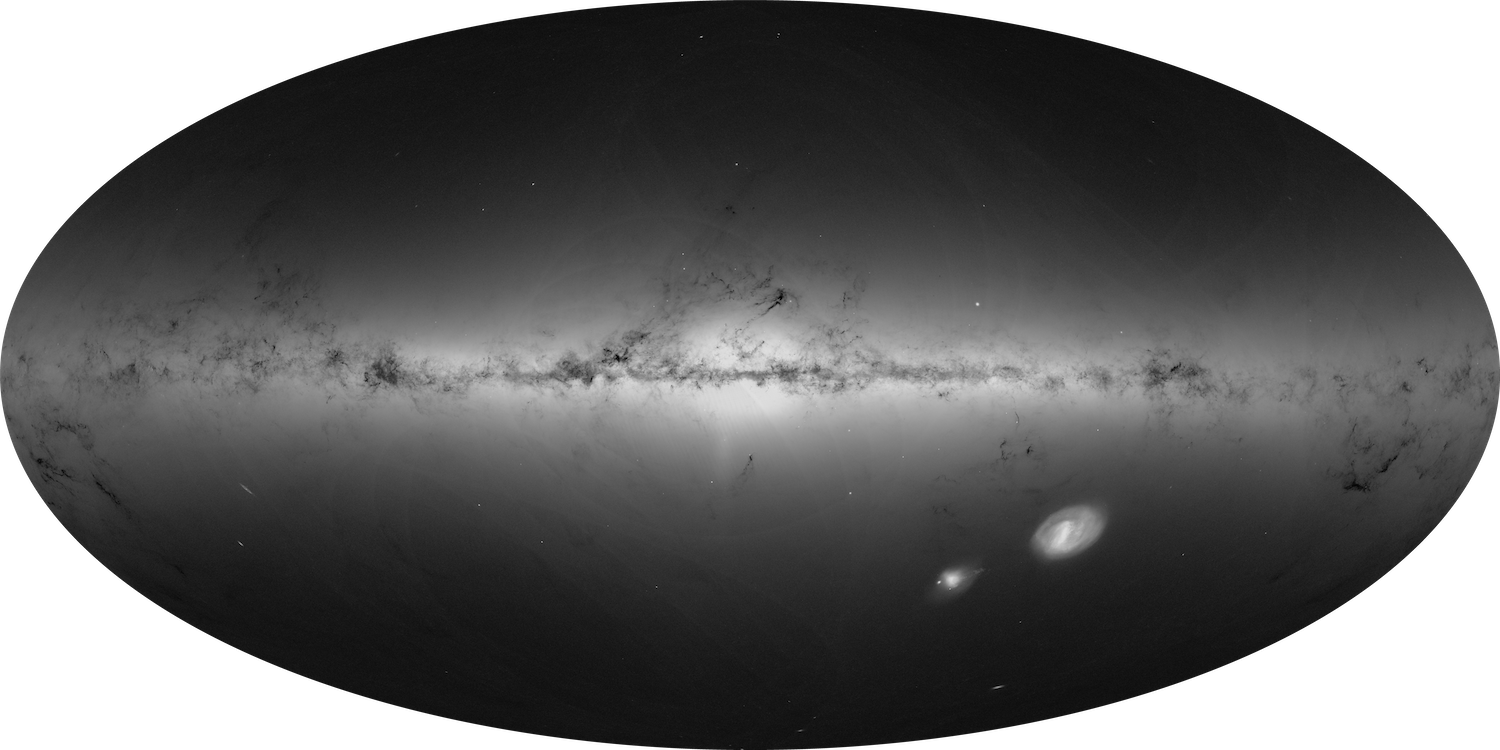
Figure 6: Sky map of source density of Gaia's Early Data Release 3, equally applicable to Gaia DR3. ESA/Gaia/DPAC, CC BY-SA 3.0 IGO.
Credits: ESA/Gaia/DPAC
Story written by Tineke Roegiers, Ronald Drimmel, Orlagh Creevey, Anthony Brown
Credits video zoom into the Milky Way video:
- ESA/Gaia/DPAC
- Hot star density and bar orientation from "Gaia Data Release 3: Mapping the asymmetric disc of the Milky Way" by the Gaia Collaboration, R. Drimmel, et al. 2022.
- Dust from "Three-dimensional extinction maps: Inverting inter-calibrated extinction catalogues" by J.R. Vergely, R. Lallement and N.L.J. Cox, 2022.
- Young star clusters updated from data originally described in "Painting a portrait of the Galactic disc with its stellar clusters" by T. Cantat-Gaudin, et. al. 2020.
- HII region positions determined by known ionizing stars and clusters with sizes estimated using Douglas Finkbeiner's H-alpha Full Sky Map and distances taken from "Estimating Distances from Parallaxes. V. Geometric and Photogeometric Distances to 1.47 Billion Stars in Gaia Early Data Release 3" by C.A.L. Bailer-Jones et.al. 2021.
- Stars within 100 parsecs from "Gaia Early Data Release 3: The Gaia Catalogue of Nearby Stars" by the Gaia Collaboration, R.L. Smart, et. al. 2020.
- Stars within 10 parsecs from "The 10 parsec sample in the Gaia era" by C. Reylé et.al. 2021.
- Hydrogen clouds within 10 parsecs illustrated by NASA based on research by J. Linsky and S. Redfield.
- The image of the Earth and Moon was taken by NASA's Galileo spacecraft in 1992.
- The 3D model of the Milky Way was constructed in Blender by Stefan Payne-Wardenaar.
- Galactic cartography by Kevin Jardine.
Published 13 June 2022
- Removed a total of (17) style text-align:center;
- Removed a total of (8) style text-align:justify;
More Gaia DR3 stories?
Where are the stars? How far away are they? How bright are the stars?
What colour do they have? What are the stars made of?
Where do they go? Where do they come from? Do they approach us? Do they move away?
Did something move in front of the star? What is in between the stars?
How big, warm, old, ... are they? How do they Blink?
Is it a double star? Do they go boom? Is it a galaxy?
Is it a solar system object? Is it a quasar?
Who created the data? Can I Use Gaia data with other observatories?
How did DPAC produce the data for this star? Where is the data?
-
ESA's press release of Gaia Data Release 3
-
Gaia's Early Data Release 3 stories
-
ESA's press release of Gaia Early Data Release 3
- Removed a total of (16) style text-align:center;
- Removed a total of (1) style float:right;