
 Sign in
Can I use the DR3 data with data from other missions or observatories - Gaia
Can I use Gaia DR3 data with other missions or observatories?
Using Gaia's data for follow-up
While there is plenty to explore in Gaia’s data release 3 alone, there is great power in combining Gaia data with the data from other observatories. Gaia data can provide new insights when combined with existing data, but can equally ensure more efficient use of telescope time for current and future observations on specific objects.
A telescope, and instrument, are made with a specific purpose in mind, to provide additional information for selected science cases. Based on this goal, the most suitable wavelength range is picked for the instrument. Measurements from different instruments are bound to provide different information, and combining them in a correct way can be quite complex.
When trying to combine measurements from different telescopes, a number of problems arise. How do they relate to each other? Does their sky coverage overlap? Do we have stars in common to understand how the different sets of measurements can come into agreement? Do we have enough variety of sources to fully address all the differences? We would naively think that measurements based on the same photometric system would be free of these problems, but they are not. The site of choice is important, to determine the quality of the data achieved, so is the procedure adopted to transform the raw measurements into data.
The power of the all-sky, magnitude-limited Gaia survey is the homogeneity in the data calibration, providing measures in the same reference system for all types of sources, everywhere. The procedure of calibration of the Gaia data is proven to be of extremely high quality, both in the photometry and in the spectrophotometry, down to the limiting magnitude of the survey.
An accurate procedure of cross-matching allows to easily retrieve measurements from the same source across different sets of widely known catalogues. Cross-match tables are provided for the catalogues Hipparcos-2, Tycho-2 + TDSC merged, 2MASS PSC (merged with 2MASS XSC), SDSS DR13, Pan-STARRS1 DR1, SkyMapper DR2, GSC 2.3, APASS DR9, RAVE DR5, allWISE, URAT-1, and RAVE DR6. Some can be found in Gaia's Early Data Release 3, but are equally applicable to the sources in Gaia Data Release 3 (the source IDs are the same for EDR3 and DR3).
To allow for more efficient use of current and future observatories, Gaia can help select the most suitable targets for follow-up observations. Specific data sets in the Gaia Data Release 3 catalogue are especially interesting for follow-up with other observatories.
In the exoplanet field for example, Gaia provides a great sample of host stars. The astrophysical properties provided by Gaia for these stars help to better understand the nature of the planets, whether they are habitable, and how old they are.
In Gaia collaboration Creevey et al. a high quality sample of F-, G-, K-, and M-type stars (often referred to as FGKM stars and have masses between 0.3 and 1.6 times the mass of the Sun) is selected, a small fraction of which are known to already host exoplanets. The exoplanets have been detected by many scientists over the last 20 years, using various observatories to measure the planetary signals in their photometric or spectroscopic data (see Figure 1). A huge effort by the community has been made to make these data easily accessible to the public so scientists can advance more efficiently in this research.
Figure 1: Animation explaining the astrometric detecting of binaries by Gaia. Credits: ESA/Gaia/DPAC - CC BY-SA 3.0 IGO. Acknowledgements: ESA/Gaia/DPAC/CU4/NSS, Nathalie Bauchet. More info on double stars here.
Gaia also contributes to finding and characterising new exoplanets using its astrometric, photometric and spectroscopic capabilities. The current information about Gaia (candidate) exoplanets can be found on this webpage, where a list is also provided giving the Gaia planet candidate name, corresponding source ID of the host star, and planet status.
To know what a planet is made of, such as rock, gas, or ice, the so-called “bulk properties” of the planet, one must know the planetary radius and mass, which combined give the mean density or its ‘bulk’. However, most of the existing data only provides information on the relative size and mass of the planet compared to the host-star. These data were combined with the stellar properties in Gaia Data Release 3 for 354 known exoplanets to estimate their radius and for 94 of these planets also their mass could be estimated. Additionally, the Gaia data provides an estimate of the age of the stellar system.
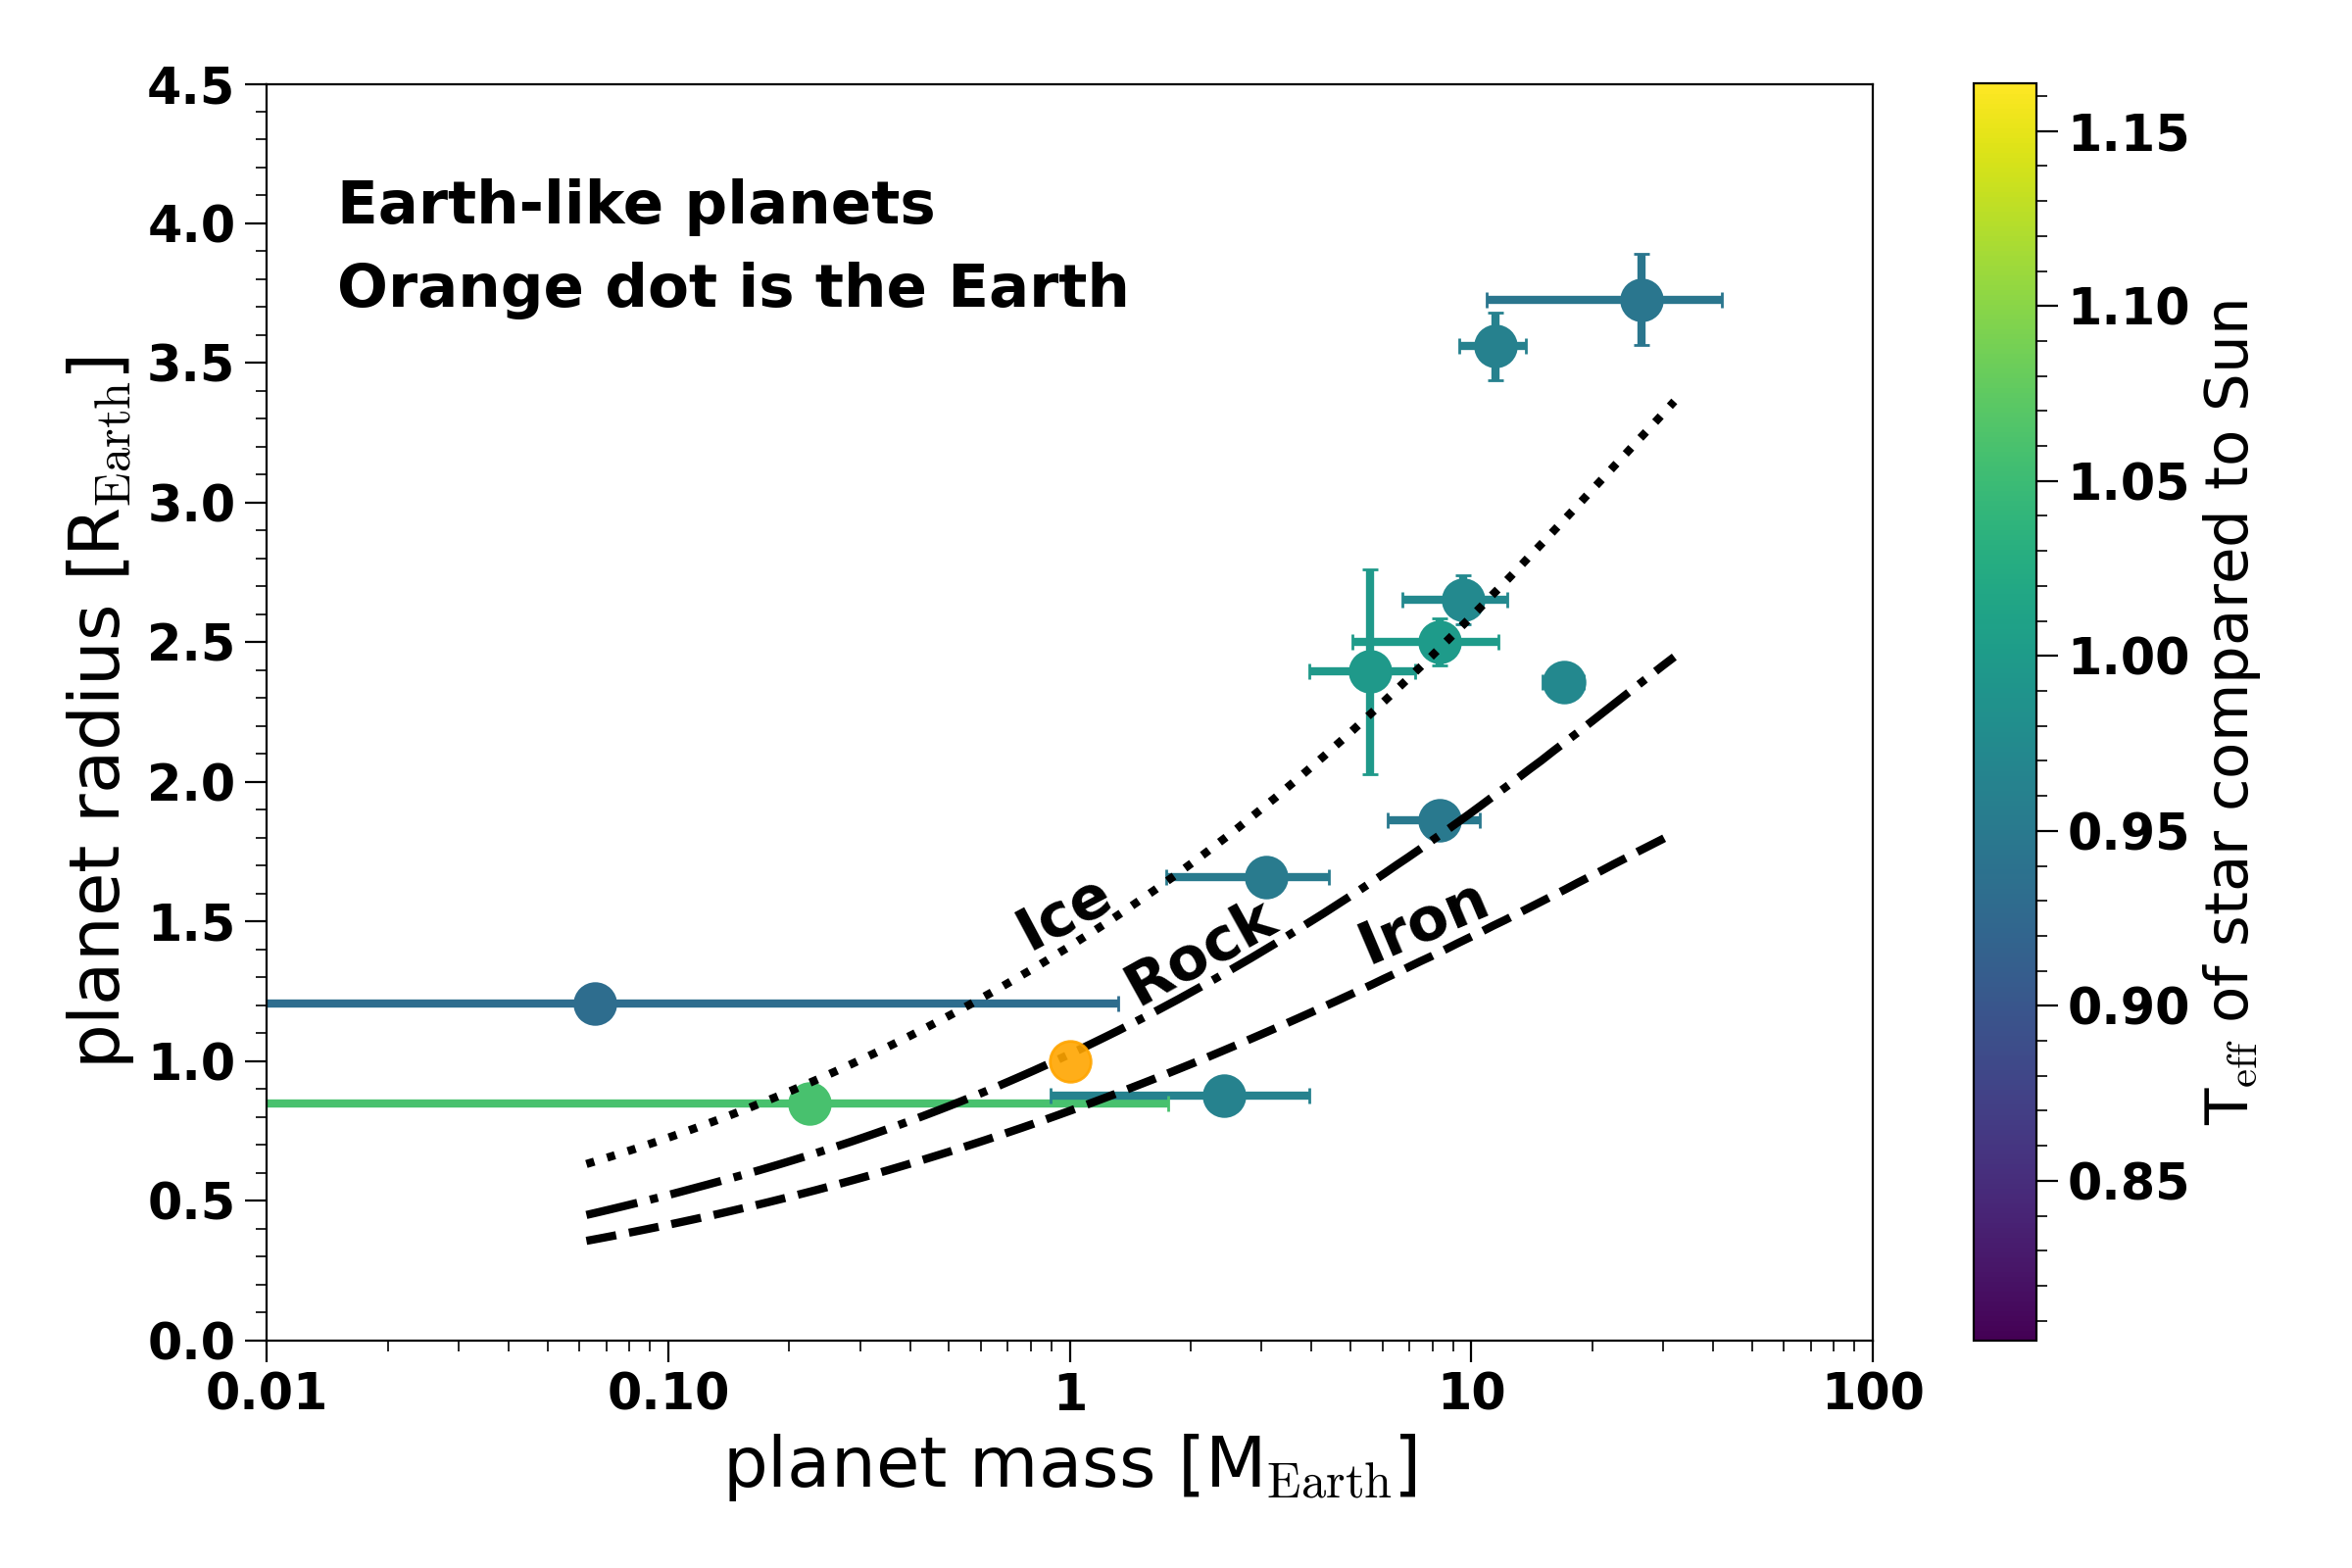
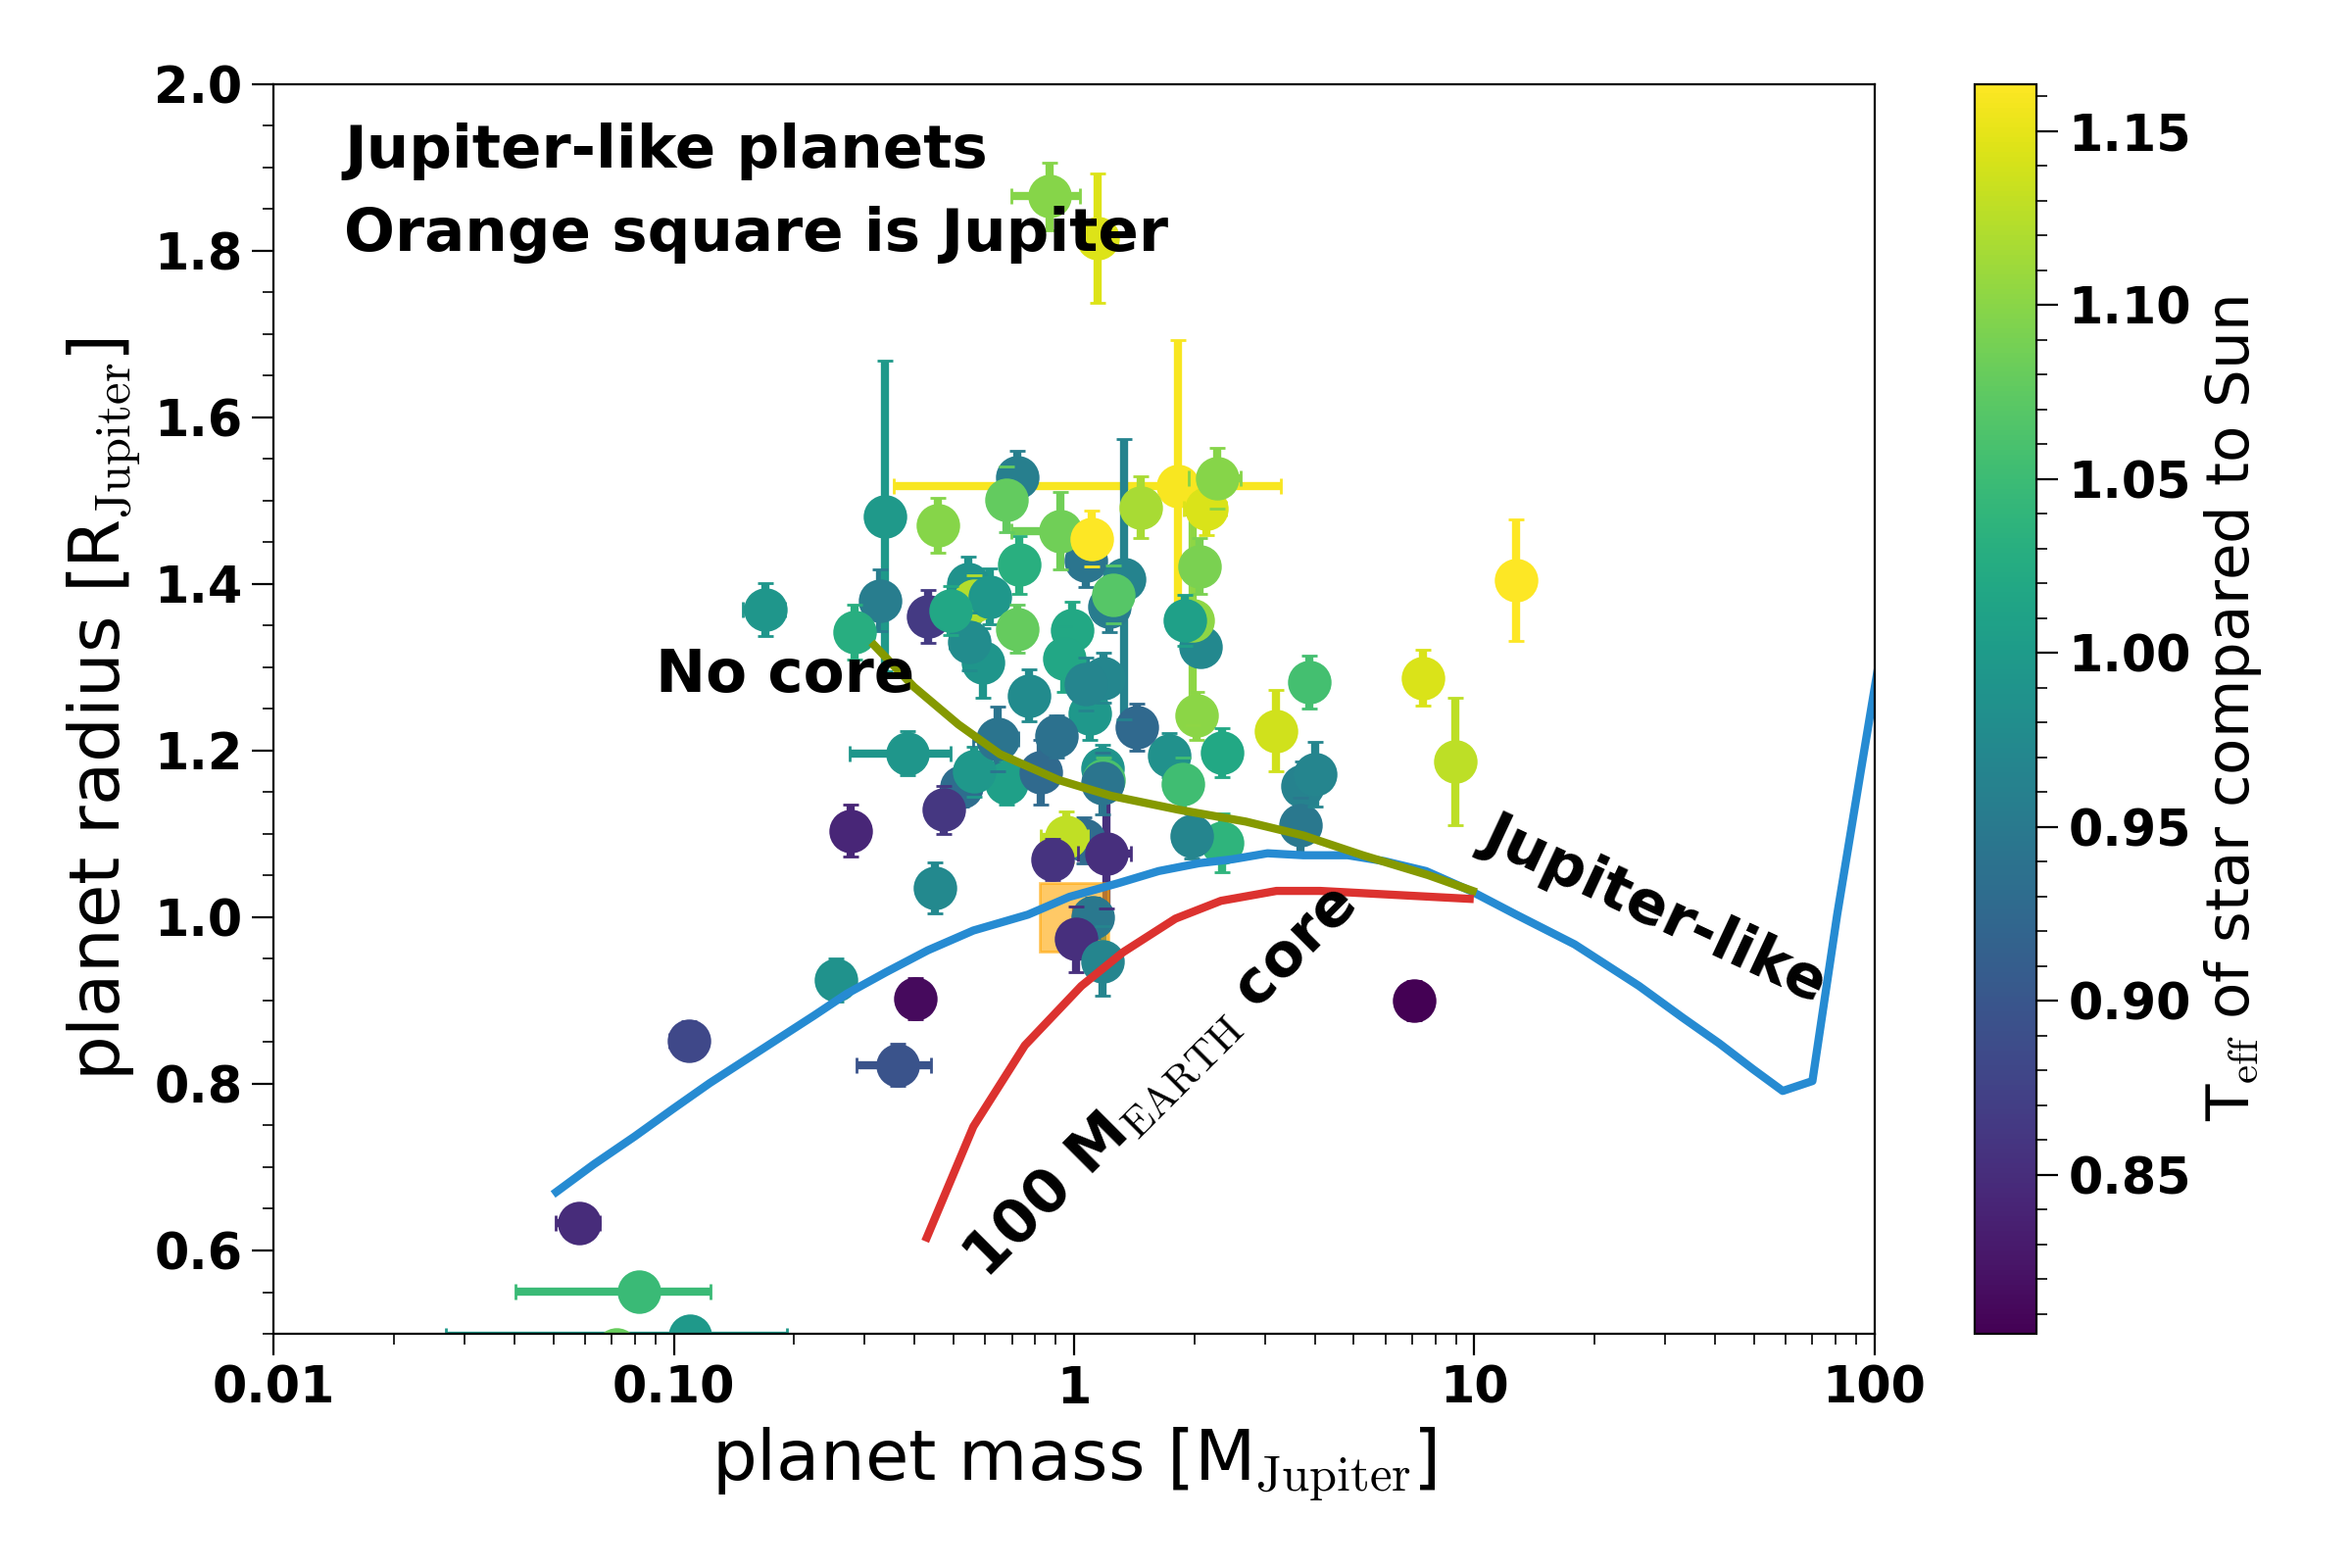
Figure 2: In these two figures the mass and radius are shown of known extrasolar planets whose host stars are among the FGKM Golden Sample. On the left the Earth-like planets are shown and on the right Jupiter-like planets from this sample. The curves show what theoretical models (Guillot & Gautier 2015, in Treatise on Geophysics, ed. G. Schubert, 529-557; Zeng et al. 2016, ApJ, 819, 127) predict with different assumptions about the planet composition and structure. The radii, masses and ages of the extrasolar planets are determined using the stellar parameters that are published in Gaia DR3. Credit: adapted from Gaia Collaboration, Creevey et al. 2022 - CC BY-SA 3.0 IGO. More info on these figures in the story on extrasolar planets here.
FGKM stars are also the targets of the upcoming ESA Plato mission whose objectives are to identify and characterize Earth-like extrasolar planets. The data from Gaia Data Release 2 are already used to help characterize the stars in the potentially observable fields. The new data from Gaia Data Release 3 will allow to improve this characterisation. This will enable the PLATO scientists to more efficiently select the targets for higher precision and complementary observations to better know the planet.
The synthetic photometry tool provided with the paper “Gaia Data Release 3: The Galaxy in your preferred colours. Synthetic photometry from Gaia low-resolution spectra" by Gaia Collaboration, Montegriffo, P., et al. provides a new and interesting way to couple Gaia information with other telescopes. For all the Gaia spectra published in Gaia DR3 (~220 Million stars), the paper provides photometry in a series of well-known optical passbands. This means that, even if an existing telescope observed only a subsample of the Gaia sources (for example, no ground based telescope can access the entire sky), these measurements can be simulated with a very high precision, as shown in the paper. The beautifully detailed color-magnitude diagram in Figure 3 is made combining data from ~4.5 million stars, having |b| > 50 i.e. in the Galactic Caps. Synthetic apparent magnitudes in optical Hubble Space Telescope passbands are used to provide a colour, while the absolute magnitude in the PANSTARR-1 y-band is computed from the synthetic apparent one corrected for the Gaia parallax.
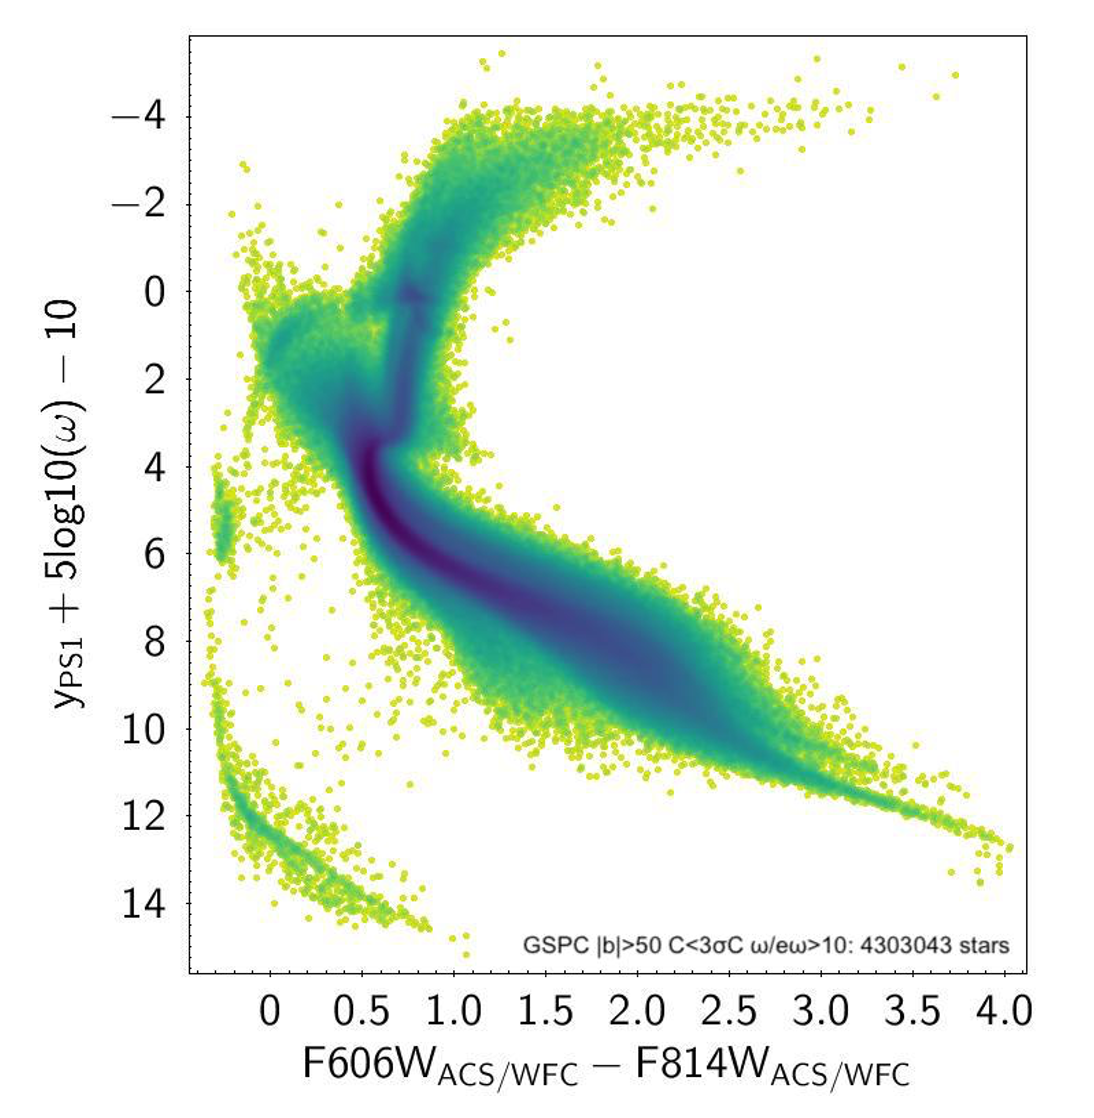
Figure 3 shows the colour-magnitude diagram, colour-coded by the density of stars, generated combining the synthetic measures in 2 different photometric systems (HST and PANSTARR-1). Gaia parallax is used to transform apparent to absolute magnitude yPS1 magnitude. Measures from ~4.5 million sources having |b| > 50 (Galactic Caps) are shown. Credits: ESA/Gaia/DPAC - CC BY-SA 3.0 IGO, based on images from the paper by Gaia Collaboration, Montegriffo, et al. 2022.
The mere availability of measurements, synthetic but very precise, in different photometric systems for a large sample of stars, can offer new possibilities to the scientific community. For example, one can take a look at the entire sky using different photometric systems and generate sky maps that would be fairly difficult to assemble using real telescopes, as shown in the animation in Figure 4.

Figure 4 shows a series of al-sky maps in different photometric systems, using synthetic photometry from the 220 million source spectra published in DR3 (REF to Montegriffo’s paper) and the measured Gaia photometry. For each HEALPix level=7, the mean color of its sources is computed and shown. Were used: JWST (F070W-F090W), Johnson-Kron-Cousins (B-V), HST(F606W-F814W). See this Gaia DR3 preview story for more details. Based on the paper by Gaia Collaboration, Montegriffo, et al. 2022. CC BY-SA 3.0 IGO.
In addition, the Gaia DR3 sample of spectra (and thus of synthetic photometry) covers a large variety of stellar and non-stellar sources, allowing for example to extensively test the performances of a new photometric system very early in the design phase, on a reliable and homogeneous dataset.
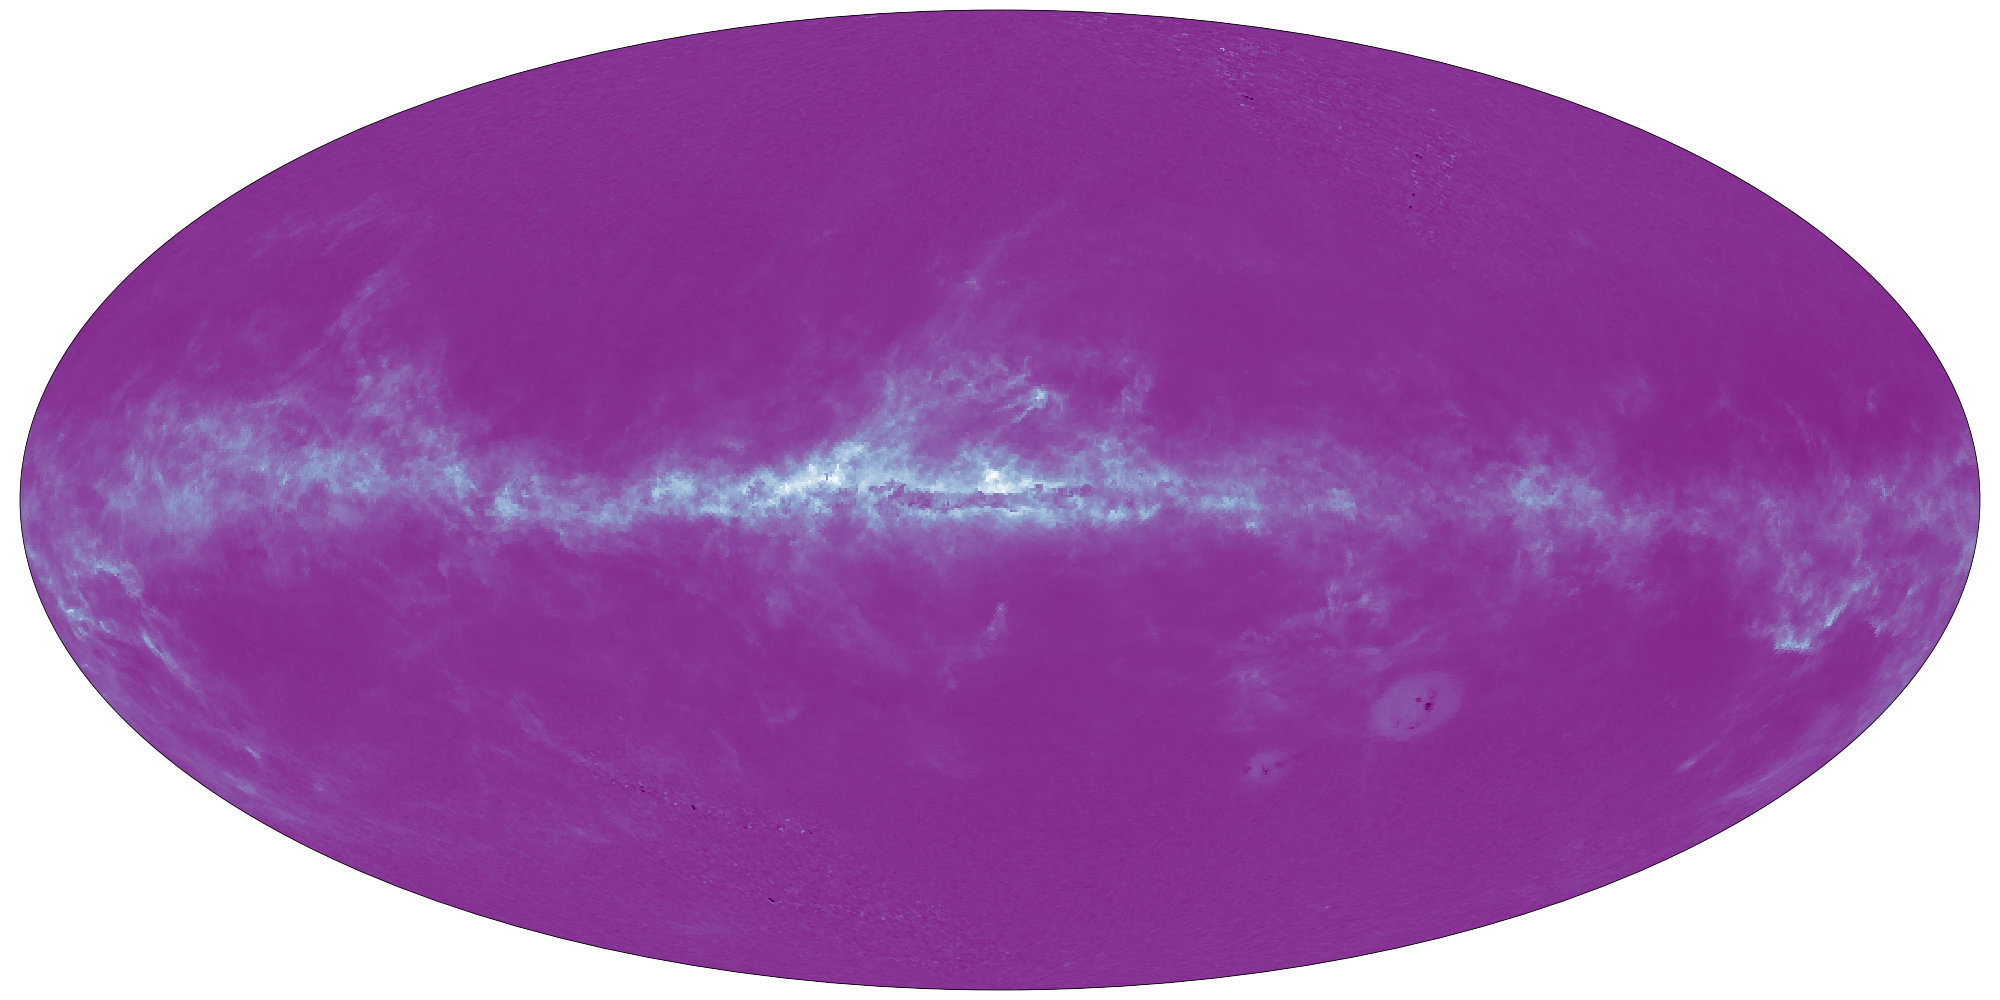
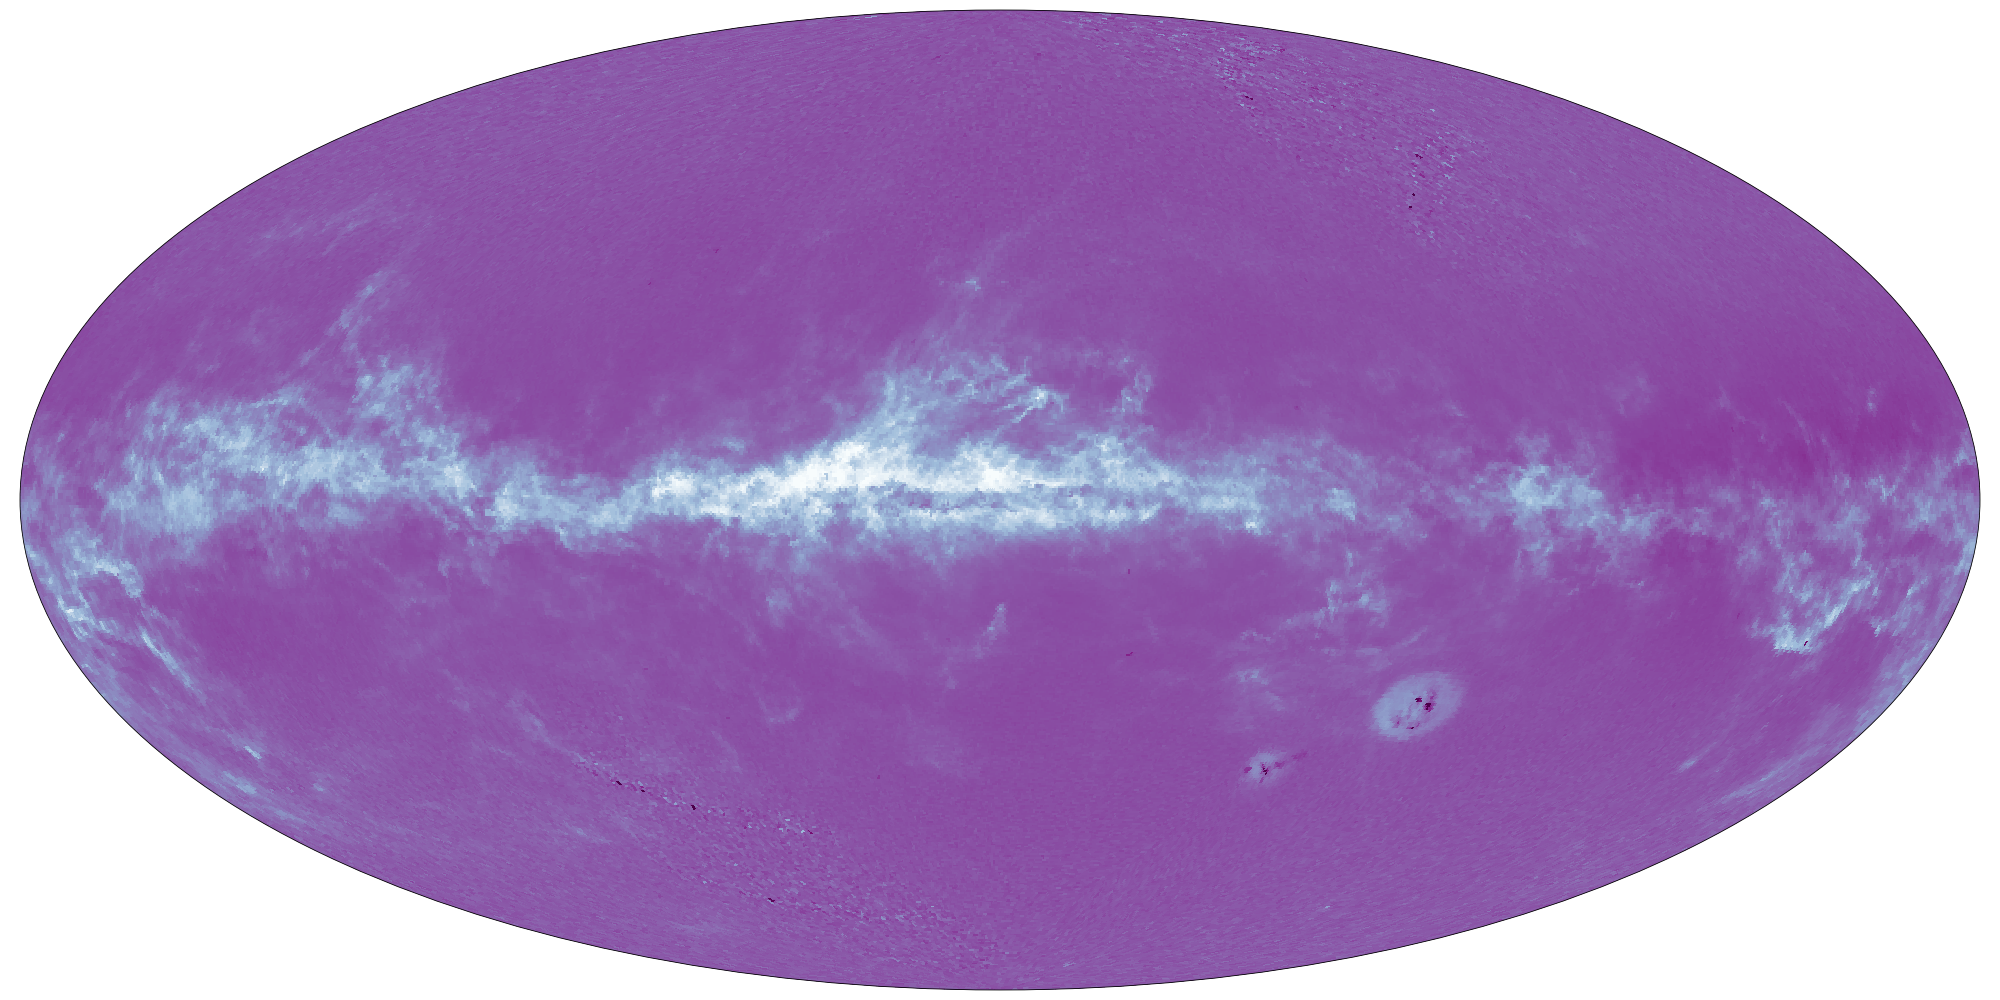
Sky map of Gaia data in the photometric system of the Hubble Space Telescope system or HST(F606W-F814W) (left) and the Johnson-Kron-Cousins (B-V) system (right). A sky map of Gaia data in the JWST photometric system was published as Gaia DR3 preview here. Based on the paper from the Gaia Collaboration, Montegriffo, et al. 2022. CC BY-SA 3.0 IGO.
Credits: ESA/Gaia/DPAC
Story written by Tineke Roegiers, Rosanna Sordo, Orlagh Creevey, Paolo Montegriffo, Michele Bellazzini
Published: 13 June 2022
- Removed a total of (13) style text-align:center;
- Removed a total of (15) style text-align:justify;
More Gaia DR3 stories?
Where are the stars? How far away are they? How bright are the stars?
What colour do they have? What are the stars made of?
Where do they go? Where do they come from? Do they approach us? Do they move away?
Did something move in front of the star? What is in between the stars?
How big, warm, old, ... are they? How do they Blink?
Is it a double star? Do they go boom? Is it a galaxy?
Is it a solar system object? Is it a quasar?
Who created the data? Can I Use Gaia data with other observatories?
How did DPAC produce the data for this star? Where is the data?
-
ESA's press release of Gaia Data Release 3
-
Gaia's Early Data Release 3 stories
-
ESA's press release of Gaia Early Data Release 3
- Removed a total of (16) style text-align:center;
- Removed a total of (1) style float:right;