
 Sign in
What are they made of? - Gaia
What are the stars made of?
A chemical map with Gaia DR3
Knowledge on the composition of stars is an important piece of the bigger puzzle of stellar evolution and understanding the history of our Milky Way. Gaia provides elemental information on stars in the form of metallicity estimates and stellar abundances. The fact that these are now available as one all-sky homogeneous data set is unique. Also the amount of chemical data available in Gaia DR3 is much larger than ever before.
This data set is based on the Gaia low-resolution BP/RP spectra by Coordination Unit 5, and the Gaia high-resolution RVS spectra by Coordination Unit 6. Gaia takes these observations from space, unhindered by the atmosphere on Earth or light pollution. Also, Gaia observes continuously over time, returning to the same sources on average 70 times in 5 years. This long timespan allows to model instrument specifics and remove most of them. All of this together leads to the very high quality of the estimates on stellar abundances and metallicity by Coordination Unit 8.
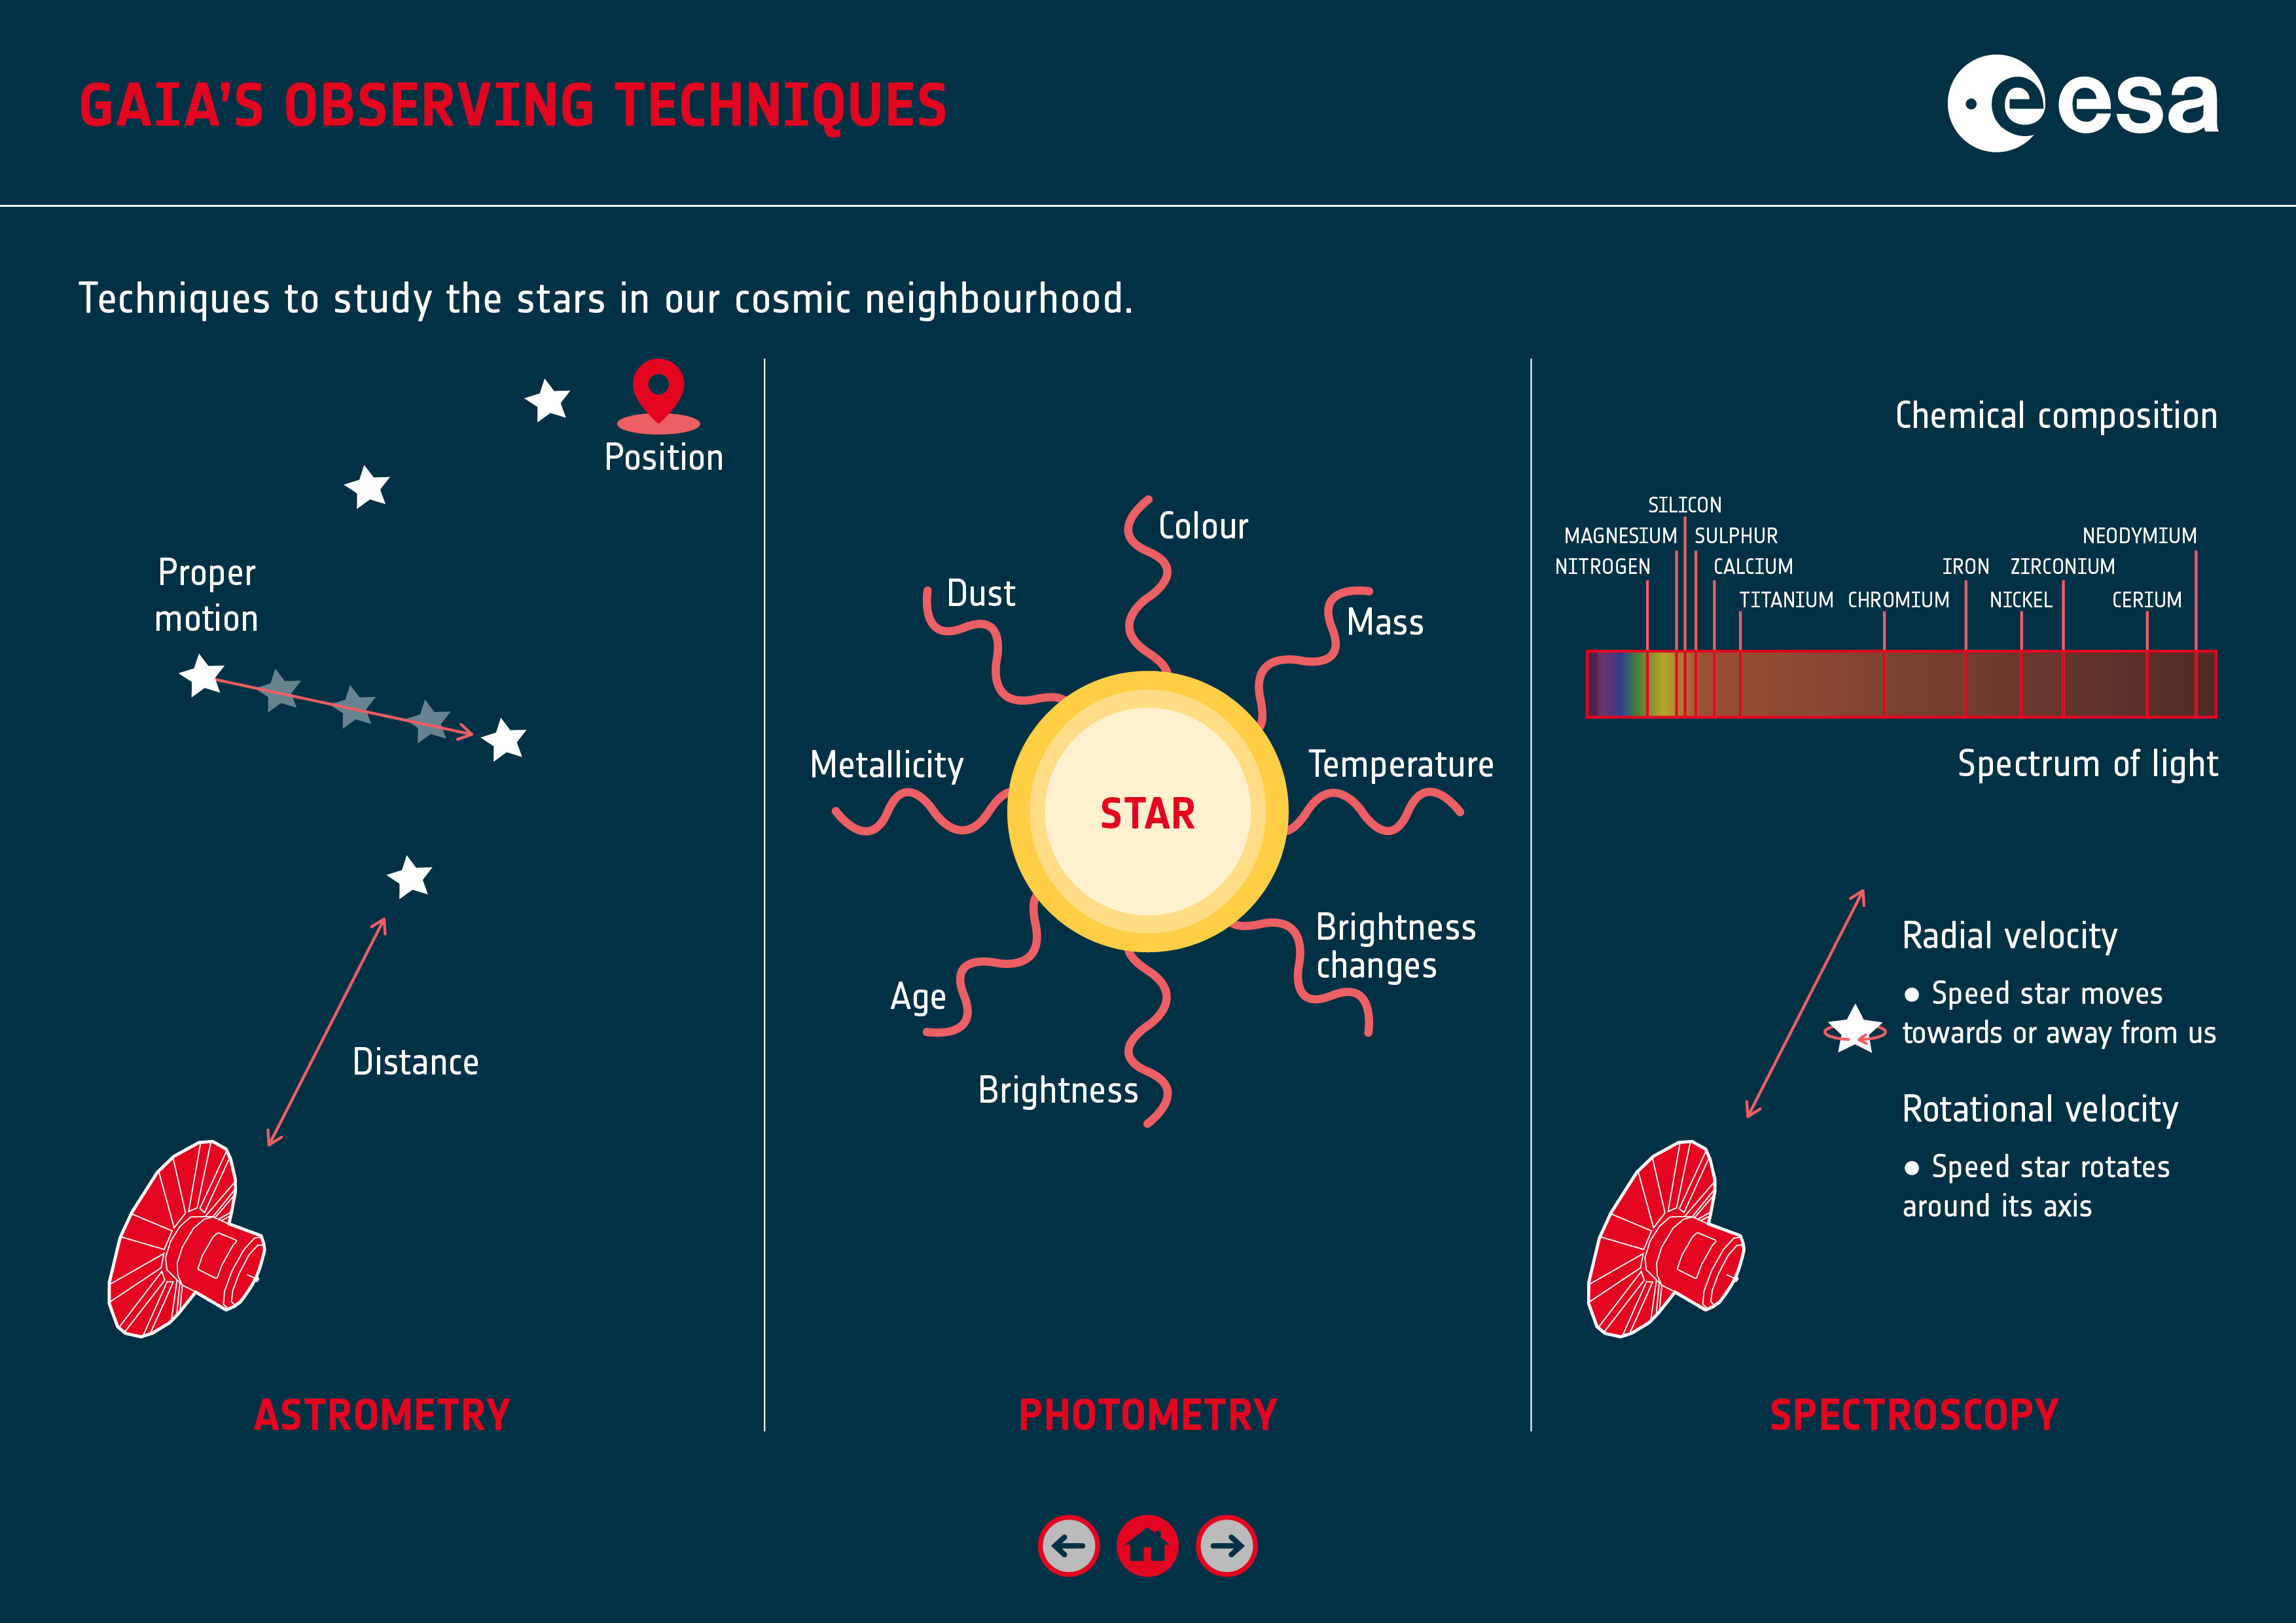
Figure 1: Media kit “Gaia’s observing techniques”: Metallicities are derived from both photometric and spectroscopic data, stellar abundances are derived solely from the spectroscopic data. Published here. Credits: ESA
Stars form from clouds of gas and dust. They shine thanks to nuclear fusion reactions and, like alchemists, make new chemical elements. At the end of their lives, these new elements are returned to the gas and interstellar dust and a new generation of stars is formed. As a consequence, each stellar generation enriches the gas from which the next generation is formed. Astrophysicists call “metals” all the chemical elements that exist apart from hydrogen and helium (produced mainly during the Big Bang). If the star’s metal abundance is low, then its chemical composition is more primitive. If the star is rich in metals, then its chemical composition is generally more recent. The metal abundance of stars is usually expressed in a logarithmic scale with respect to that of our Sun. The Solar metallicity is therefore equal to zero.
In the sky map below an all-sky view of the metallicity as measured by Gaia is given. The redder stars are richer in metals with the metallicity of the Sun set at zero in the colour bar. In the Galactic plane, the higher metallicity values of the thin disc are visible (red). In the central Galactic regions, a more metal-poor mix of bulge and thick disk populations is present (blue). Far from the disk plane, high metallicity thin disk stars at low distances from the Sun and more distant metal-poor halo stars are present.
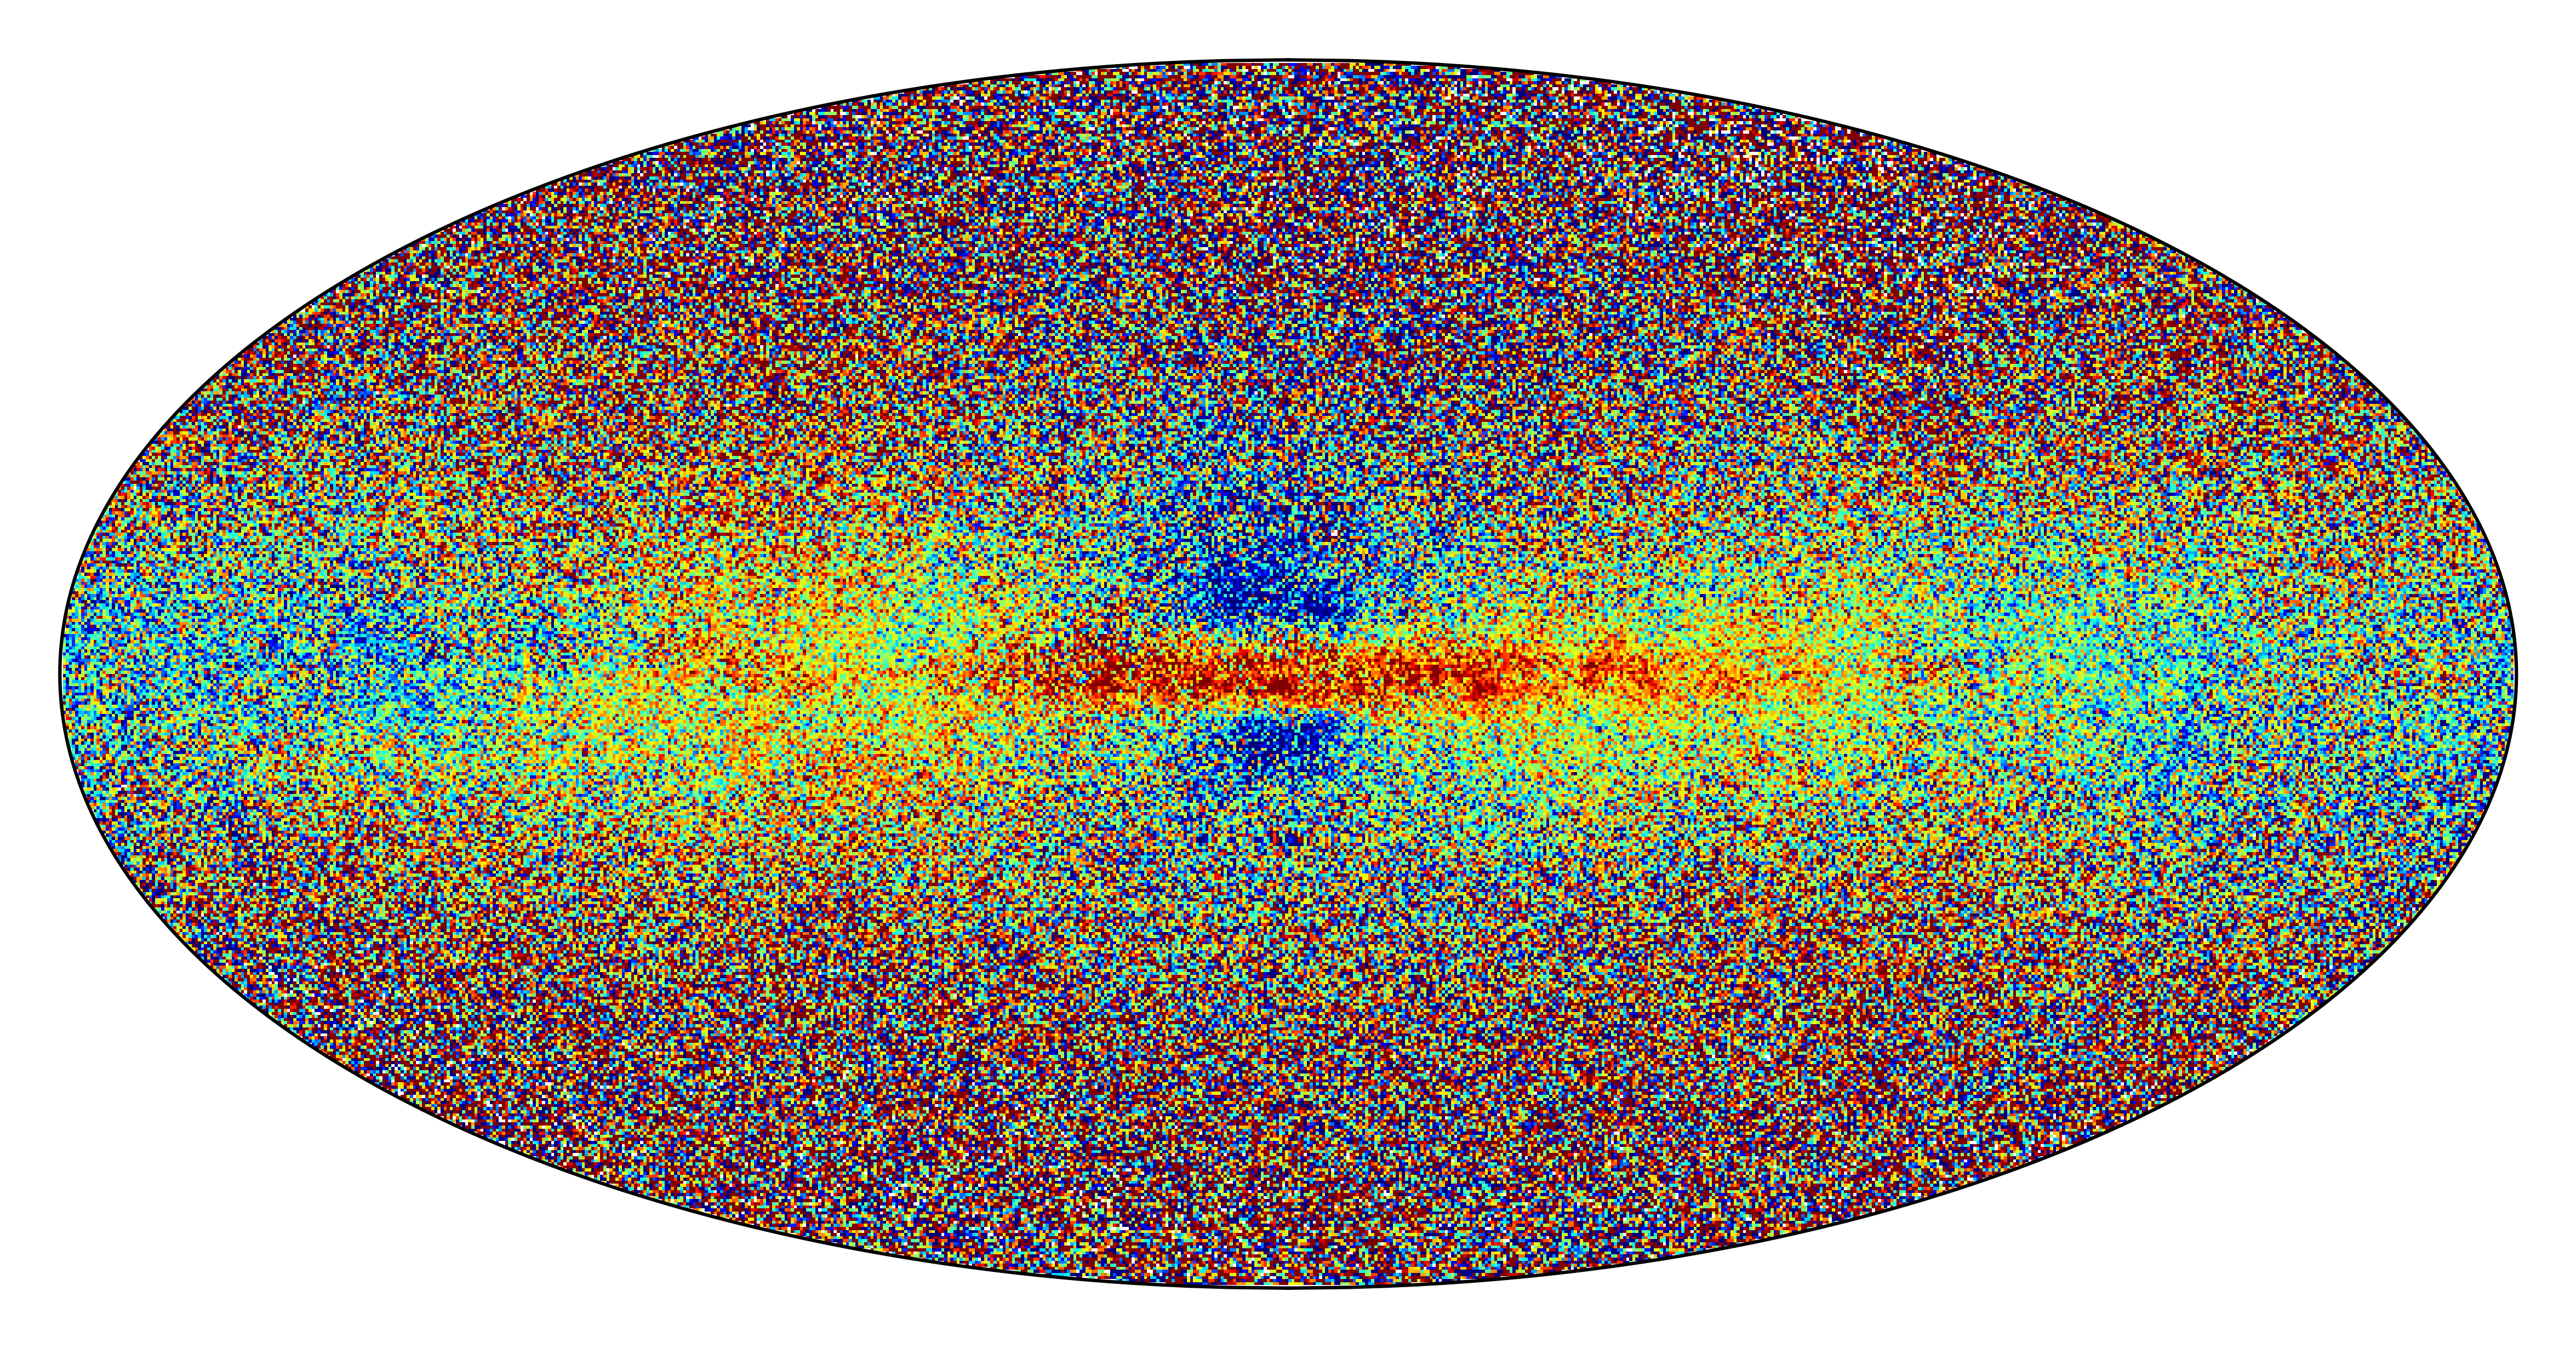
Figure 2: All sky view in Galactic coordinates (HEALPix map) showing the stars in the Gaia DR3 GSP-Spec database (Gaia Collaboration, Recio-Blanco et al. 2022). The colour indicates the stellar metallicity, [M/H], that is the mean abundance of all chemical elements except hydrogen and helium. Redder stars are richer in metals. Image credits: Gaia Data Release 3: Chemical cartography of the Milky Way by Gaia Collaboration et al. 2022. CC BY-SA 3.0 IGO.
Looking at a sample of this same data set from far above the Milky Way, one can see the variation of metallicity in the Milky Way. The right panel of figure 3 shows this very nicely. The expected radial metallicity trend of the Galactic disk is clearly observed, with stars more metal-rich (more red) when moving from the outer disc regions towards the Galactic centre. In addition, for the first time and thanks to Gaia DR3 data, azimuthal dependences of the stellar metallicity are observed.
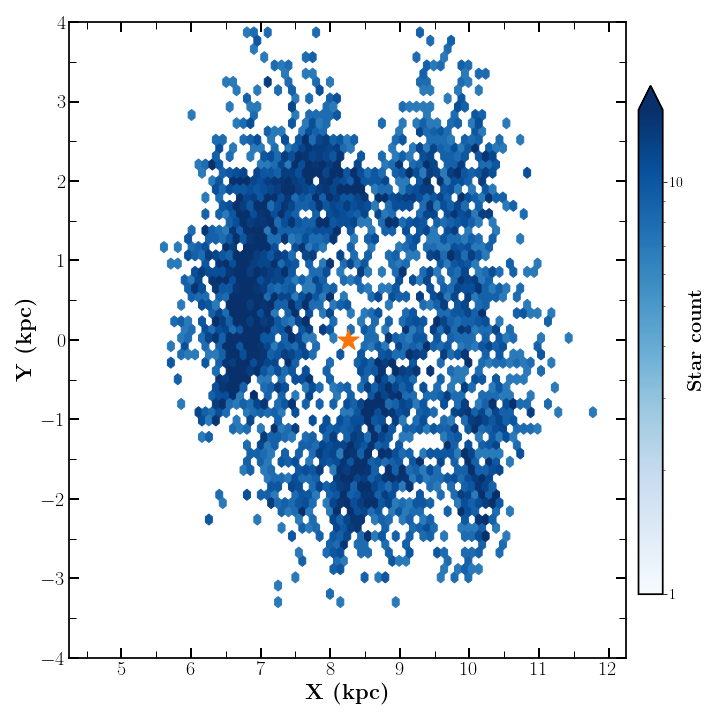
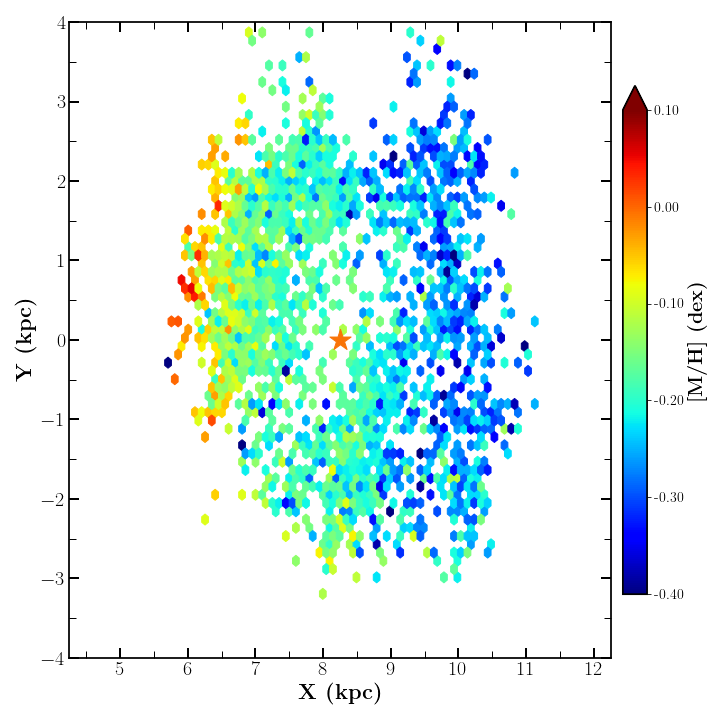
Figure 3: Face on view of the Milky Way, in Cartesian Galactic coordinates, showing massive young stars in the Gaia DR3 GSP-Spec database (Gaia Collaboration, Recio-Blanco et al. 2022). In the left panel, the colour indicates the number of stars (darker regions being more populated). The spatial distribution is not homogeneous and it nicely reveals the closest spiral arms. In the right panel, the colour indicates the stellar metallicity, [M/H], that is the mean abundance of all chemical elements except hydrogen and helium. Redder stars are richer in metals. Image credits: Gaia Data Release 3: Chemical cartography of the Milky Way by Gaia Collaboration et al. 2022. CC BY-SA 3.0 IGO.
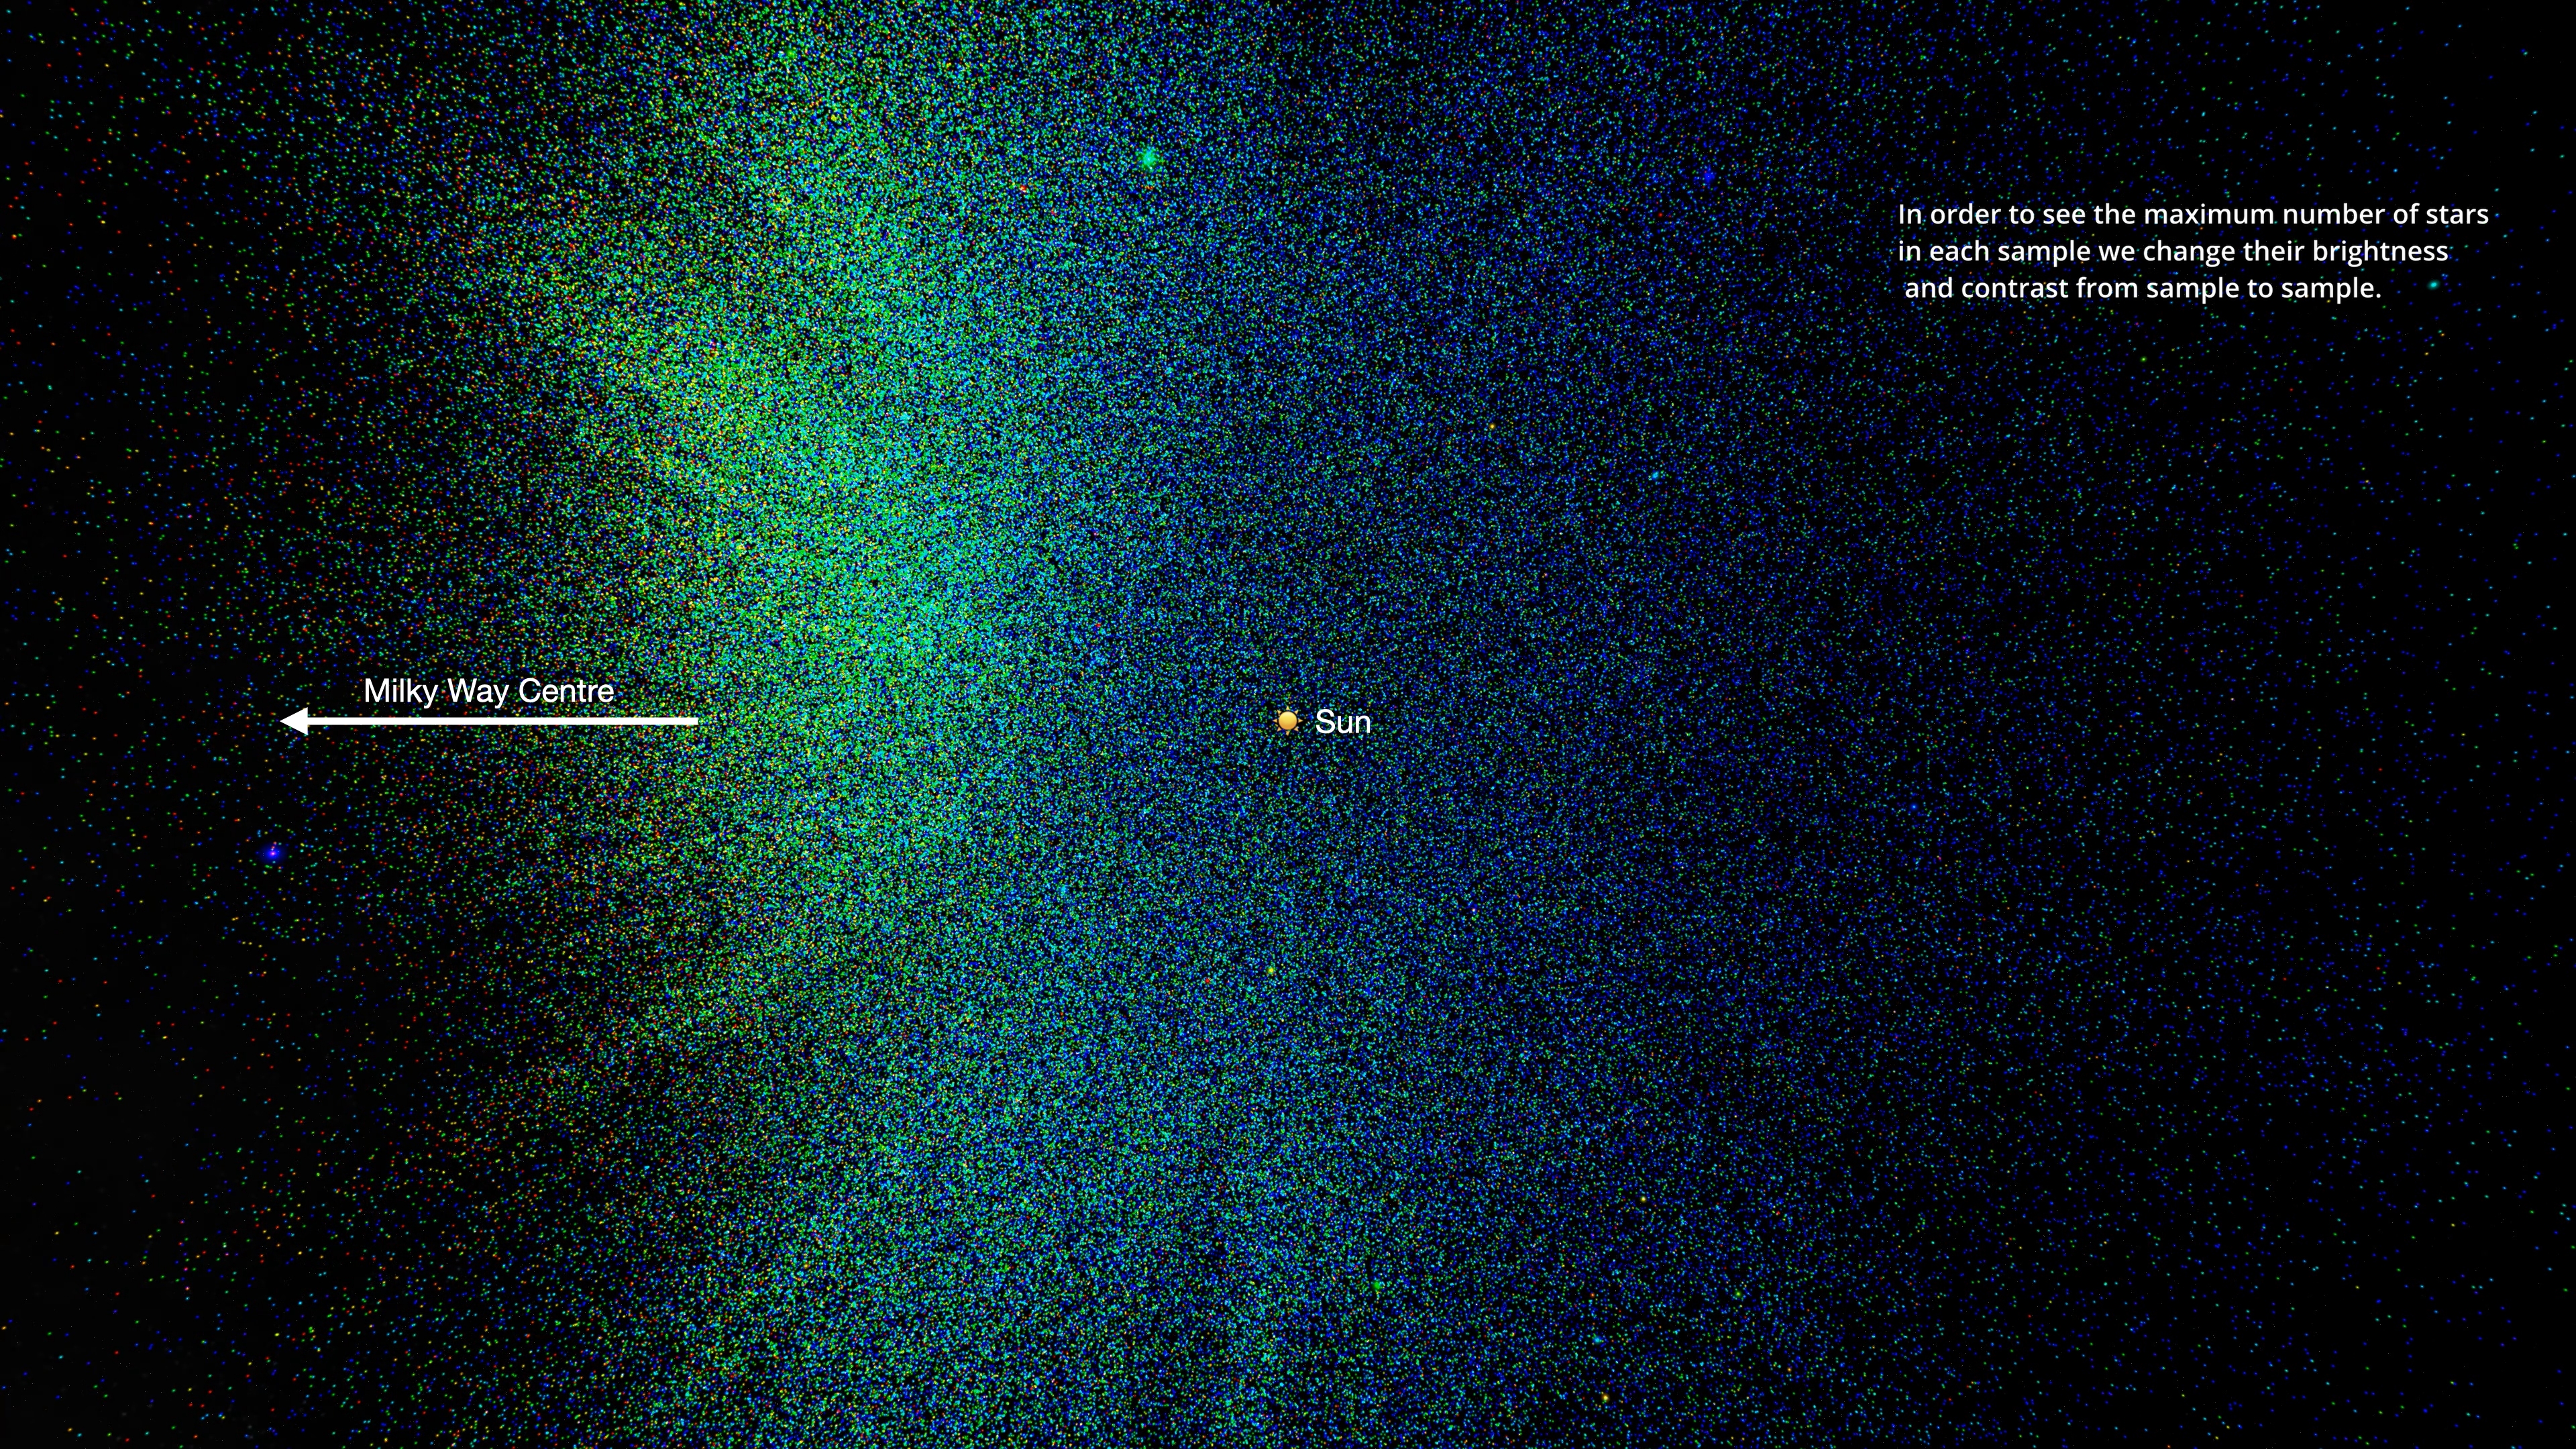
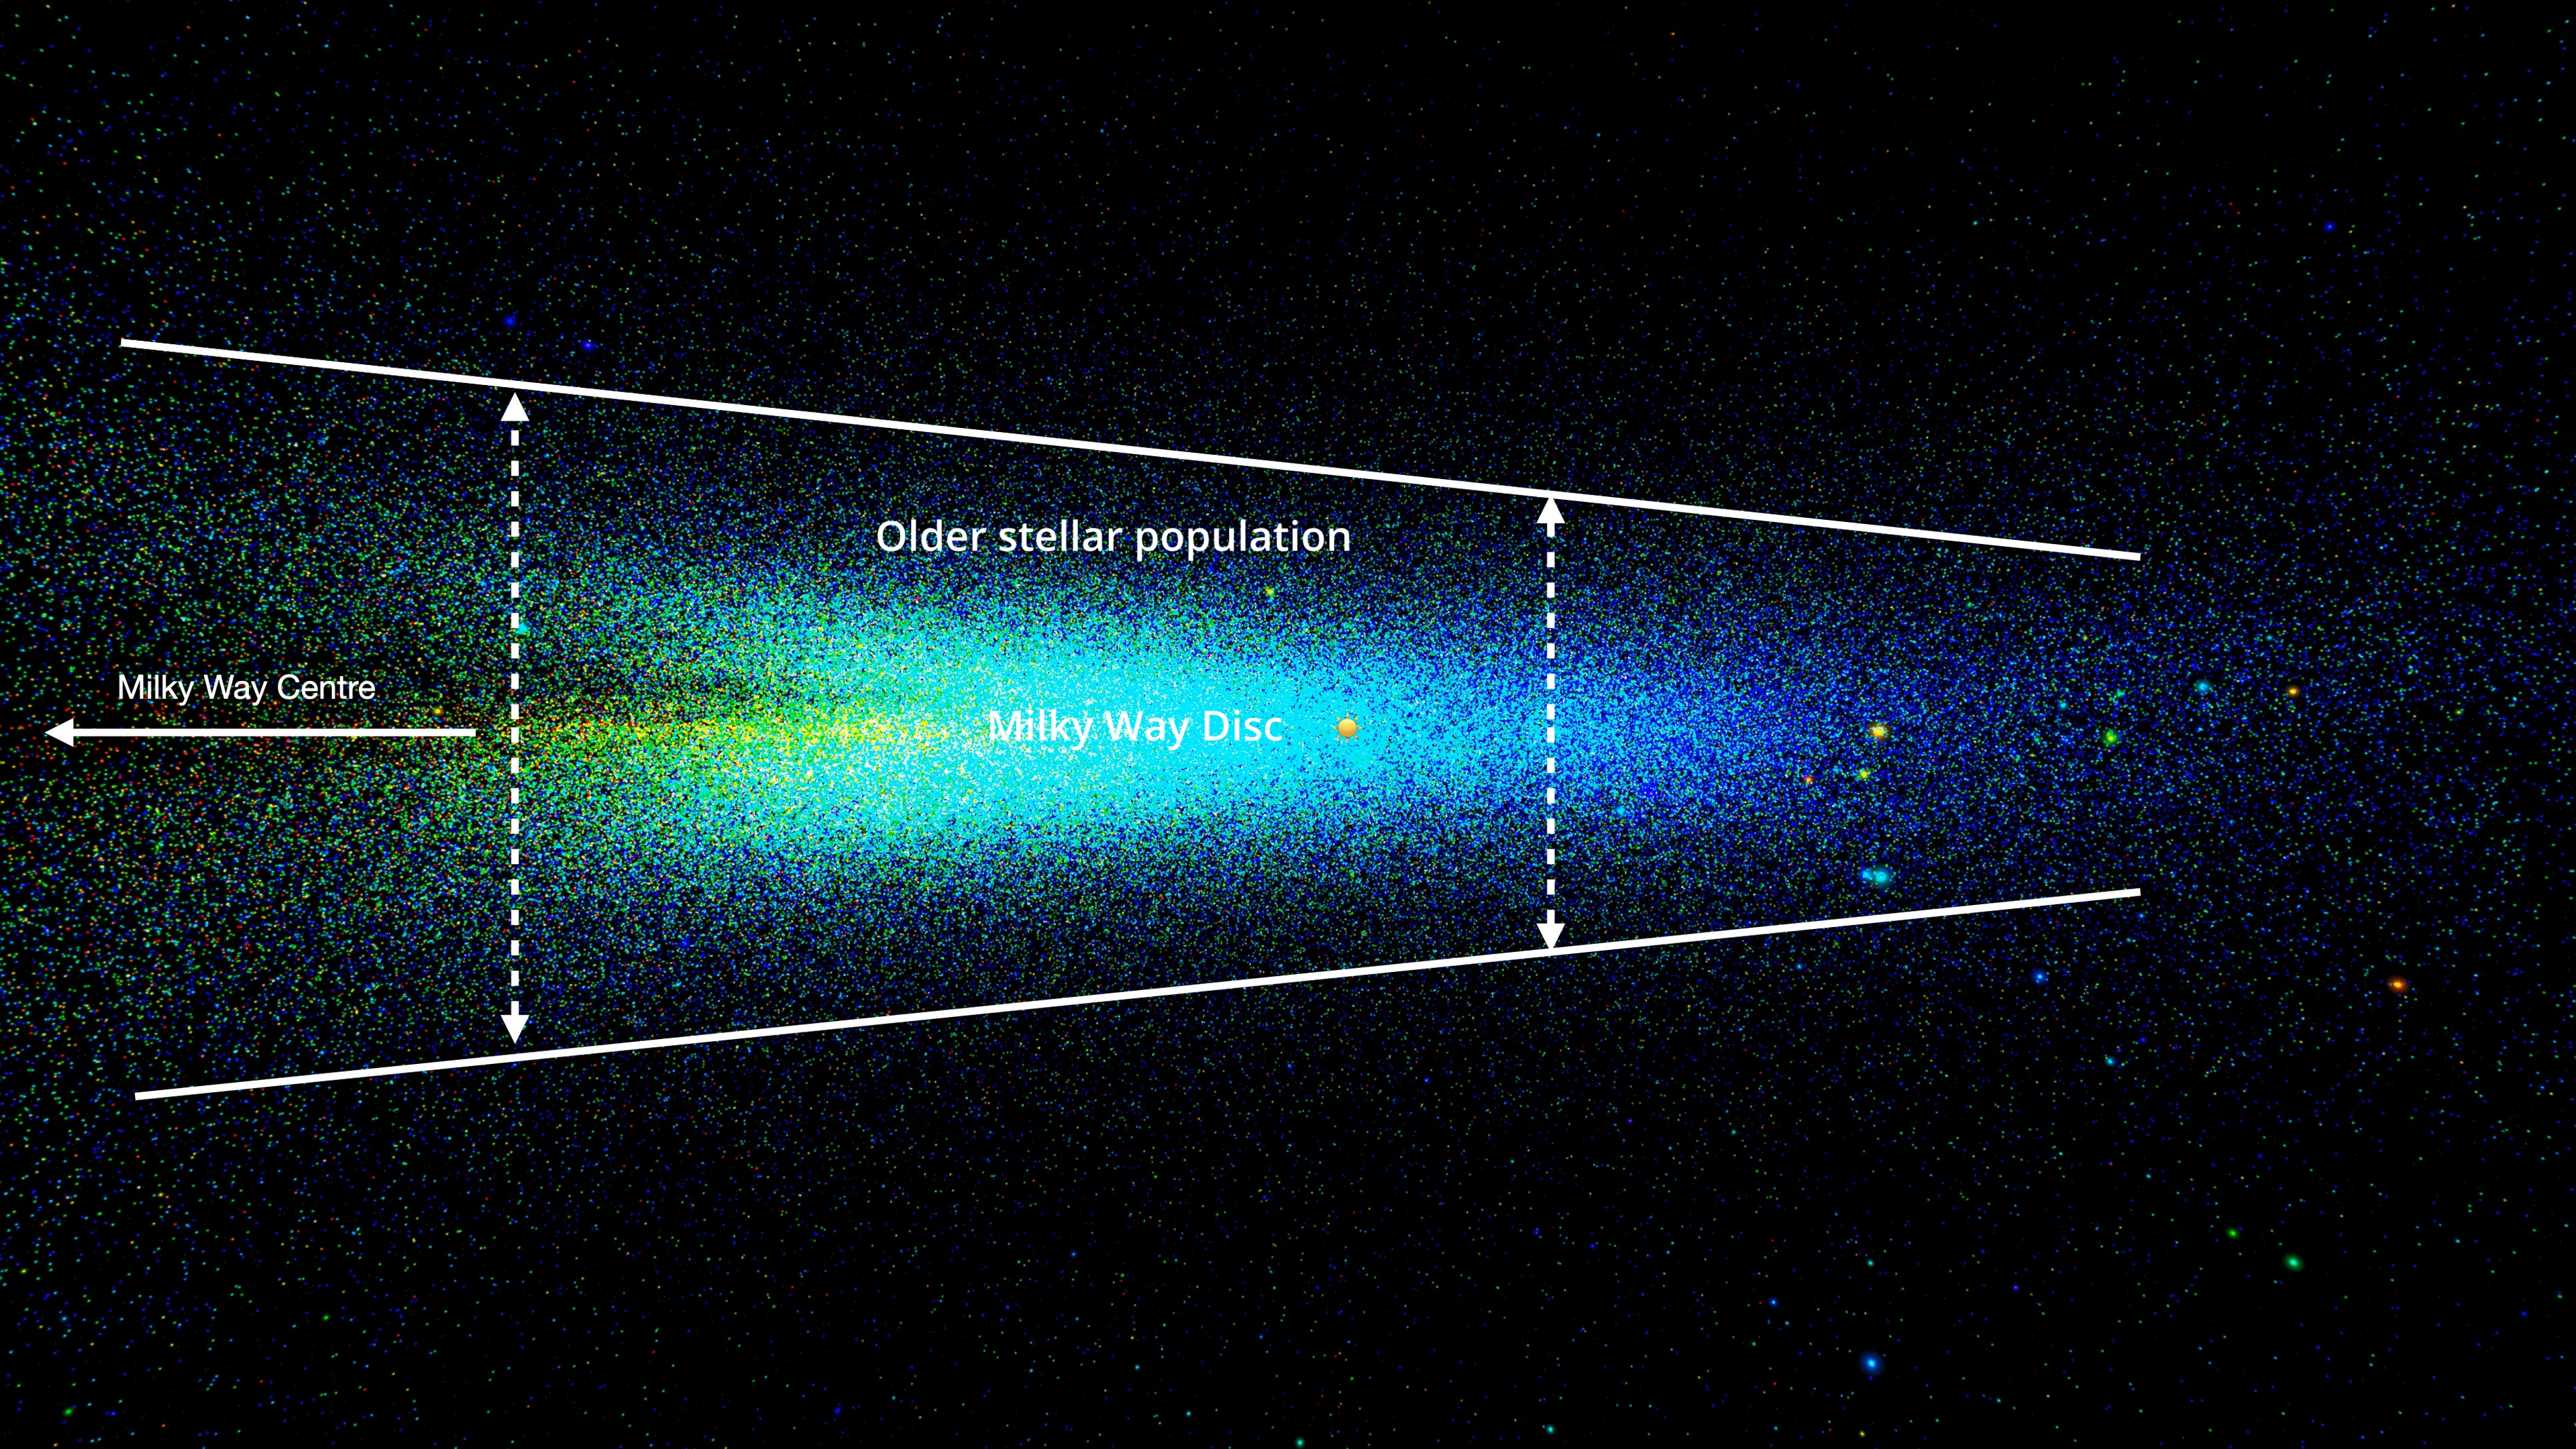
Figure 4: Screenshots taken from the video (see below) on the chemical cartography of the Milky Way, showing a sample of very luminous Giant stars, colour-coded by their metallicity. Blue is low metallicity, green is medium and red is high metallicity. This informs us about the chemical composition of the gas from which these stars were formed over more than 12 billion years of Galactic history. Left panel: as seen from above the Milky Way. Right panel: edge-on. ESA/Gaia/DPAC - CC BY-SA 3.0 IGO.
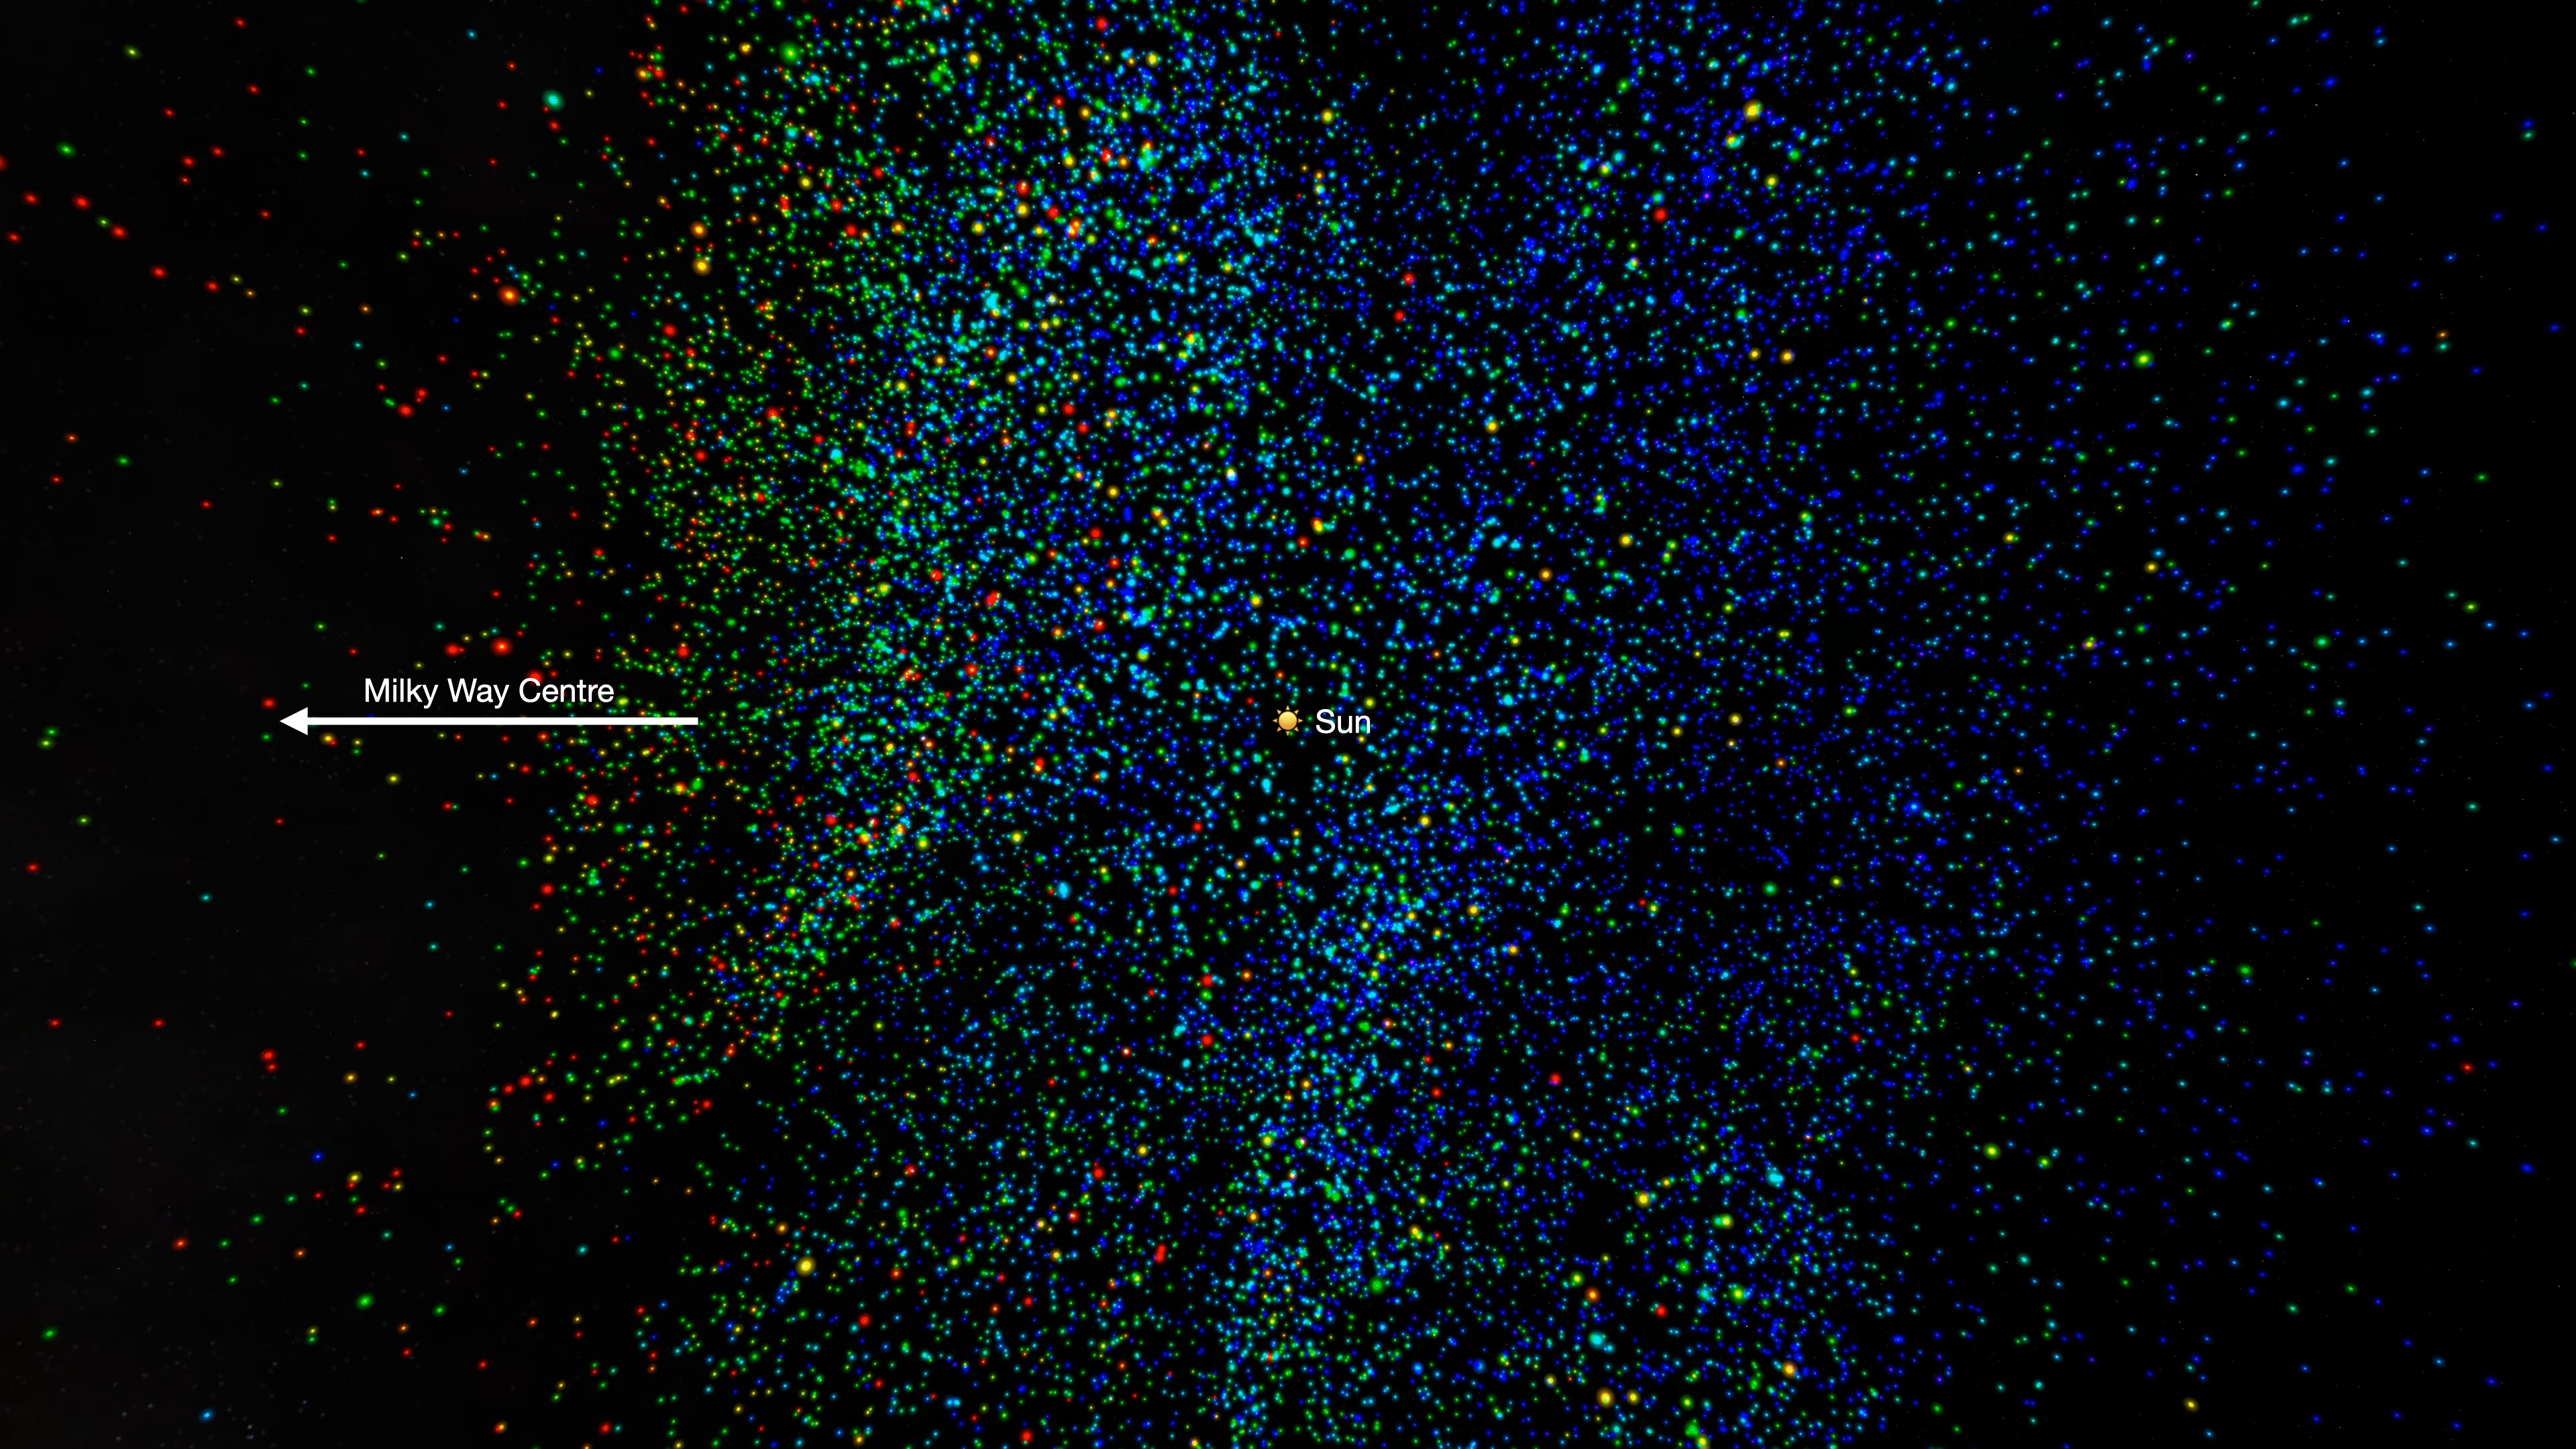
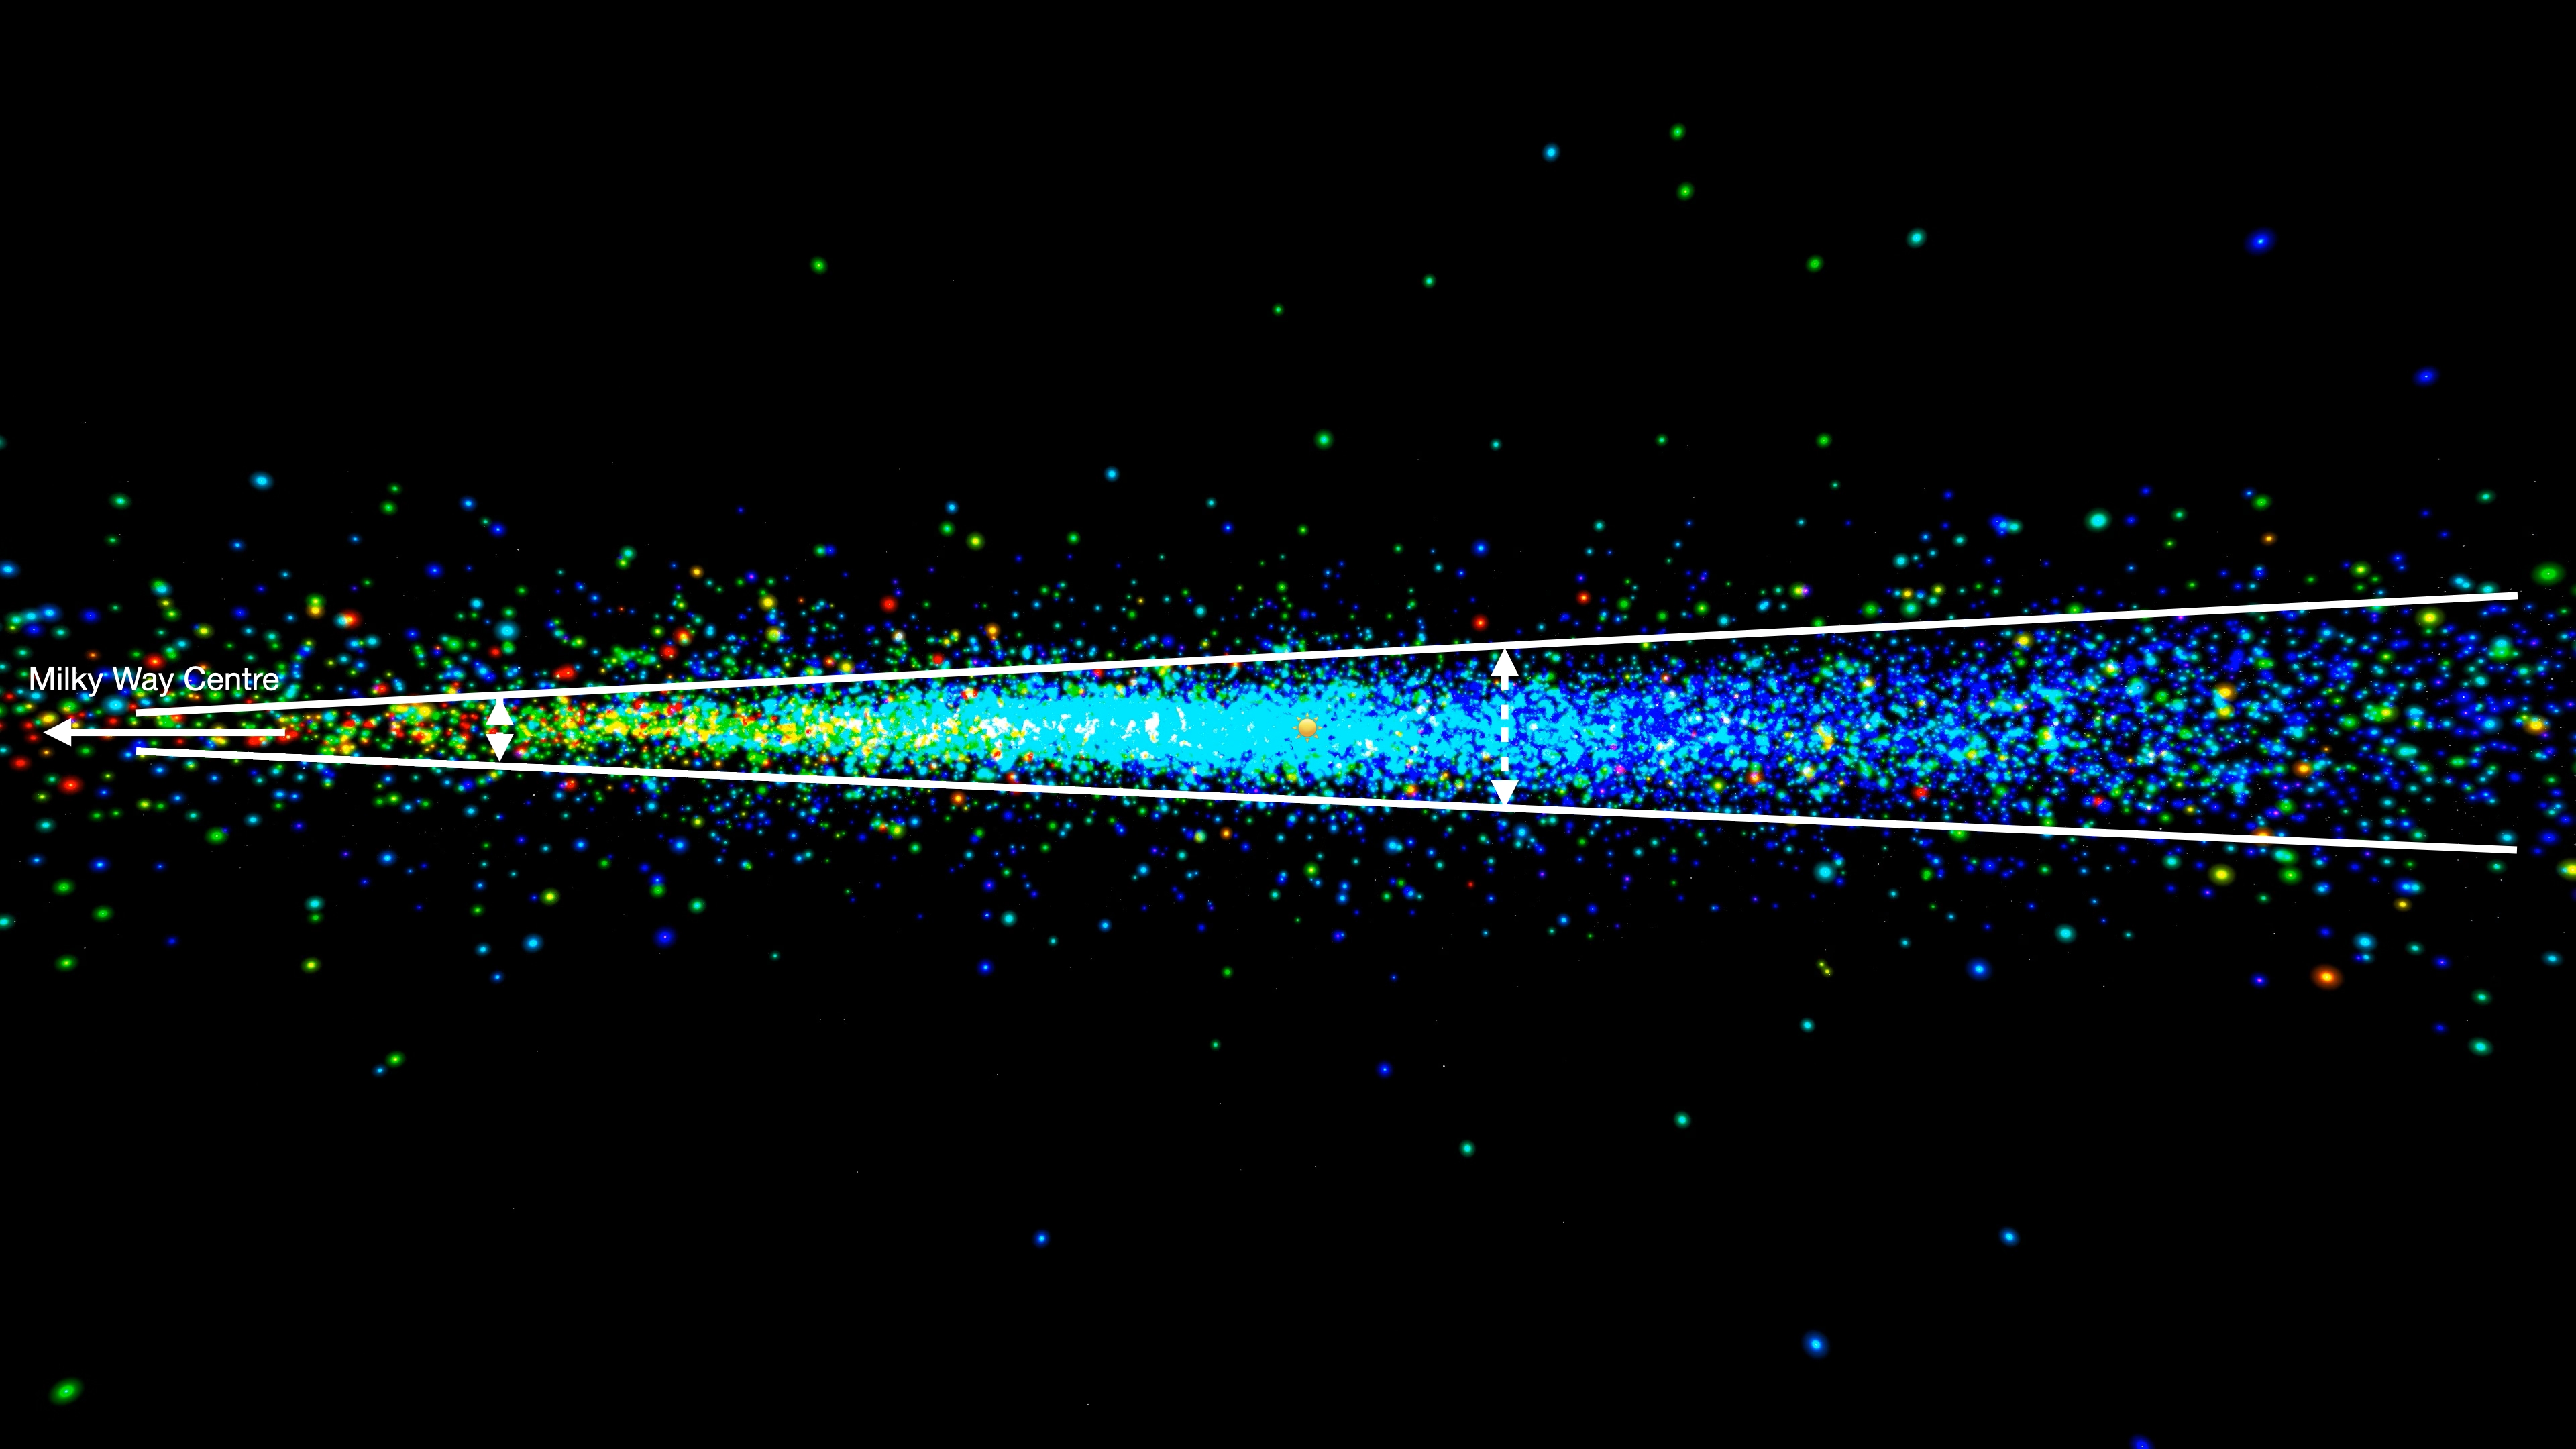
Figure 5: Screenshots taken from the video (see below) on the chemical cartography of the Milky Way showing a sample of young stars, only a few hundred million years old (four billion years younger than the Sun). They are located around curves that reveal the spiral arms of the Milky Way. Colour coded by their metallicity. Blue is low metallicity, green is medium and red is high metallicity. Again the decrease in the metal-enrichment is seen when looking further outwards in our galaxy. This is the largest sample of young stars for which there is a detailed chemical description, thanks to Gaia DR3. ESA/Gaia/DPAC - CC BY-SA 3.0 IGO.
Next to the mean abundance of all chemical elements, metallicity, a similar exercise can be done as well for the stellar abundances. Gaia is able to observe 12 elements: Nitrogen, Magnesium, Silicon, Sulphur, Calcium, Titanium, Chromium, Iron, Nickel, Zirconium, Cerium and Neodymium (see Figure 1).
Look for example at the images below showing first a star count, then the metallicity and third the stellar abundance ratio of alpha-elements, like calcium, with respect to iron (called alpha/Fe). It is seen here that in the regions where there is a high metallicity (Figure 6 centre panel, more yellow in this case) there is also a lower stellar abundance of alpha-elements (Figure 6 right panel, more blue in this case), and vice versa.
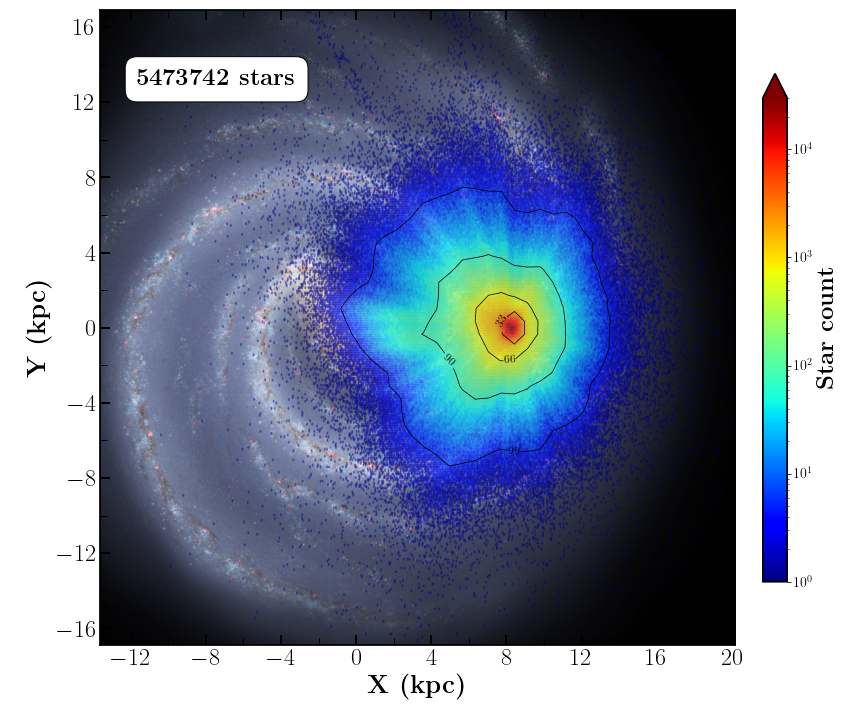
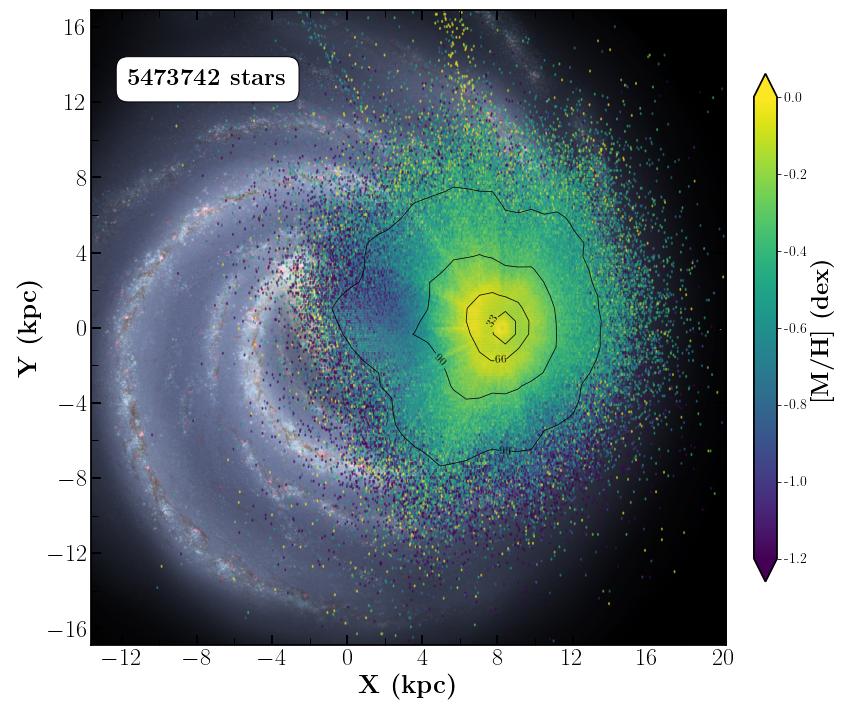
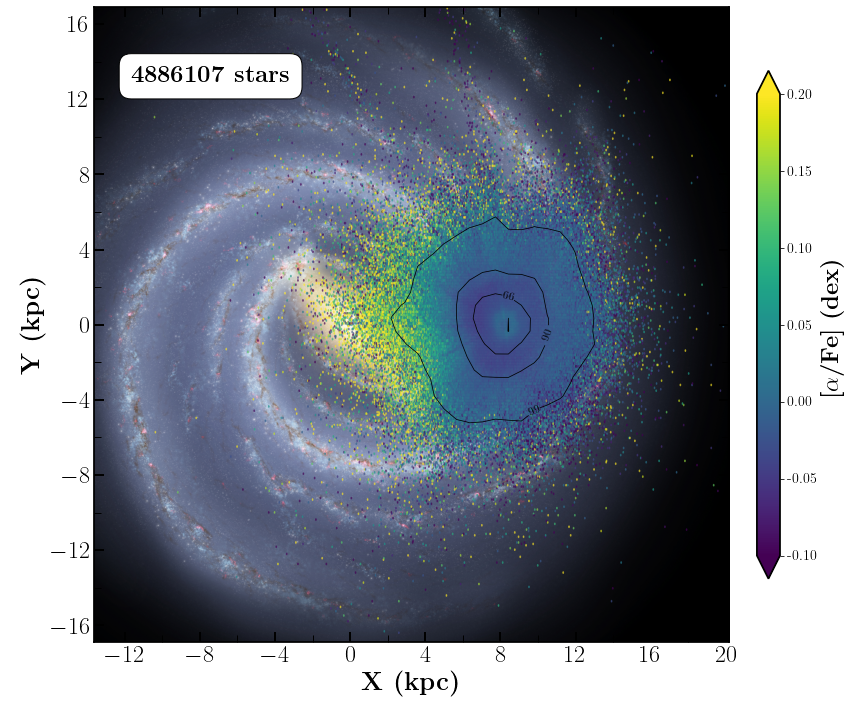
Figure 6: Face on view of the Milky Way, in Cartesian Galactic coordinates, showing the stars in the Gaia DR3 GSP-Spec database (Gaia Collaboration, Recio-Blanco et al. 2022). In the left panel, the colour indicates the number of stars. In the middle panel, the colour indicates the stellar metallicity, [M/H], that is the mean abundance of all chemical elements except hydrogen and helium (redder stars are richer in metals). In the right panel, the colour indicates the stellar abundance ratio of alpha-elements, like calcium, with respect to iron, called [alpha/Fe]. The background image is the Milky Way sketch from Churchwell et al. (2009). Image credits: Gaia Data Release 3: Chemical cartography of the Milky Way by Gaia Collaboration et al. 2022, background image by Churchwell et al. (2009). CC BY-SA 3.0 IGO.
The all sky view of the Gaia DR3 stellar abundances is shown in Figure 7. The thin disc of the Milky Way is visible in the Galactic plane thanks to its low [alpha/Fe] values. The patterns close to the Ecliptic Poles are artefacts caused by the Gaia scanning law.
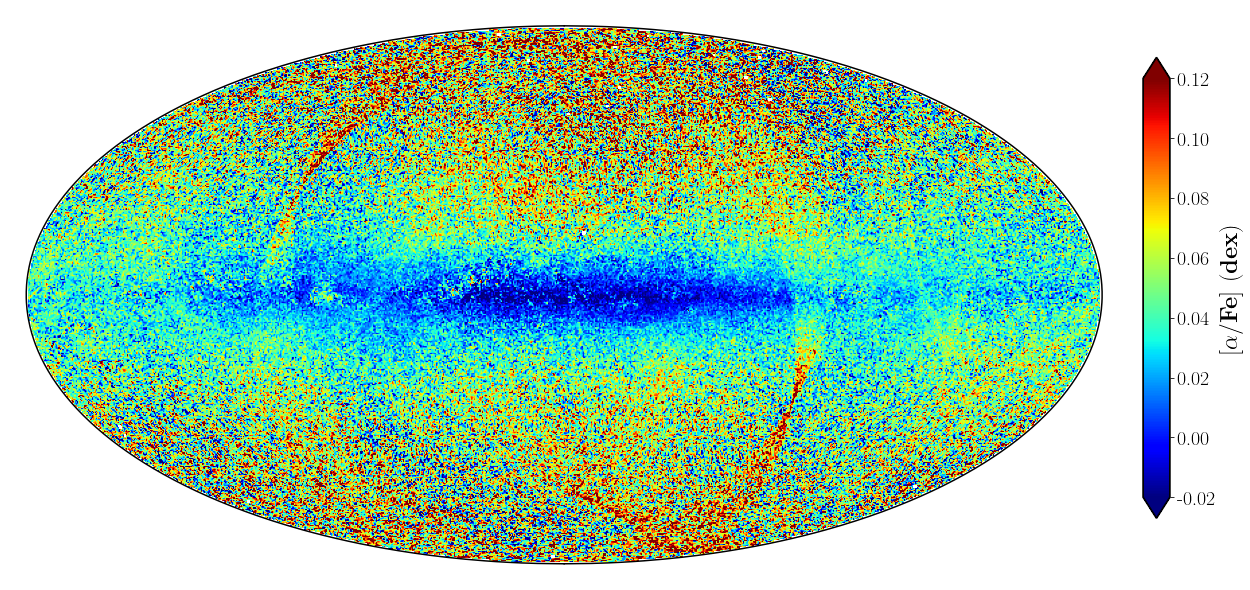
Figure 7. All sky view in Galactic coordinates (HEALPix map) showing the stars in the Gaia DR3 GSP-Spec database (Gaia Collaboration, Recio-Blanco et al. 2022). The colour indicates the stellar abundance ratio of α-elements, like calcium, with respect to iron, called [α/Fe]. Image credits: Gaia Data Release 3: Chemical cartography of the Milky Way by Gaia Collaboration et al. 2022. CC BY-SA 3.0 IGO.
While before Gaia DR3 one needed to complement Gaia data with ground-based spectroscopy, now for the first time, both are available from the same observatory, Gaia. This allows to study for example the accretion history of the Milky Way in more detail.
A fundamental element of galaxy formation is the accretion of mass through mergers of satellites and gas. Recent dynamical analyses based on Gaia DR2 data have revealed major accretion events in the history of the Milky Way. However, for the robust identification of accreted stars one needs to combine orbital parameters with chemical diagnostics. The Figure 8 below, taken from the paper “Gaia Data Release 3: Chemical cartography of the Milky Way” by the Gaia Collaboration, Recio-Blanco, A., et al. 2022, proves that Gaia is now providing diagnostics of accretion through one of its new DR3 products: the abundance ratio of alpha-elements (like calcium) to iron, [alpha/Fe].
Compared to the massive Milky Way, satellite galaxies generally present signs of protracted chemical evolution, as an under-abundance in [alpha/Fe] ratios. First of all, four groups of accreted candidates were selected based on their orbital properties: Gaia-Enceladus (upper left panel), Thamnos (upper right panel), Helmi streams (lower left panel) and Sequoia (lower right panel).
It can be appreciated that many merger debris candidates present a chemical pattern typical of satellite galaxies: lower [α/Fe] values compared to disc stars at the same metallicity (grey contour plot in the background, dominated by stars formed in the Milky Way). For the first time using Gaia data exclusively, these accreted stars can be distinguished from in situ formed disc stars puffed up to halo orbits, proving Gaia stand-alone capabilities of providing robust accretion diagnostics.
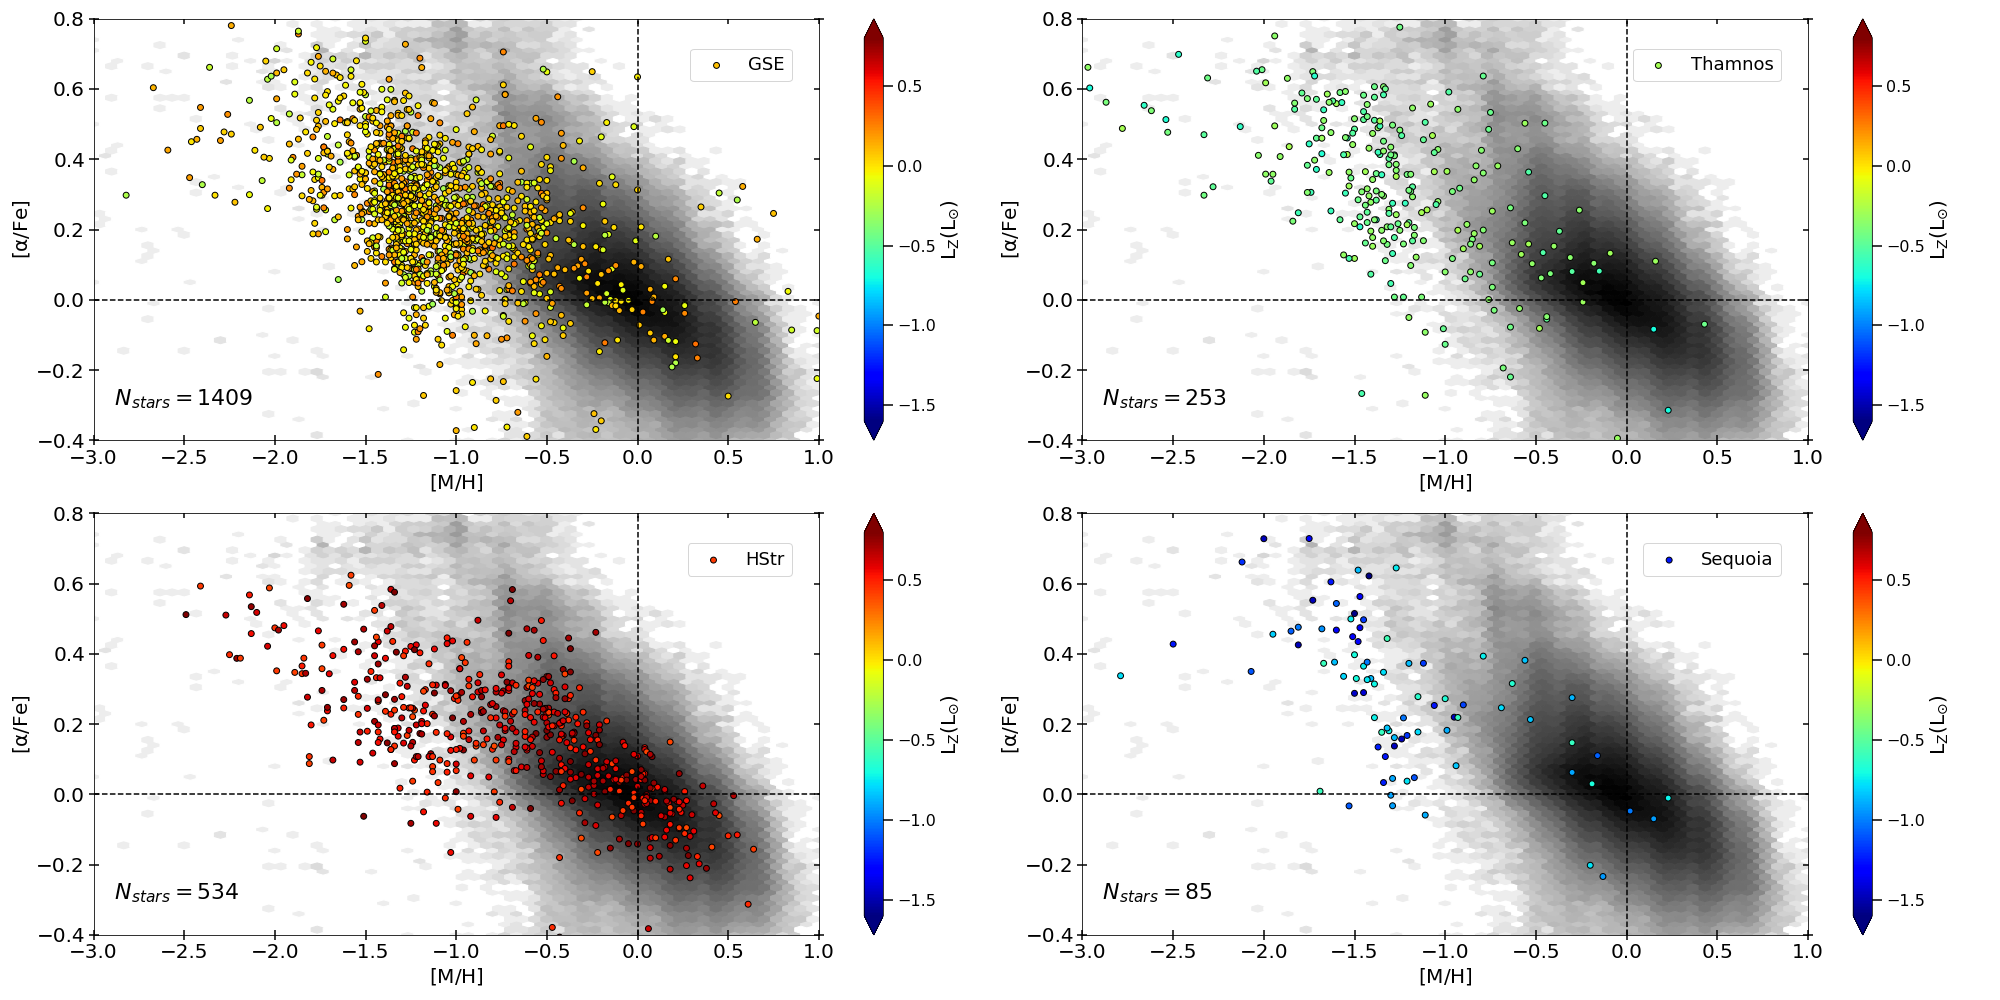
Figure 8: [alpha/Fe] abundance versus stellar metallicity [M/H] for four groups of accreted candidates: Gaia-Enceladus (upper left panel), Thamnos (upper right panel), Helmi streams (lower left panel) and Sequoia (lower right panel). These merger debris candidates are shown as coloured circles (the colour is related to the stellar orbit, indicating the vertical component of its angular momentum, Lz). Grey contour plots in the background represent disc stars of the same metallicity. Image credits: Gaia Data Release 3: Chemical cartography of the Milky Way by Gaia Collaboration et al. 2022. CC BY-SA 3.0 IGO.
Extending the exercise of combining the orbits of stars with their chemical compositions, not just for accreted but for the full sample of Milky Way stars, more exciting results are found. For the first time, it can be seen that the stars trapped in resonant orbits were formed from a material enriched in metals and impoverished in alpha-elements. This chemical pattern is typical of stars born in the inner Galactic disc. It reveals that the stars trapped in the resonant orbits have probably been displaced towards outer regions of the disc due to their interaction with the central bar and/or the spiral arms. This result is highlighted in Figure 9.
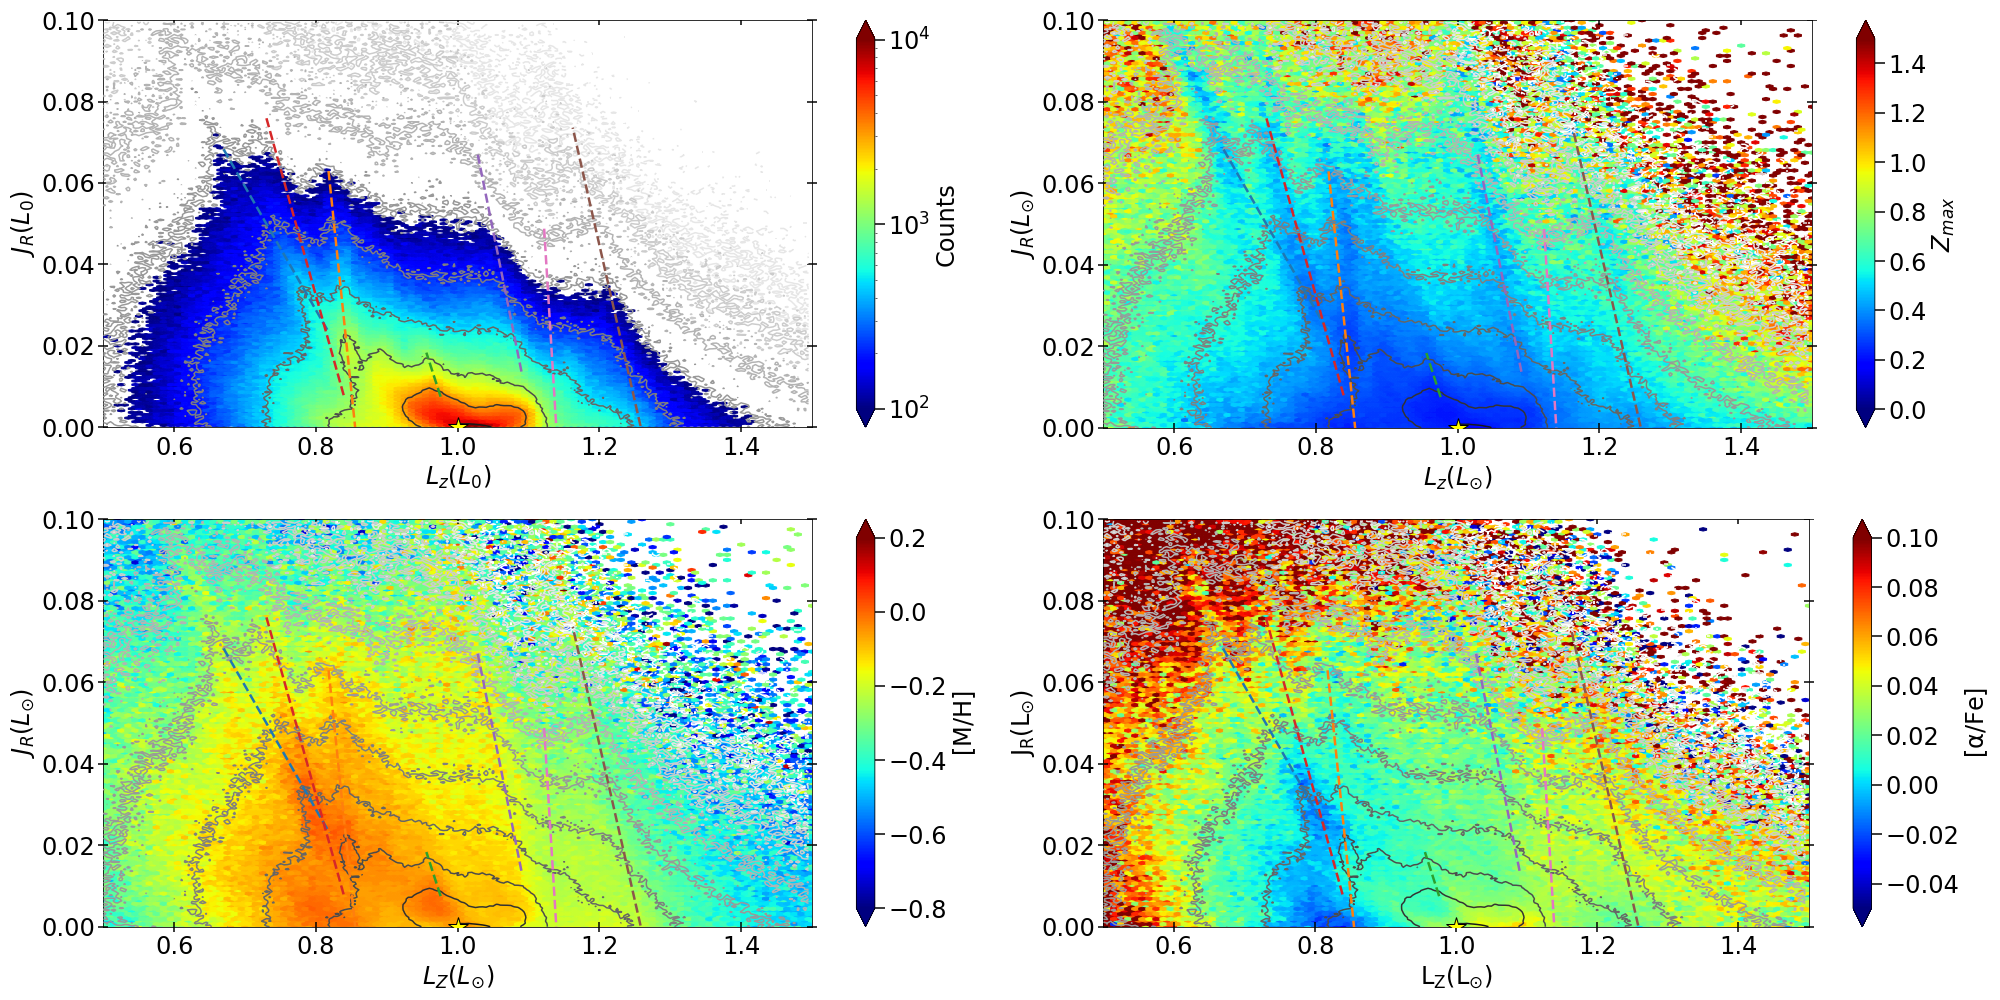
Figure 9: Variation of the radial action Jr with the angular momentum Lz. Upper left panel: coloured by number of stars. Upper right panel: coloured by maximum distance from the Galactic plane. Lower left panel: coloured by abundance of metals [M/H]. Lower right panel: coloured by relative abundance of alpha-elements like calcium with respect to iron [alpha/Fe]. Image credits: Gaia Data Release 3: Chemical cartography of the Milky Way by Gaia Collaboration et al. 2022. CC BY-SA 3.0 IGO.
Gaia DR3 data allow to study the orbits for an unprecedentedly large number of stars in the Milky Way. In the Galactic disc, most of the stars follow a rosette-like path in their orbits around the Galactic Center. These orbits can be identified by three parameters -the so called actions- whose values do not change with time. The mean distance between the star and the Galactic centre is related to the angular momentum of its orbit (Lz). Stars with larger Lz values can travel to the more external disc regions while lower Lz imply more inner orbits. Along its orbit, a star varies its distance to the Galactic center moving outwards and inwards in the radial direction, traveling from the apocentre (outermost location) to the pericentre (innermost location) and vice-versa. The amplitude of this radial excursion is tuned by the radial action (Jr).
The figure above, taken from Gaia Collaboration, Recio-Blanco et al. (2022), illustrates the variation of the radial action with the angular momentum. Some stars near the plane tend to follow preferential types of orbits, called resonant orbits, due to their interaction with the Galactic bar and the spiral arms. The characteristics of these resonant orbits (traced in the figure by dashed lines), reveal crucial information about our Galaxy, such as the speed of the bar and of the spiral structure.
For the first time now as well, thanks to Gaia DR3 data, the chemo-kinematical analysis of the perturbed motion of the stars in the Galactic disk is presented, see Figure 10 from Gaia Collaboration, Recio-Blanco et al. 2022. This perturbed motion is possibly caused by the crossing of a massive satellite like the Sagittarius dwarf galaxy. A distinct stellar velocity snail-like pattern was discovered with Gaia DR2 (Gaia Collaboration, Antoja, et al. 2018). This pattern is now visible in a much larger volume of the Galactic Disk.
Figure 10: Gaia’s first chemo-kinematical analysis of the perturbed motion of the stars in the Galactic Disk. Upper panels show the altitude of stars in our Galaxy versus their velocity in the same direction. The lower panels shows the metallicity excess with respect to the median of disc stellar populations at the same distance to from the Galactic centre. The plots are given at different disc annuli. Image credit: Gaia Collaboration, Recio-Blanco, et al. 2022. CC BY-SA 3.0 IGO.
The figure’s upper panels show the altitude of stars in our Galaxy above and below the plane of the Milky Way against their velocity in the same direction, for three different disc annuli: centered at 6.25 kpc, 8.25 kpc and 10.25 kpc from the Galactic centre. Only stellar motions and positions are considered in this top row. The snail shell pattern is emphasized by the Galactic rotational velocity of the stars (noted as Vphi) using a colour code: redder stars rotate faster around the Galactic centre.
In the lower panels, the pattern is also revealed by the stellar chemical properties, a completely new product of Gaia DR3. Redder stars are richer in metals than the median of disc stellar populations at the same distance from the Galactic centre. This metallicity excess is noted as ∆[M/H]. For the first time, especially in the external region, Gaia reveals that the stars being more affected by the disc perturbation were formed from a material highly enriched in metals. This enrichment is typical of younger stellar generations or of stars having migrated from central Galactic regions.
Video highlighting the Gaia DR3 chemical cartography. Credits: ESA/Gaia/DPAC – CC BY-SA 3.0 IGO. Acknowledgements: Based on the paper by the Gaia Collaboration, Recio-Blanco, et al. 2022. Main Video / Data sets: ESA/Gaia/DPAC, Stefan Jordan, Toni Sagristà, Alejandra Recio-Blanco, Pedro Alonso Palicio, Patrick de Laverny, Paul McMillan. Narrator: Paul McMillan. Video of focal plane: ESA. RVS spectrum animation: ESA/Gaia/DPAC/CU8-CU6, Alejandra Recio-Blanco and the GSPspec team. Created with Gaia Sky, developed by Toni Sagristà. Music "Cannon" by Johan Pachelbel, interpreted by Jean-Baptiste Bourrel and Alejandra Recio-Blanco, recorded and mixed by Didier Farrugia, music artist advisor Claude Galvez.
Credits: ESA/Gaia/DPAC
Story written by Tineke Roegiers, Alejandra Recio-Blanco, Patrick De Laverny
Published: 13 June 2022
- Removed a total of (24) style text-align:center;
- Removed a total of (18) style text-align:justify;
More Gaia DR3 stories?
Where are the stars? How far away are they? How bright are the stars?
What colour do they have? What are the stars made of?
Where do they go? Where do they come from? Do they approach us? Do they move away?
Did something move in front of the star? What is in between the stars?
How big, warm, old, ... are they? How do they Blink?
Is it a double star? Do they go boom? Is it a galaxy?
Is it a solar system object? Is it a quasar?
Who created the data? Can I Use Gaia data with other observatories?
How did DPAC produce the data for this star? Where is the data?
-
ESA's press release of Gaia Data Release 3
-
Gaia's Early Data Release 3 stories
-
ESA's press release of Gaia Early Data Release 3
- Removed a total of (16) style text-align:center;
- Removed a total of (1) style float:right;