
 Sign in
SAS Thread - omi - XMM-Newton
OM data reduction with SAS: image data processing chain
|
Introduction The thread explains how to process OM images to extract photometry for all detected sources. Expected Outcome OM threads describe how to process OM data using the corresponding chains within SAS. They give also some advice and hints on the checkings to be done on output SAS products to assess the quality of these output products. SAS Tasks to be Used Prerequisites Before running any of the OM chains users should check in the ODF what type of data they have: images, fast mode, and/or spectral images obtained with the grisms. Then the corresponding chain(s) can be run. Running a chain that does not correspond to the type of data will give a fatal error and it may produce some confusion to the user. A proper set up of SAS is mandatory. Useful Links Last Reviewed: 31 January 2025, for SAS v22.0Last Updated: 24 April 2018 |
Procedure
OM data processing from A to Z is performed by "chains": omichain, omfchain and omgchain for image, fast mode data and grism spectra, respectively. These are perl scripts which start the different tasks in the proper order using the appropriate parameters. The sub-tasks can be run separately, out of the chain, however this may be cumbersome and prone to errors because each individual task needs input data generated by a previous one.
A detailed description of the processing chains (omichain) as well as of each task can be found in the SAS documentation, both in HTML and Postscript format. A step by step description of the image mode chain and examples of the processing by individual execution of all tasks is given in the SAS User's Guide and also at this location.
OM image data are fully processed by the XMM-SAS Pipeline: for each exposure of a given observation all necessary corrections are applied to the data files. Then a source detection algorithm is used to identify the sources present in the image. Standard aperture photometry is applied to obtain the count rates for all detected sources. These rates are corrected for coincidence losses, dead time of the detector and time-dependent sensitivity degradation. Finally, OM instrumental magnitudes and standard colour corrections are computed. Also, AB magnitudes and absolute fluxes at the effective wavelength of the filters are computed. A final source list is obtained from all exposures and filters. Astrometric corrections are applied to each source's position and also the whole image is converted to sky coordinates space and rotated so as to have the North on the top. Default image windows are also combined to obtain a mosaic (per filter) of the FOV.
In principle there is no need for further data reduction. The observation source list should contain the calibrated data with their errors. However, some checking is recommended to verify the consistency of the data output.
The whole data processing can be repeated easily by a user, should any calibration file be updated, and what is more important, in case of doubtful results: the pipeline applies default options in all SAS tasks which can, if necessary, be changed by the user in order to improve the quality of the results. In particular, the source detection is very sensitive to artifacts which are very common in OM.
When comparing the data files obtained from the standard SSC pipeline with those obtained by running omichain, the user will notice two differences, the PPS files are compressed while the products from omichain are not, and in addition some intermediate files, with name starting with I, are preserved when omichain is run.
We outline here the checking that should be performed on OM processed data (by the standard Pipeline or by running SAS) and the use of one of the tasks, omdetect, where the user can modify parameters affecting the source detection and therefore the overall results of the data analysis.
- Checking omichain output products:
- The first check is to overlay the image source list onto the sky image using the task implot. This will allow checks that all sources are real and that the one(s) of interest have been properly identified. If the background is strongly affected by straylight features, this check is very important
High resolution default window (sky coordinates) Low resolution default window (sky coordinates) 
- For PPS products, the call is:
implot set=P0125320701OMS002SIMAGE2000.FTZ withsrclisttab=yes \
srclisttab=P0125320701OMS002SWSRLI2000.FTZ device='/XW'
- If the user has run omichain then a similar check can be done by displaying with ds9 the mod-8 corrected image, e.g. P0125320701OMS002IMAGE_0000.FIT and then loading the corresponding region file I0125320701OMS002REGION0000.ASC (this file is not a PPS product). In the case, the overlayed image can be seen with the command
ds9 P0561580301OMS012IMAGE_0000.FIT -regions I0561580301OMS012REGION0000.reg
- For PPS products, the call is:
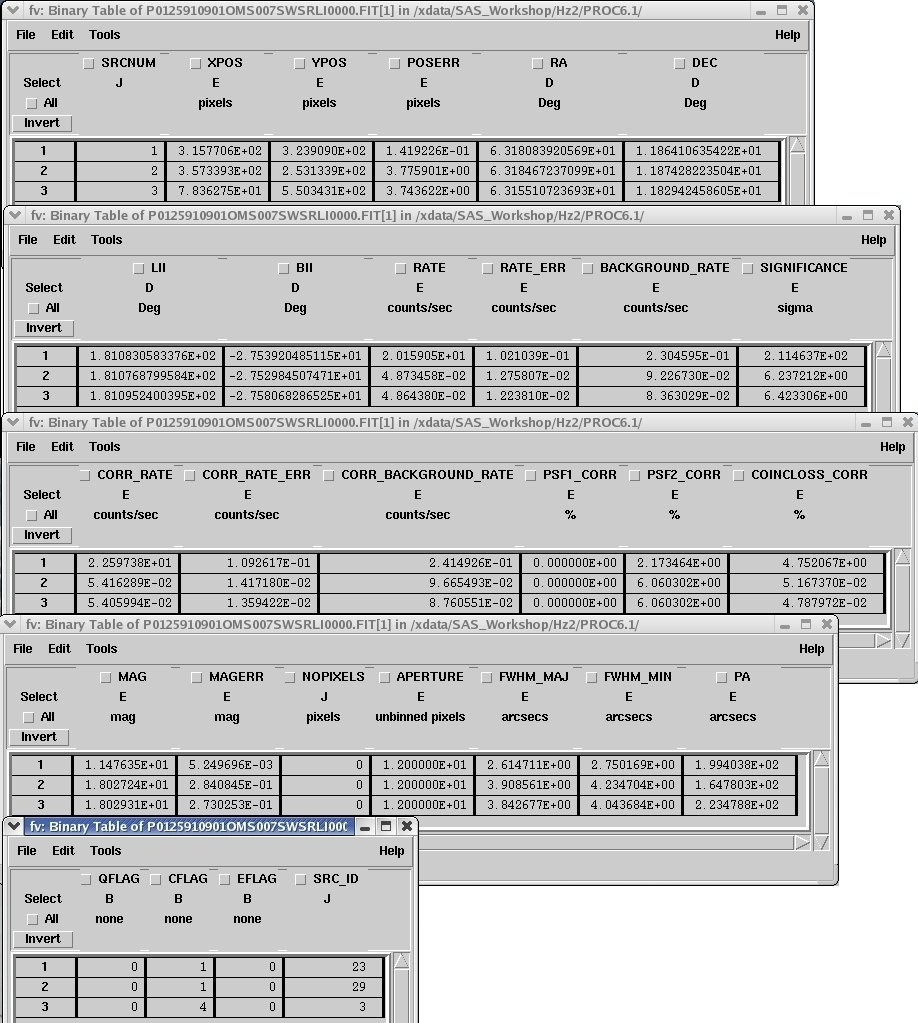
- The combined source list for each exposure is named P*SWSRLI* and can be inspected (e.g. using fv) to check that the sources of interest have been picked up in all the filters where they are visible and that the combined list contains colors and standard magnitudes for them.
- Check the tracking corrections: although the pointing stability of XMM is very good, one can verify it by examining the corresponding tracking history PDF file for each exposure, P*TSHPLT*.PDF
- The first check is to overlay the image source list onto the sky image using the task implot. This will allow checks that all sources are real and that the one(s) of interest have been properly identified. If the background is strongly affected by straylight features, this check is very important
- Improving the source detection:
- If the source of interest is close to straylight features or to other sources it may not be detected with the default settings of the omdetect task. We have to change some parameters in omdetect: as nsigma, (sigma above background for detection), or minsignificance (minimum significance of source for its inclusion in the source list) (see SAS documentation, or run omdetect -h for details).
Invoking omdetect with regionfile=your_region.asc will allow you a fast checking by overlaying the currently detected sources positions on the image with SAOImage using the created region file.
Low resolution default window (detector coordinates)
- Alternatively, the interactive tasks omsource or omphotom can be used to perform aperture photometry on the desired image.
- If the source of interest is close to straylight features or to other sources it may not be detected with the default settings of the omdetect task. We have to change some parameters in omdetect: as nsigma, (sigma above background for detection), or minsignificance (minimum significance of source for its inclusion in the source list) (see SAS documentation, or run omdetect -h for details).
- Detection in mosaic/stacked images: when an observation contains multiple exposures with a given filter, the corresponding images are added together and a second detection is performed to try to find faint sources not detected in the single exposures. This process may lead to dubious detections, therefore the new sources should be checked on the images. These sources are flagged in the sources merged list as "filter_SKY_IMAGE".
|
Caveats |
- Removed a total of (1) style text-align:center;
- Removed a total of (6) style text-align:justify;
- Removed a total of (2) align=center.
- Removed a total of (3) border attribute.
- Converted a total of (7) center to div.