
 Sign in
SAS Thread - rgs - XMM-Newton
How to reduce RGS data and extract spectra of point-like sources
|
Introduction This thread contains a step-by-step recipe to process RGS data of point-like sources. Expected Outcome RGS source and background spectra and light curves and the associated response matrices. SAS Tasks to be Used Prerequisites Useful Links
Last Reviewed: 31 January 2025, for SAS v22.0Last Updated: 26 April 2018 |
Procedure
This thread contains a step-by-step recipe to process RGS data of point-like sources to produce spectra and light curves, and the associated response matrices.
Throughout this thread it is assumed that files are named as:
PxxxxxxyyyyRrzeeettttttosss.FIT
| xxxxxx | proposal number |
| yyyy | observation number |
| r | 1 for RGS1, 2 for RGS2 |
| z | S for 'scheduled' exposures, U for 'unscheduled' exposures |
| eee | exposure number: from 001 to 999 |
| tttttt | type of file (events, spectrum, etc) |
| o | 1 for first order, 2 for second order, 0 if not applicable |
| sss | source number, when applicable |
- Set up your SAS environment as described in the SAS-startup thread
- Check the version of the SAS used to generate the PPS products (e.g. end of keyword CREATOR in the primary header of any pipeline file) against the current SAS version in http://www.cosmos.esa.int/web/xmm-newton/sas
- If the PPS version is lower than the current one, you should run rgsproc, the interactive version of the RGS pipeline to reprocess the data. It is always convenient to redirect the output to a log file:
rgsproc >& my_rgsproc_logfile
Allow enough time for it to finish. It may take between 5-10 minutes depending on the ODF size and your computer.
The task rgsproc can redo different stages of processing without starting from scratch. The different entry and exit points are called processing stages, of which there are six:
| 1:events | preliminary tasks, source-independent calibrations |
| 2:angles | aspect-drift corrections |
| 3:filter | filters events and exposure |
| 4:spectra | generates spectra |
| 5:fluxing | generates response matrices and a combined flux-calibrated spectrum |
| 6:lightcurve | generates lightcurves |
The default entry and final stages are 1:events and 6:lightcurve, respectively.
If the task has been run as far as the lightcurve stage, the following files would be created in the working directory:
| PxxxxxxyyyyRrzeeeEVENLI0000.FIT | filtered event list |
| PxxxxxxyyyyRrzeeeSRCLI_0000.FIT | source list |
| PxxxxxxyyyyRrzeeeSRSPEC1[2]001.FIT | first [second] order source+background spectrum |
| PxxxxxxyyyyRrzeeeBGSPEC1[2]001.FIT | first [second] order background spectrum |
| PxxxxxxyyyyRrzeeeRSPMAT1[2]000.FIT | first [second] order response matrix |
| PxxxxxxyyyyOBX000fluxed1[2]000.FIT | first [second] order combined fluxed spectrum |
| PxxxxxxyyyyRrzeeeSRTSR_1[2]001.FIT | first [second] order source lightcurve |
| PxxxxxxyyyyRrzeeeBGTSR_1[2]001.FIT | first [second] order background lightcurve |
If the task has been run only through spectra neither the response matrices nor the fluxed spectra or the lightcurves are created. The fluxing stage is the most time consuming, and therefore it is recommended to run it only once the results of the previous stages are satisfactory.
Is any further processing required?
- Check validity of prime source coordinates and extraction regions
The accuracy of the results of rgsproc depends critically on the accuracy of the coordinates used for the prime source, i.e. the source used to compute corrections for spacecraft attitude variations in the dispersion coordinate.
By default, the prime source is the only one for which an spectrum is extracted and the only one excluded from the background extraction region.
After rgsproc has been run, the source list will contain two sets of coordinates: PROPOSAL, that holds the target coordinates as given in the proposal and is, by default, the prime source, and ONAXIS, the average spacecraft pointing coordinates during the observation.
If you are working with the PPS files, then the source list is probably longer because during the pipeline processing some of the sources detected in the EPIC cameras are added to this file. Also, in the PPS, the prime source is chosen as the brightest of the EPIC sources within the RGS field of view.
Care should be taken that the target whose spectrum you are interested in is selected as prime in the source list and that its coordinates are correct:
- Open the source list with e.g. fv:
fv PxxxxxxyyyyRrzeeeSRCLI_0000.FIT
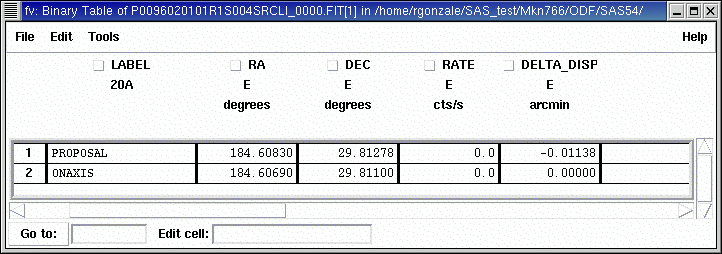
and check that the coordinates of the PROPOSAL source are correct.
If they need to be modified, the thread rgsproc, coordinates and masks explains how to do it.
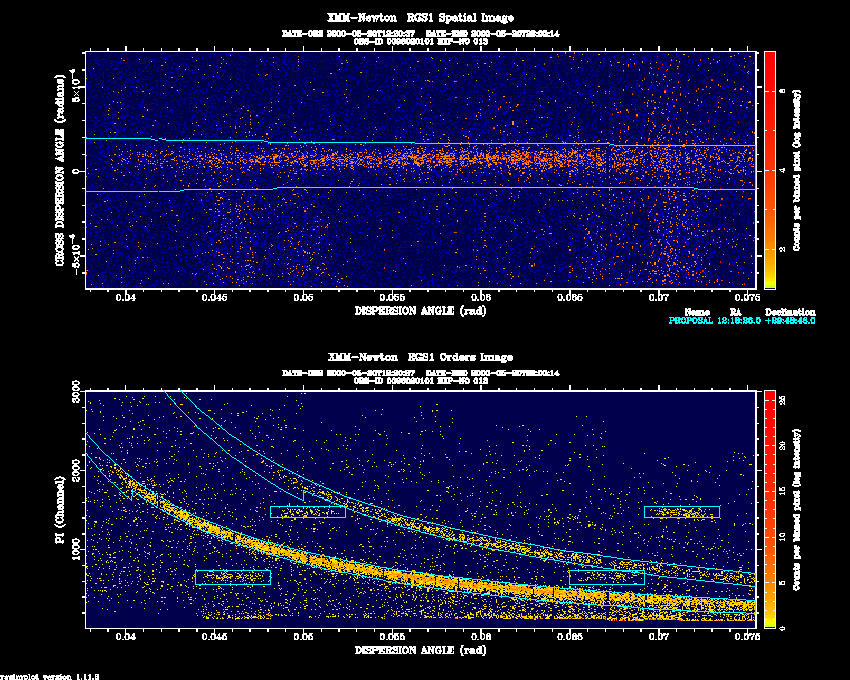
- Display the dispersion vs cross dispersion and dispersion vs energy images and overlay the selected region masks:
evselect table='PxxxxxxyyyyRrzeeeEVENLI0000.FIT:EVENTS' \
imageset='my_spatial.fit' xcolumn='M_LAMBDA' ycolumn='XDSP_CORR'
evselect table='PxxxxxxyyyyRrzeeeEVENLI0000.FIT:EVENTS' \
imageset='my_pi.fit' xcolumn='M_LAMBDA' ycolumn='PI'\
yimagemin=0 yimagemax=3000 \
expression='REGION(PxxxxxxyyyyRrzeeeSRCLI_0000.FIT:RGS1_SRC1_SPATIAL,M_LAMBDA,XDSP_CORR)'
rgsimplot endispset='my_pi.fit' spatialset='my_spatial.fit' \
srcidlist='1' srclistset='PxxxxxxyyyyRrzeeeSRCLI_0000.FIT' \
device=/xs
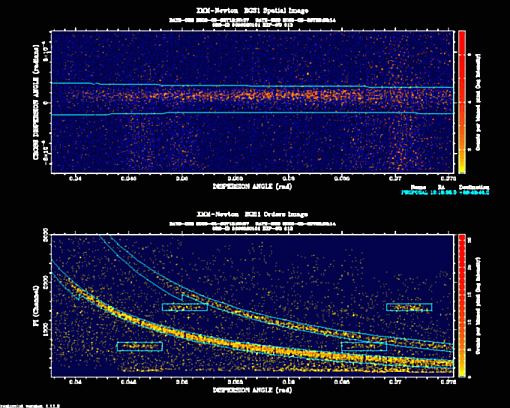
These plots can also be found in the PPS files under the names PxxxxxxyyyyRrzeeeIMAGE_0000.PNG and PxxxxxxyyyyRrzeeeORDIMG0000.PNG, for the spatial and order images with overlaid masks, respectively. Therefore, in case you are directly working with PPS files, you do not need to generate them.It is very important to check that the selection regions are correctly centred on the prime source. It is also important to check that the region used for background extraction excludes other existing sources.
In case the plot does not look fine, you may want to select a different source as prime, define new source(s) and/or new source-inclusion and background-exclusion regions. Please refer to the rgsproc, coordinates and masks thread for details.
- Open the source list with e.g. fv:
- Is my observation affected by high background ? If yes, how can I filter out the high-background time intervals?
In common with the other XMM-Newton instruments, RGS observations can be affected by high particle background periods caused by solar activity or by the Earth radiation belts. You should check your observations and, if necessary, filter out these periods before extracting any scientific products.
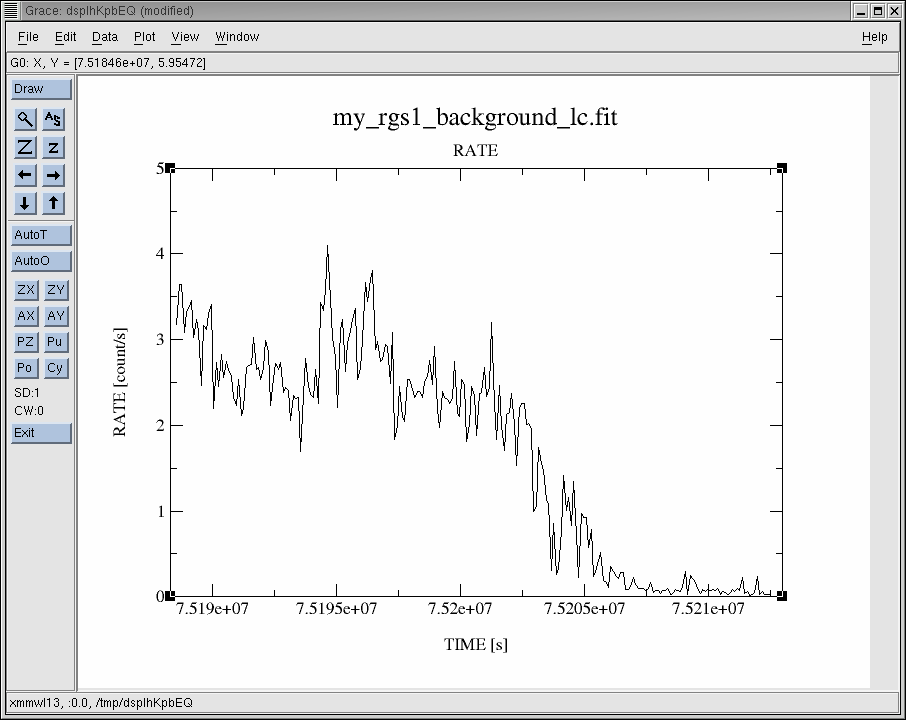
- Create a light curve of the pure background events:
evselect table=PxxxxxxyyyyRrzeeeEVENLI0000.FIT timebinsize=100 \
rateset=my_rgs1_background_lc.fit \
makeratecolumn=yes maketimecolumn=yes \
expression='(CCDNR==9)&&(REGION(PxxxxxxyyyyRrzeeeSRCLI_0000.FIT:RGS1_BACKGROUND,M_LAMBDA,XDSP_CORR))'
dsplot table=my_rgs1_background_lc.fit x=TIME y=RATE
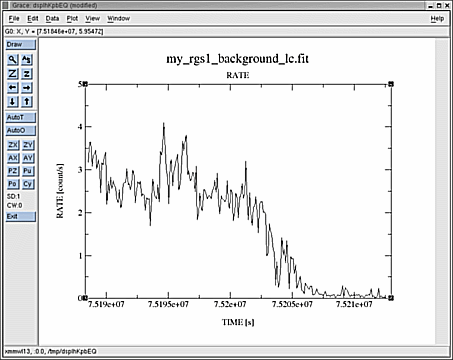
where timebinsize is the time binning of the light curve in seconds.The first part of the expression in the evselect call indicates that only events in CCD number 9 are selected (it is the one closest to the optical axis of the telescope, and the most affected by background flares). The second expression makes use of the background region already generated by rgsproc to get rid of genuine target variations.
Check the created light curve as displayed with dsplot for 'flares' with much larger count rates than the average. If such flares are visible, they can be filtered out using Good Time Intervals (GTIs, the set of time intervals in which a given scientific product is accumulated).
RGS event lists have GTI extensions generated by rgsproc that define good periods based on the attitude and housekeeping data included on the ODF.
- If necessary, create an additional GTI for filtering periods of high background out of the event list, to be used in conjunction with the internal GTI tables:
tabgtigen table=my_rgs1_background_lc.fit gtiset=my_low_back.fit expression='(RATE<maxr)'
The expression in the tabgtigen task indicates that only periods with count rates less than maxr counts/sec should be selected. The value of maxr should be chosen after inspection of the background light curve; it goes typically from 0.1 to 2 counts/sec.
- Re-process the data with rgsproc starting at the filter stage. The filter stage requires a combined event list named PxxxxxxyyyyRrzeeemerged0000.FIT as input.
If you have run rgsproc already, such a file has been created and it is already in your working directory. If you are instead working with the PPS products, the provided filtered event list is still a valid combined event list and can be used as input You should first copy it to a new file with the appropriate name:
cp PxxxxxxyyyyRreeeEVENLI0000.FIT PxxxxxxyyyyRrzeeemerged0000.FIT
and now you can process the data either with:
rgsproc entrystage=3:filter auxgtitables=my_low_back.fit
or with:
rgsfilter mergedset=PxxxxxxyyyyRrzeeemerged0000.FIT \
evlist=PxxxxxxyyyyRrzeeeEVENLI0000.FIT \
auxgtitables=my_low_back.fitrgsproc entrystage=4:spectra
- Create a light curve of the pure background events:
- Do I have everything I need to start analysing the spectra?
If you were happy with the PPS products, the validity checks were OK, and you did not need to run rgsproc at all, the answer is then YES !.
If you are starting the process from the ODF, once you have performed all the checks and/or corrections described above, do not forget to run rgsproc until the fluxing stage, to generate the response matrices.
Some Frequently Asked Questions...
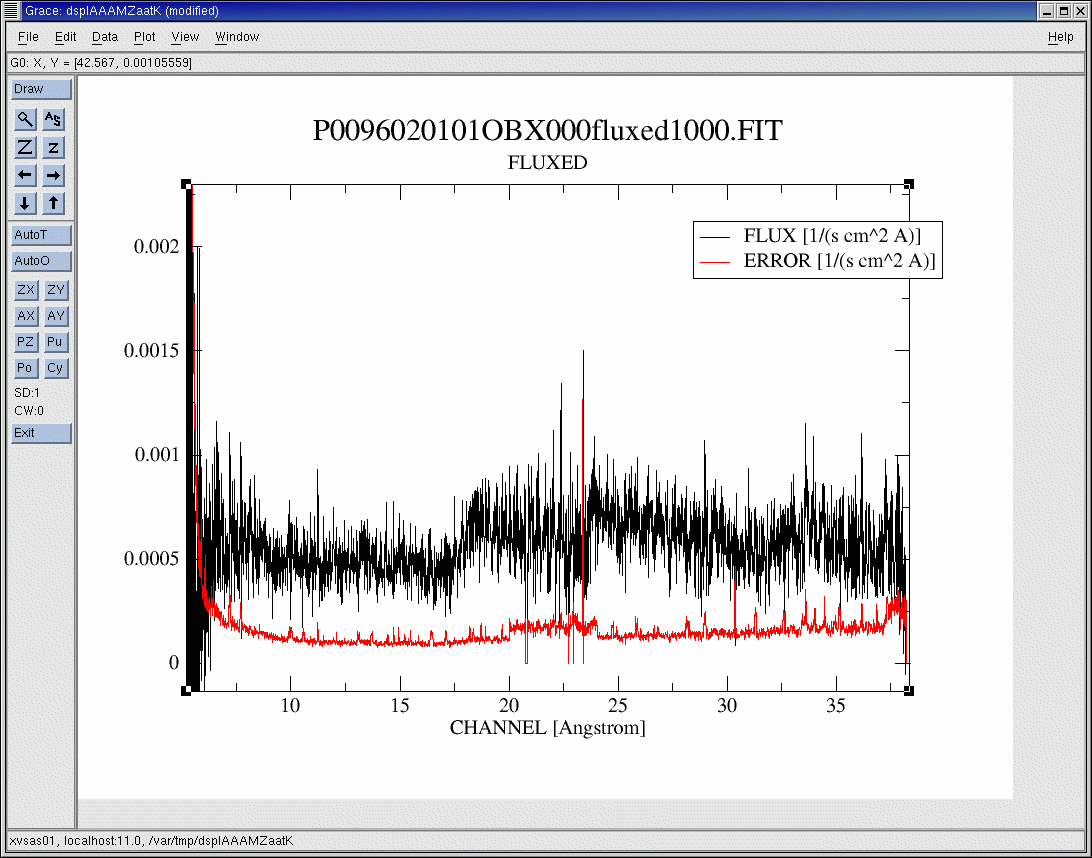
- I want to have a quick look at my spectra...
If you want to inspect a combined spectrum in flux units (rather than counts), in particular combining data from the two spectrometers (RGS1 and RGS2), then it is better to subtract the background from each spectrum. The fluxed spectrum is extremely useful for visualising the data free from the peculiarities of the instruments. It can be generated by running rgsproc with the finalstage left to its default value of fluxing, or can be taken from the PPS products.
dsplot table=PxxxxxxyyyyOBX000fluxed1000.FIT
displays the qualitative final first order spectrum after combining all RGS exposures within the observation, already calibrated in photons cm-2s-1Â-1, with the estimated errors overlaid.
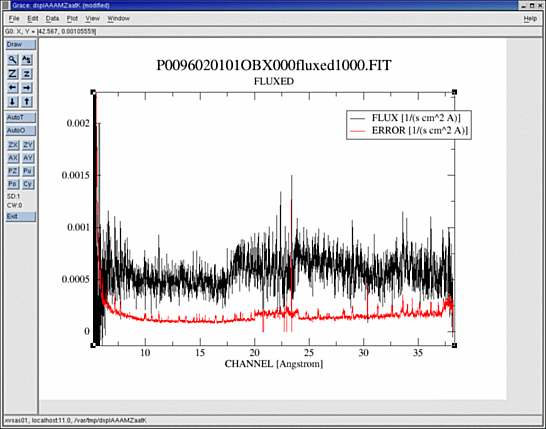
The combined fluxed spectrum is very useful to get a quick look of combinations of any number of observations of both RGS instruments, but it should not be used for detailed analysis of spectral features, as it does not take into account the redistribution matrix.
- Can I combine spectra from different observations?
Yes. The SAS task rgscombine combines RGS source and background spectra and response matrices. The only restriction is that all the spectra must belong to the same spectral order. Nevertheless, the output of this task must be examined carefully, as the algorithm is very sensitive to small pointing differences. Also, results can be problematic when combining spectra with different intensities.
- Should I use total or net (i.e. background subtracted) spectra?
For a quantitative analysis of the spectra, a spectral fitting package (XSPEC, SPEX, SHERPA ...) should be used. It is recommended to carry out such analysis on total and background spectra, i.e. not in background subtracted spectra.
In most cases, celestial sources are weak for RGS, giving low signal-to-noise spectra. Since Chi-2 minimisation techniques do not apply to spectra limited by low number of counts, a different likelihood function (implying Poisson statistics) should be used instead. Alternatively, the parameter rebin can be used for channel rebinning, e.g.
rgsproc rebin=5
to increase the number of counts per bin.
- Removed a total of (1) style text-align:center;
- Removed a total of (16) style text-align:justify;
- Removed a total of (5) border attribute.
- Removed a total of (3) cellpadding attribute.
- Removed a total of (3) cellspacing attribute.
- Converted a total of (6) center to div.