
 Sign in
Slew Survey XMMSL1 Catalogue - XMM-Newton
The XMM-Newton slew survey Source Catalogue:XMMSL1
User Guide to the Catalogue
| Release 1.6 | 26th Feb 2014 | Associated with Catalogue version 1.6 |
This User Guide refers directly to the FITS format version of the catalogue. Most of the content is also applicable to the database-served format (from XSA), but there are some aspects that are not applicable to the latter. Conversely, there are aspects of the database implementations that are not covered by this User Guide, but by the Help information provided from the database user interfaces.
The User Guide provides a detailed account of the production and contents of the catalogue.
Contents
- Summary
- Version
- 1. Introduction
- 2. Initial Processing
- 3. Processing
- 4. Combination of individual band surveys
- 5. Spurious flagging
- 6. Simulations
- 7. Identifications
- 8. Astrometry
- 9. Column Descriptions
- 10. Detection Limits
- 11. Flux conversion
- 12. Reference
Summary
XMMSL1 is the first catalogue of X-ray sources found in slew data taken from the European Space Agency's (ESA) XMM-Newton observatory, and has been constructed by members of the XMM SOC and the EPIC consortium on behalf of ESA.
Version 1.6
This version is an update to the existing catalogue. The update contains 390 extra slews taken between revolutions 2012 and 2441. An extra 6546 clean sources have been added with the update.
This release is known as XMMSL1_Delta6.
1. Introduction
XMMSL1_Delta6 has been generated from 390 slews, executed between revolutions 2012 and 2441 from 2010-12-05 to 2013-04-08. Not all slews made in this period have been used; slews with particularly high background or which gave processing problems have been rejected. A description of slew selection and initial processing is given in section 2. The slews have been processed separately in three energy bands
| Band | Energy (keV) | Description |
|---|---|---|
| 0 | 0.2-12 | Total |
| 4 | 2-12 | Hard |
| 5 | 0.2-2 | Soft |
to form three distinct surveys which have been subsequently combined to form one catalogue.
The release includes two FITS files. A full catalogue (xmmsl1D6_total.fits.gz), containing 41423 detections of sources found with a likelihood of DET_ML>8 and a "clean" catalogue (xmmsl1D6_clean.fits.gz) where all known bad sources have been removed and where the detection limit has been raised to DET_ML>10 in general and DET_ML>14 for sources found in images with a higher than usual background. Efforts have been made to identify spurious detections and 3494 have been flagged as such in the full catalogue.
There is an overlap between the slew paths, which has led to >951 sources being observed two or more times. The full catalogue has an expected spurious fraction of about 20%, determined from simulations of blank fields. A cleaner subset has been created, with sources of likelihood DET_ML>10 taken from images where the background count rate is <=3c/s and DET_ML>14 for other fields. This selection is expected to contain <1% of false sources in the soft band, ~9% in the hard band and ~4% in the total band. The number of sources (after removal of flagged sources) and sky area for the two catalogues is:
Full catalogue, sky area=47350 deg2
| Band | NSRC |
|---|---|
| 0 | 30808 |
| 4 | 6306 |
| 5 | 20136 |
| ALL | 37929 |
Clean catalogue, sky area=35350 deg2 down to det_ml>10 and 12000 deg2 down to det_ml>14.
| Band | NSRC |
|---|---|
| 0 | 17345 |
| 4 | 2160 |
| 5 | 14371 |
| ALL | 20163 |
The median flux is 3.0E-12 ergs/s/cm2 in the total band, 1.1E-12 in the soft band and 9.2E-12 in the hard band in the clean catalogue. All sources have been cross-correlated with existing astronomical catalogues and an identification assigned for each source where found. These have been included together with the source category, e.g. Galaxy, flare star etc., as columns in the catalogue together with any ROSAT All Sky Survey (RASS) counterpart. A list of IDs will be maintained. The quoted positions in the slew catalogue have a 1 sigma error of 8 arcseconds which for point sources is dominated by the accuracy of the attitude reconstruction during the slewing manoeuvers. The statistical position error quoted in the catalogue has a mean of ~4 arcseconds (1 image pixel) for non-extended sources. This is usually much larger for extended sources.
After correcting for overlaps, 65% of the sky has now been covered. The slew paths pass predominantly through the ecliptic poles as can be seen in the plot below, which shows all the slews contained in this catalogue release.
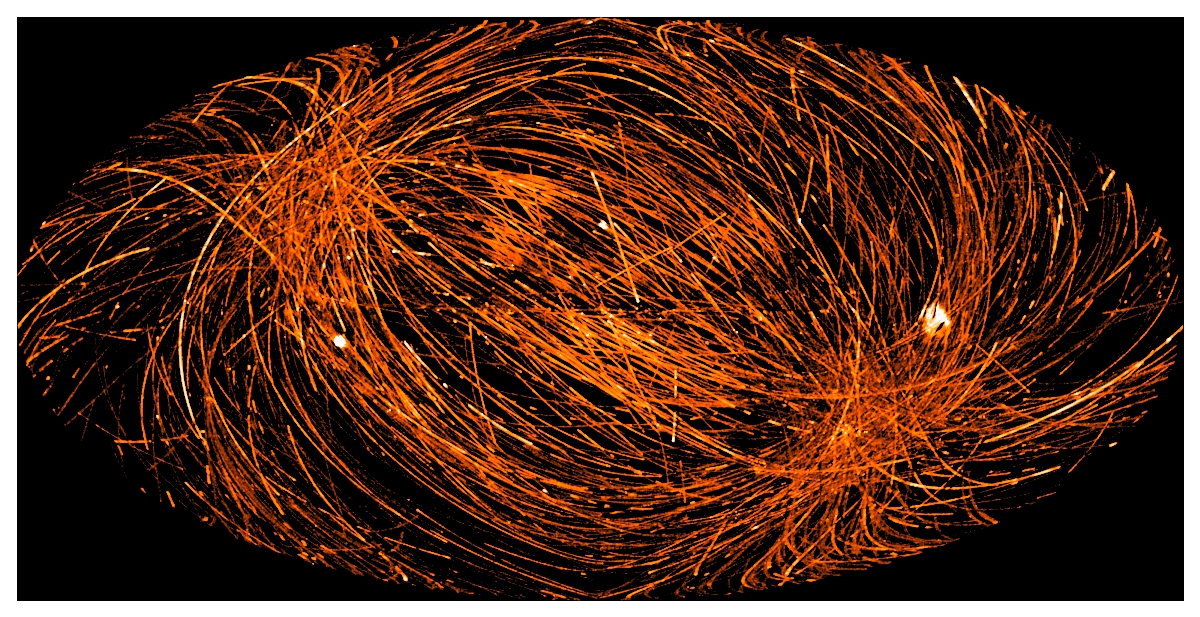
Below are shown the positions of the slew sources in Galactic coordinates. They have been logarithmically scaled with strength and colour-coded so that hard sources are blue and very soft sources, light-red.

2. Initial Processing
The XMM-Newton Slew Data Files (SDFs) for EPIC-pn were processed using the epchain package of the public xmmsas-6.1. For diagnostic reasons a few parameters were set to non-default values (e.g. keeping also events below 150 eV). For the Slew Survey catalogue only EPIC-pn exposures performed in Full Frame (FF), Extended Full Frame (eFF), and Large Window (LW) modes were selected, i.e. modes where all 12 CCDs are integrating (in LW mode only half of each CCD). The corresponding cycle times are 73.36 ms, 199.19 ms, and 47.66 ms, which converts to a scanned distance of 6.6 arcseconds, 17.9 arcseconds, and 4.3 arcseconds per cycle time, respectively. In the Small Window mode only the central CCD is operated and a window of 64 x 64 pixels is read out, i.e. only about 1/3 of a CCD. In the fast modes, Timing and Burst, only 1-dimensional spatial information for the central CCD is available and thus these three modes are not very well suited for source detection. Slews deemed to have a generally high background, with a mean 7.5 - 12 keV count rate greater than 5.5 c/s over the whole length of the slew, have been discarded.
3. Processing
Events are recorded initially in RAW or detector coordinates and have to be transformed, using the satellite attitude history, into sky coordinates. The tangential plane geometry commonly used to define a coordinate grid for flat images is only valid for distances of 1-2 degrees from a reference position, usually placed at the centre of the image. To avoid this limitation, slew datasets are divided into roughly one square degree event files, attitude corrected and then converted into images.
Source searching uses a semi-standard
'eboxdetect (local) + esplinemap + eboxdetect (map) + emldetect'
method, tuned to about zero background, and performed on a single image containing just the single events (pattern=0) in the 0.2-0.5 keV band, plus single and double events (pattern=0-4) in the 0.5-12.0 keV band.
4. Combination of individual band surveys
Detections in the three energy bands have been combined using a match radius of 30 arcseconds to identify sources detected in more than one band. The match radius is approximately 4 sigma and is reasonable for point sources because of the great scarcity of sources (0.8 detections per square degree on average) at the flux levels probed by the slew survey.
5. Spurious flagging
Spurious detections are produced due to systematic effects with the instruments and detection software. These sources have been screened and flagged ('t' for 'true' or 'f' for 'false') in the different categories described below. When a source is flagged true the FLAG_COMMENT column gives a more detailed explanation of the problem for each particular source.
VER_INEXT:
This quality flag is used to ensure that only one source is quoted for extended objects; that with the highest det_ml. Two different cases have been found: - Large extended sources (mainly SNR) that often result in multiple detections of the same object. These have been identified by searching for images with a large number of sources - Other spurious sources (mainly due to Cluster of Galaxies) appear because the technique used for merging detections in the different energy bands is optimal for point-like sources. This consists of considering the same source if their centres lie within 30 arcsec of each other, but this offset has to be bigger for extended sources. This is expected to be fixed in a new version of the catalogue.
VER_HALO:
A halo of false detections is often seen around bright slew sources due to the imperfect modelling of the PSF (as was also seen in the creation of the 1XMM Serendipitious Source Catalogue). Due to the reduced exposure time in slew observations this is only important for very bright sources rate>>10c/s. For flagging this category of spurious, the different sources detected in the same image and containing a very bright source have been inspected. If their centres lie within 30 arcsec but corresponding to the same object, the one with highest det_ml is taken as the non-spurious detection and the rest have been flagged 't'.
VER_HIGHBGND:
One of the characteristics of slew exposures is their low background (of average ~0.1 c/arcmin2). Although high background slews taken at times of enhanced solar activity have been rejected for the processing, some high background sub-images have been detected in observations with a general rate below the threshold used for rejecting entire slews. These sources have been identified and flagged in this category looking for images with a large number of sources (without being included in the VER_INEXT category of spurious sources explained above). It has been checked that no other bright off-axis source could generate the detections. Rates for all images have also been computed.
VER_NREDG:
Some sources have been detected lying on the border of consecutive images of the same slew observation, so the position of both detections of the same object is unlikely to be accurate. These spurious sources have been identified by seaching for sources in consecutives images whose centres lie within 30 arcsec.
VER_PSUSP:
This quality flag is related to the astrometry performance and arises after a careful visual examination of the RAF files. The attitude reconstruction of some slews appears to be "turbulent" rather than smooth, so source positions lying in these poorly attitude reconstructed regions are likely to be inaccurate.
VER_FALSE:
This flag is related to spurious detections not included in the other flags. Two sources (both are close to an SNR) which have been discovered to lie outside the images they are supposed to belong to, and hence have a calculated exposure time of zero, have this flag set true. A further 27 detections, due to out of field-of-view reflections from SCO X-1 also have this flag set.
6. Simulations
To estimate the number of sources caused by statistical fluctuations in the background a series of simulations have been run to:
- Assess the effect of the number of photons in an image on the number of spurious detections as a function of detection likelihood.
An average sized slew image was taken and a number of photons inserted at random positions. The number of false sources produced is a strong function of the number of photons in the image, with the peak appearing with a coverage of a few hundred photons over this size image. It is suspected that the peak in the curves is due to peculiarities of the background estimation technique which fits a spline-surface to the image. The majority of the slew images contain about 100 counts where the number of spurious sources produced by the background is small. - Equate the number of counts in an image with the measured background rate.
The background rate in XMM images is traditionally measured by finding the count rate above 10 keV (PI>10000), where the contribution from celestial X-ray sources is expected to be very small. We see a strong correlation between this background estimator and the total number of source photons. - Estimate the total number of spurious sources in each energy band.
There were 11449 images which have been searched for sources to form the original XMMSL1 catalogue. For each of these images, in each energy band, the position of the photons has been randomly reset and the images searched again using the same software. The table below gives, for different values of the minimum acceptable detection likelihood, false source numbers which are compared with the total number of sources detected in the catalogue. It can be seen that using a descriminator on the background count rate helps to reduce the fraction of spurious detections while maximising the number of real sources. The optimum extraction for the hard band and total band catalogues uses a likelihood limit of 10 for sources found in low background images [ (PI>1000) <= 3c/s ] and a limit of 14 for sources detected in images with a higher background. This selection has been used to form the "clean" catalogue which is the default selection within XSA. As can be seen from the Table , this is quite conservative for the soft band catalogue.
| Band | DET_ML>8 | DET_ML>8, rate<3 | DET_ML>10 | DET_ML>10, rate<3 |
DET_ML>14, + (DML>10, rate<3) |
|---|---|---|---|---|---|
| ALL | 4730 (929) | 3471 (456) | 3015 (195) | 2436 (106) | 2713 (109) |
| 0 | 3882 (580) | 3037 (348) | 2596 (118) | 2171 (86) | 2384 (89) |
| 4 | 694 (272) | 429 (93) | 314 (61) | 241(24) | 261 (25) |
| 5 | 2619 (186) | 1994 (69) | 2042 (46) | 1649 (13) | 1888 (13) |
7. Identifications
All sources detected in the survey have been correlated with different catalogues in order to identify the XMM-Newton slew sources with previously known objects. The catalogues used for this aim comprises two astronomical databases, a catalogue of clusters of galaxies and nine other catalogues (some of them have been queried through the HEASARC astronomical database). Although the astrometric uncertainty of the slew sources was found to be 8 arcsec, the offset radius for the correlations was 30 arcsec (with a few exceptions described below) in order to include sources from catalogues with worse accuracy or truncated coordinates. For the EXOSAT CMA catalogue the offset radius was 45 arcsec, and for the Einstein IPC it was 2 arcmin, both due to their high uncertainty in source coordinates. A radius of 5 arcmin was chosen for the clusters catalogue due to the extension of this type of objects. As not all catalogues have the same astrometric accuracy distances are rounded to the nearest 0.1 arcmin in many cases. The identification process results in unidentified sources, sources with a single counterpart and sources with multiple matches. A hierarchical selection scheme has been applied for sources with different counterparts. A decision has been made to derive the most plausible identification candidate using the technique described below. Firstly, the SIMBAD and NED astronomical databases have been used for the cross-correlation and results from both databases have been compared in detail (SIMBAD has been queried in the frame of the Astronomical Virtual Observatory (AVO)).When a source has the same counterpart in both databases the one selected for the identification is that which gives more specification about the source category. When contradictory identification candidates have been found, the closest one has been chosen. These two databases provide the large majority (90%) of the total number of identifications. Then, a correlation with a clusters table (Abell and Zwicky Clusters of Galaxies ) has been performed. The final identification for those extended sources (ext>2.0) with a SIMBAD/NED and also a cluster correlation comes from the clusters table. The rest of catalogues used for the cross-match are listed below ordered in priority for the preferred identification. For sources with multiple matches in a catalogue, the identification was selected as the closest match. These catalogues are: All-Sky Optical Catalog of Radio/X-Ray Sources, Catalog of PSPC WGA Sources, Einstein IPC Sources Catalog, EXOSAT CMA Images/Lightcurves, ROSAT All-Sky Survey catalogue, ROSAT Results Archive Sources for the PSPC ROSAT Results Archive, Sources for the HRI RXTE Master Catalog, XMM-Newton Serendipitous Source Catalog, Version 1.1.0, INTEGRAL Bright Source Catalog.
Identifications are offered for 73% of the sources, while roughly 50% of clean catalogue slew sources have a ROSAT counterpart. Results from the identification process appear in the final catalogue in the columns:
IDENT: name of the source
ALTIDENT: alternative name of the source
ID_DIST: distance in arcmin between the slew source and the identification (distances are rounded in 0.1 arcmin).
ID_CATEGORY: type of the identified source that, when existing, has been extract ed from the catalogues (it is not very homogeneous because type convention is different within the catalogues)
RASSNAME: the closest RASS match
RASSDIST: distance in arcsec to the closest RASS match.
8. Astrometry
The attitude information of the XMM-Newton satellite is provided by the Attitude and Orbit Control Subsystem (AOCS). A star tracker co-aligned with the telescopes allows up to a maximum of five stars to be continuously tracked giving accurate star position data every 0.5 seconds, which operates in addition to the Sun sensor that provides a precise Sun-line determination. Such information is processed resulting in an absolute accuracy of the reconstructed astrometry of typically 1 arcsecond during pointed observations. For the open-loop slews, large slews outside the star-tracker field of view of 3 x 4 degrees, the on-board software generates a three axis momentum reference profile and a two-axis (roll and pitch) Sun-sensor profile, both based on the ground slew telecommanding. During slew manoeuvring a momentum correction is superimposed onto the reference momentum profile and, as there are no absolute measurements for the yaw axis, a residual yaw attitude error exists at the end of each slew that may be corrected in the final closed-loop slew. To process slew data, attitude information is taken from a Raw Attitude File (RAF) which stores attitude points every 40-60 seconds. The times quoted in the RAF are offset from spacecraft time by 0.75 seconds, which has to be corrected in the software, otherwise a 1 arcminute offset in source positions is seen along the slew direction. Initially the correction was performed in the slew specific software but from SAS 7.0 has been included in the general SAS software. The SAS astrometry software interpolates between the rather sparse RAF points using a curve fit. Five RAFs have been found to contain one bad attitude point which is sufficient to totally corrupt the attitude solution over a considerable section of the slew. In these cases affected sources have been removed from the CLEAN catalogue and the error on their position has been set to 120 arcseconds. In a further 7 slews a part or all of the attitude seems to be turbulent rather than smooth. It is not known why this occurs and no attempt to fix it has been made. Sources affected by this attitude problem have a position suspect (VER_PSUSP) flag set to true. The error introduced in the source positions can be of the order of 1 arcminute. A sample of point sources from the catalogue with matches in the SIMBAD catalogue have been analysed and show that 68% lie within 8 arcseconds of the SIMBAD position and 90% within 17 arcseconds.
9. Column Descriptions
UNIQUE_SRCNAME
This is the official name for sources detected in the XMM-Newton slew survey. It starts with the prefix, XMMSL1, the IAU registered designator, and then encodes the J2000 sky position, e.g. XMMSL1 J010537.6+364858 The name is assigned in two passes. When the three independent energy band source lists are combined to form one catalogue the source name is set using the position in the band where the DET_ML likelihood is the highest. A second pass is then performed such that sources which have been observed in more than one slew are given the same name. Again, priority is given depending on the detection likelihood. Note that the combination of UNIQUE_SRCNAME and observation number (OBSID) is unique. Detections are deemed to be from the same source if their centres lie within 30 arcseconds of each other. Note that the statistical position error (RADEC_ERR) calculated by the source search software is not used in this calculation. This is because the mean error on the slew attitude reconstruction of 8" dominates the error budget. Given the scarcity of slew sources (0.8 detections per square degree) on the sky, 30" was found to be a reasonably robust match radius for point sources. It is not so good for extended sources and the catalogue may contain multiple detections of the same extended source with different names.
Please note that no attempt has been made to assign a UNIQUE_SRCNAME from the original XMMSL1 catalogue to sources added in the subsequent delta increment(s).
OBSID
This is the observation number assigned to the slew by the satellite scheduling system. Slew observations always begin with a 9 to distinguish them from pointed observations, followed by a 4 digit satellite orbit number and a 5 digit slew designator, e.g. 9031400004, refers to the second slew of revolution 314.
SOURCENUM
This is a number which uniquely identifies each detection in an observation.
RA, DEC
The J2000 right ascension and declination of the source.
Units: Degrees
In the event of a detection in more than one energy band, the coordinates are taken from the band with the highest detection likelihood.
RADEC_ERR
The statistical error on the source position as returned by the source detection software.
Units: arcseconds
LII, BII
The galactic coordinates of the source.
Units: Degrees
HR1
The hardness ratio, defined as
HR1 = (rate_b4-rate_b5)/(rate_b4+rate_b5)
where rate_b4 is the hard band count rate and rate_b5 is the soft band count rate. This has been calculated for the 168 sources which have a positive detection in both bands (see hratios.ps)
HR1_ERR
Error on the hardness ratio calculated as:
sqrt(rate_b4_err*rate_b4_err + rate_b5_err*rate_b5_err) /(rate_b4+rate_b5)
where rate_b4_err and rate_b5_err are the errors on the hard and soft band count rates respectively.
DATE_OBS, DATE_END
The start and end times of the slew containing this source.
Format is: Year-Month-dayThours:minutes:seconds, e.g. 2004-07-12T14:23:16
SCTS_B0
The number of background subtracted counts, in the total energy band (0.2-12 keV).
Units: counts
This number has been corrected for photons scattered outside the source region due to the Point Spread Function (PSF).
SCTS_B0_ERR
Statistical 1 sigma error on the total band source counts.
SCTS_B4
The number of background subtracted counts, in the hard energy band (2-12 keV), corrected for the PSF. Units: counts
SCTS_B4_ERR
Statistical 1 sigma error on the hard band source counts.
SCTS_B5
The number of background subtracted counts, in the soft energy band (0.2-2 keV), corrected for the PSF. Units: counts
SCTS_B5_ERR
Statistical 1 sigma error on the soft band source counts.
X_IMA_B0, Y_IMA_B0
The X and Y position of the source in the total band image in image pixels.
Units: 4.1"x4.1" pixels
X_IMA_B4, Y_IMA_B4
The X and Y position of the source in the hard band image in image pixels.
Units: 4.1"x4.1" pixels
X_IMA_B5, Y_IMA_B5
The X and Y position of the source in the soft band image in image pixels.
Units: 4.1"x4.1" pixels
EXT_B0
The spatial extension of the source in the total energy band.
Units: 4.1"x4.1" image pixels
This measures the deviation from a point source of the spatial distribution of the source counts. It is defined as the sigma of a Gaussian which would need to be convolved with the point spread function (PSF) to produce the observed counts distribution. The software (emldetect) fits sources out to a maximum extent of 20 pixels.
EXT_B0_ERR
Statistical one sigma error on the total band extension parameter.
EXT_B4
Spatial extension of the source in the hard energy band. Units: 4.1"x4.1" image pixels
EXT_B4_ERR
Statistical one sigma error on the hard band extension parameter.
EXT_B5
Spatial extension of the source in the soft energy band.
Units: 4.1"x4.1" image pixels
EXT_B5_ERR
Statistical one sigma error on the soft band extension parameter.
DET_ML_B0
The detection likelihood in the total (0.2-12 keV) energy band.
DET_ML_B4
The detection likelihood in the hard (2-12 keV) energy band.
DET_ML_B5
The detection likelihood in the soft (0.2-2 keV) energy band.
EXT_ML_B0
Likelihood of the source being extended in the total band.
EXT_ML_B4
Likelihood of the source being extended in the hard band.
EXT_ML_B5
Likelihood of the source being extended in the soft band.
BG_MAP_B0
Background value for the total band.
Units: Counts per pixel
BG_MAP_B4
Background value for the hard band.
Units: Counts per pixel
BG_MAP_B5
Background value for the soft band.
Units: Counts per pixel
EXP_MAP_B0
The effective on-axis exposure time in the total energy band.
EXP_MAP_B4
The effective on-axis exposure time in the hard energy band.
EXP_MAP_B5
The effective on-axis exposure time in the soft energy band.
FLUX_B0
The source flux in the total energy (0.2-12 keV) band.
Units: 10-12 ergs/s/cm2
Derived for an absorbed power-law spectrum of slope 1.7 and Nh=3.0E20 cm-2
FLUX_B0_ERR
The error on the total band source flux
FLUX_B4
The source flux in the hard energy (0.2-12 keV) band.
Units: 10-12 ergs/s/cm2
Derived for an absorbed power-law spectrum of slope 1.7 and Nh=3.0E20 cm-2
FLUX_B4_ERR
The error on the hard band source flux.
FLUX_B5
The source flux in the soft energy (0.2-12 keV) band.
Units: 10-12 ergs/s/cm2
Derived for an absorbed power-law spectrum of slope 1.7 and Nh=3.0E20 cm-2
FLUX_B5_ERR
The error on the soft band source flux.
RATE_B0
The total band count rate
Units: counts/second
RATE_B0_ERR
The error on the total band count rate
RATE_B4
The hard band count rate
Units: counts/second
RATE_B4_ERR
The error on the hard band count rate
RATE_B5
The soft band count rate
Units: counts/second
RATE_B5_ERR
The error on the soft band count rate
RA_B0, DEC_B0
The J2000 celestial position of the total band source.
RADEC_B0_ERR
The statistical error on the total band position.
RA_B4, DEC_B4
The J2000 celestial position of the hard band source.
RADEC_B4_ERR
The statistical error on the hard band position.
RA_B5, DEC_B5
The J2000 celestial position of the soft band source.
RADEC_B5_ERR
The statistical error on the soft band position.
LII_B0, BII_B0
The galactic position of the total band source.
LII_B4, BII_B4
The galactic position of the hard band source.
LII_B5, BII_B5
The galactic position of the soft band source.
VAL_FLAG
A text string which is set to 'CLEAN_SAMPLE' if this source is included in the clean subset. Otherwise the string is set to 'XXXXXXXXXXXX'
SRCNAME_B0
The source name defined in the total band list. The format is 'xs' followed by the revolution number, the observation ID and the source position, e.g. xs0841_9084100002_12:57:07.5+01:50:42
SRCNAME_B4
The source name defined in the hard band list. The format is 'xs' followed by the revolution number, the observation ID and the source position, e.g. xs0841_9084100002_12:57:07.5+01:50:42
SRCNAME_B5
The source name defined in the soft band list. The format is 'xs' followed by the revolution number, the observation ID and the source position, e.g. xs0841_9084100002_12:57:07.5+01:50:42
XIMNAME_B0
The name of the image containing the total band detection.
XIMNAME_B4
The name of the image containing the hard band detection.
XIMNAME_B5
The name of the image containing the soft band detection.
VER_INEXT
If set true, this flag notes that a detection has been found within an extended source and is probably false. This flag is used to ensure that only one source is quoted for the large supernova remnants.
VER_HALO
If set true, this flag indicates that a detection lies within the point spread function, or halo, of a very bright source and is probably spurious.
VER_HIBGND
If set true, this flag indicates that the source lies within a bright region, caused by high background, and is probably spurious.
VER_NREDG
If set true, this flag indicates that the source has been detected in two consecutive images of the same slew. This can occur if the source lies on the border between slews and implies that the position of the source is unlikely to be accurate.
VER_PSUSP
This flag indicates that the quoted position of the source is likely to be inaccurate. In a few slews the attitude reconstruction is poor and in these cases the actual position of the source is difficult to determine and can be wrong by an arcminute.
VER_FALSE
This is a catch-all for problems not included in the other flags. In the catalogue 29 sources have this flag set true, in two cases it is because the exposure time has been calculated as zero and in the other cases the detections are due to reflection from a close, but out of the field-of-view SCO X-1.
FLAG_COMMENT
A comment which explains why a particular source flag has been set to true.
IDENT
Cross-correlations of the positions of the slew sources with astronomical databases and catalogues have been performed (see section on IDs). This column gives the catalogue name of the best match.
ALTIDENT
An alternative name for the best match source.
RASSNAME
The name of the closest Rosat All Sky Survey (RASS) source.
ID_CATEGORY
The source type as returned by SIMBAD, NED and the other resources used in the cross-matching process. This is directly taken from the catalogue in question and no attempt has been made to rationalise the values.
ID_RESOURCE
The astronomical database or catalogue from which the best match has been selected. e.g. SIMBAD, NED, etc.
ID_DIST
The distance in arcminutes between the best match candidate and the slew survey source.
Units: arcminutes
RASS_DIST
The distance from the best match ROSAT source and the slew source. Units: arcseconds
MODE_ID
Observing mode of the EPIC-pn camera. FF= Full frame mode eFF = extended full frame mode LW = large window mode
IMAGE_BG_RATE
Peak background count rate in the image from which the source was extracted. This is measured as the count rate, over the whole image, for events with energy > 10 keV (PI>10000). Units: counts/second It is quoted to a resolution of 0.1 c/s and is used to determine the overall background environment in which a source was detected. This value is used in the creation of a clean subsample of the catalogue (see top level description). Generally, the higher this value, the greater the probability that the source is spurious. This is especially true if the detection likelihood of the source is less than 14. The value has been tabulated for images with a background rate greater than 2 c/s. For quieter images the value has been artifically set to 1.9 c/s.
10 Detection Limits
The minimum detectable count rate for a given band is ~0.4 c/s, for a source which passes through the centre of the detector and for typical background levels. A rough flux upper limit is then available by multiplying this count rate by the conversion factors specified below. This is for each band:
| Band | Energy (keV) | Flux limit (10-12 ergs/s/cm2) |
|---|---|---|
| Total | 0.2-12 | 1.3 |
| Hard | 2-12 | 3.7 |
| Soft | 0.2-2 | 0.57 |
11 Flux Conversion
Source fluxes have been calculated from count rates based on energy conversion factors assuming a spectral model of an absorbed power-law with Nh = 3.0 * 1020 cm2 and slope = 1.7 (see XMM science survey centre memo, SSC-LUX TN-0059 for a general description of the technique) The energy conversion factors used here are:
| Band | Conv factor |
|---|---|
| Total | 3.159 |
| Hard | 9.144 |
| Soft | 1.436 |
and convert between the source count rate (c/s) to flux in these energy bands in units of 10E-12 ergs/s/cm2
12 Reference
- "The first XMM-Newton slew survey catalogue: XMMSL1"
R.D. Saxton, A.M. Read, P. Esquej, M.J. Freyberg, B. Altieri, D. Bermejo
2008, A&A 480, 611
- Removed a total of (1) style text-align:center;
- Removed a total of (66) align=center.
- Removed a total of (2) align=left.
- Removed a total of (9) border attribute.
- Converted a total of (9) center to div.