
 Sign in
igr-j16318 - XMM-Newton
XMM-Newton Observations of IGR J16318-4848
Events
- On 2003 February 4, the XMM-Newton SOC received a Target of Opportunity notification after the detection of a transient source, IGR J16318-4848, by the ISGRI detector of the IBIS instrument onboard ESA's INTEGRAL satellite.
- This transient gamma-ray source was immediately approved by the XMM-Newton SOC for a ToO observation.
The observation was started on 2003-02-10T16:20:41Z under ObsId=0154750401 during XMM-Newton's revolution number 0581. - The pointing coordinates were RA = 16:31:52 and Dec = -48:48:30 (IAUC/8063, 2003 February 1). The uncertainty in coordinates was reported as being about 2 arcminutes.
- A source was shortly identified in EPIC, ~30 arcseconds off in Dec and ~75 arcseconds off in RA from the reported coordinates. The EPIC source position of the IGR J16318-4848 X-ray counterpart was determined as RA = 16:31:48.6 and Dec -48:49:00. As stated below this position is still subject to an uncertainty of about 4 arcseconds.
- On 2003 February 11, Murakami et al. reported (IAUC/8070) the detection of an X-ray source in ASCA archival data at a position consistent with that of IGR J16318-4848. The SIS position was determined as RA = 16:31:49 and Dec = -48:49:12 with an uncertainty of about 0.8 arcminutes. A hint of an iron emission line at 6.4 keV was noticed.
- The images, spectra and light curve presented here are based on a preliminary processing without the re-constituted XMM-Newton Attitude History File. Therefore, the positions quoted are subject to an uncertainty of 4 arcseconds.
Data
- The Observation Data File (ODF) is available here as 0154750401.tar.gz.
- The Pipeline Products are now also available in the ftp area. Details of the Pipeline process can be found here
Preview of XMM-Newton images
Large window mode pn image in sky coordinates. The IGR J16318-4848 error circle based on IAUC/8063 is marked in blue.

Full frame mode MOS-2 image in sky coordinates. The IGR J16318-4848 error circle based on IAUC/8063 is marked in blue.

Quick Look Analysis
Light curve for the brightest pn source. Only pixels within ~50 arcseconds radius around the source peak have been considered. Click on the image to see it at high resolution
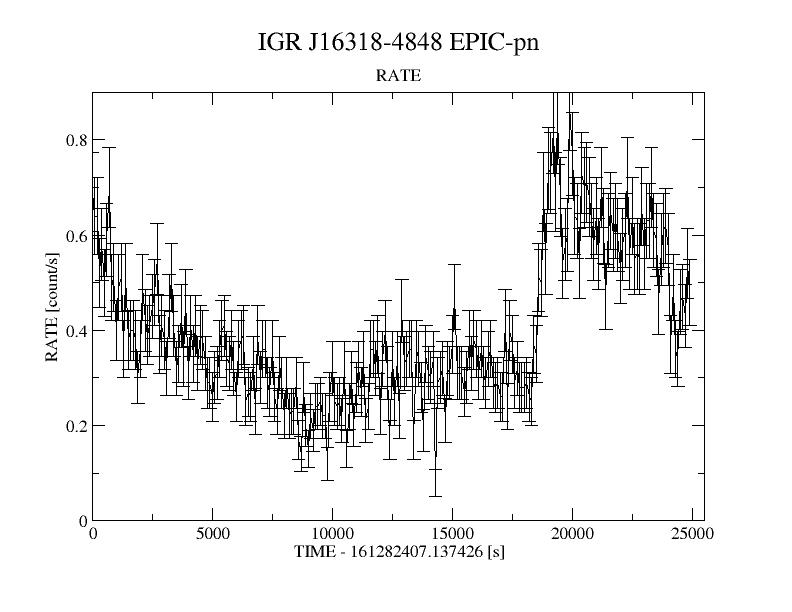
The total count rate from the brightest source varies by a factor ~3 in ~25ks.
EPIC-pn spectrum of the brightest source. Only pixels within ~50 arcseconds radius around the source peak have been considered. Click on the image to see it at high resolution
The pn spectrum of the brightest source shows several lines and strong absorption below ~5 keV.
Sanitized for DXP 7.3
- Removed a total of (4) style text-align:center;
- Converted a total of (4) center to div.