
 Sign in
SAS Thread - epic oot - XMM-Newton
Dealing with EPIC Out-of-Time (OoT) events
|
Introduction In EPIC imaging modes, photons are not only registered during the actual integration interval, but also during the readout of a CCD. These so called Out-of-Time (OoT) events are assigned incorrect RAWY values, leading to a wrong energy correction. OoT events broaden the spectral features, and create a strip of events with wrongly reconstructed position. The fraction of OoT events scales with the (mode-dependent) ratio of integration and readout time, and is highest for pn Full Frame (6.3%) and Extended Full Frame (2.3%) modes (the user is referred to the XMM-Newton Users Handbook (EPIC chapter, section EPIC out-of-time events) for more details). Examples of the effects of OoT events in pn images and spectra are shown in the User Guide to the XMM-Newton Science Analysis System (EPIC chapter, Section EPIC pn Out-of-time events). It is important to stress that for most targets a correction of OoT events in the spectrum is not necessary. In any case, a correction is only necessary if OoT events overlap the source being investigated. Expected Outcome This thread will allow the user to create an image or spectrum cleaned from out-of-time events. SAS Tasks to be Used Prerequisites
Useful Links
Last Reviewed: 31 January 2025, for SAS v22.0Last Updated: 30 October 2014 |
Procedure
The OoT events correction is a "two-step" process:
- generation of an OoT event list (together with a standard observation event list)
- removal of OoT events from an image or spectrum
These two steps are described below. In the following example, it will be assumed that a user intends to remove OoT events from a pn exposure, taken in Full Frame Mode.
Generation of an OoT event list
- Run epchain to generate an OoT event list (PiiiiiijjkkPNblllOOEVLInmmm.FIT)
epchain runbackground=N keepintermediate=raw withoutoftime=Y
- Run epchain to generate an observation event list (PiiiiiijjkkPNblllPIEVLInmmm.FIT)
epchain runatthkgen=N runepframes=N runbadpixfind=N runbadpix=N
In order to save some time, one does not have to re-create the attitude history file, or re-run epframes, badpixfind and badpix. epchain will create an output event file with the name PiiiiiijjkkPNblllPIEVLInmmm.FIT (the standard epchain name for a calibrated EPIC-pn Imaging event list).
Removal of OoT events from an image
- Generate an image from the OoT event list,
evselect table=PiiiiiijjkkPNblllOOEVLInmmm.FIT imagebinning=binSize \
imageset=PN_OoT_image.fits withimageset=yes xcolumn=X ycolumn=Y \
ximagebinsize=80 yimagebinsize=80
- Generate an image from the observation event list,
evselect table=PiiiiiijjkkPNblllPIEVLInmmm.FIT imagebinning=binSize \
imageset=PN_observation_image.fits withimageset=yes xcolumn=X ycolumn=Y \
ximagebinsize=80 yimagebinsize=80
- Rescale the OoT image to the expected fraction of OoT events (6.3% for pn in Full Frame Mode; the user is referred to the EPIC chapter, section EPIC out-of-time events of the XMM-Newton Users Handbook for more details). The FTOOLS farith can be used for this purpose,
farith PN_OoT_image.fits 0.063 PN_OoT_image_rescaled.fits MUL
where, MUL indicates multiply.
- Subtract the rescaled OoT image from the observation image,
farith PN_observation_image.fits PN_OoT_image_rescaled.fits \
PN_observation_clean_image.fits SUB
where, SUB indicates subtract.
The image PN_observation_clean_image.fits is cleared from OoT events. Figure 1 illustrates the effect of OoT events on images and the results of cleaning an image with the method just described.
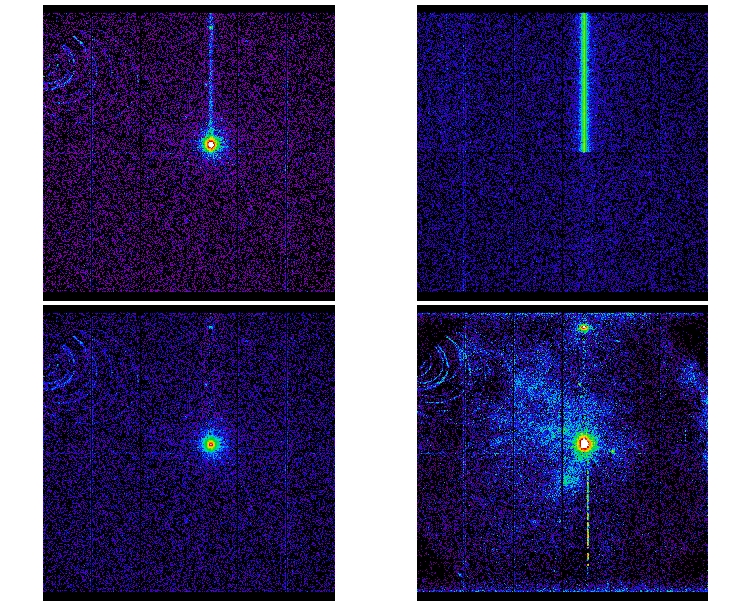
Figure 1; Effect of OoT events on images: The upper left panel contains a 2-10 keV band image of a pn observation of a bright source in full frame mode with the OoT-events visible as a strip running from the source towards the top of the image (in detector coordinates). The upper right panel depicts the modelled (see SAS task epframes) OoT event distribution. In the lower left panel these modelled events have been subtracted from the original image. The lower right panel is cleaned for the soft 0.2-2 keV band for comparison.
Removing OoT events from a spectrum
- Extract a source spectrum (PN_source_spectrum.fits) from the observation image,
evselect table=PiiiiiijjkkPNblllPIEVLInmmm.FIT withspectrumset=yes \
spectrumset=PN_source_spectrum.fits energycolumn=PI spectralbinsize=5 \
withspecranges=yes specchannelmin=0 specchannelmax=20479 \
expression='(FLAG==0) && (PATTERN<=4) && ((X,Y) IN circle(Xc,Yc,R))'
where ((X,Y) IN circle(Xc,Yc,R)) should contain the centroid position and radius in sky coordinates (X/Y).
- Extract a spectrum from the OoT events,
evselect table=PiiiiiijjkkPNblllOOEVLInmmm.FIT withspectrumset=yes \
spectrumset=PN_oot_spectrum.fits energycolumn=PI spectralbinsize=5 \
withspecranges=yes specchannelmin=0 specchannelmax=20479 \
expression='(FLAG==0) && (PATTERN<=4) && ((X,Y) IN circle(Xc,Yc,R))'
where ((X,Y) IN circle(Xc,Yc,R)) should contain the centroid position and radius in sky coordinates (X/Y).
- Change the name of the COUNTS column in the OoT event spectrum to CTS_OOT,
fparkey value=CTS_OOT fitsfile=PN_oot_spectrum.fits+1 keyword=TTYPE2
- Copy the CTS_OOT column of the OoT event spectrum into the source spectrum,
faddcol infile=PN_source_spectrum.fits+1 colfile=PN_oot_spectrum.fits+1 \
colname=CTS_OOT
- Multiply the values in the column CTS_OOT by 0.063 (6.3% for pn in Full Frame Mode; the user is referred to the EPIC chapter, section EPIC out-of-time events of the XMM-Newton Users Handbook for more details). As the PN_source_spectrum.fits file will be modified in the next two steps, the user may wish to create a backup first,
fcalc clobber=yes infile=PN_source_spectrum.fits+1 outfile=PN_source_spectrum.fits \
clname=CTS_OOT expr=CTS_OOT*0.063
- Subtract the rescaled values of the CTS_OOT from the COUNTS column of the source spectrum,
fcalc clobber=yes infile=PN_source_spectrum.fits+1 outfile=PN_source_spectrum.fits \
clname=COUNTS expr=COUNTS-CTS_OOT
Figure 2 illustrates the effect of OoT events on spectra.
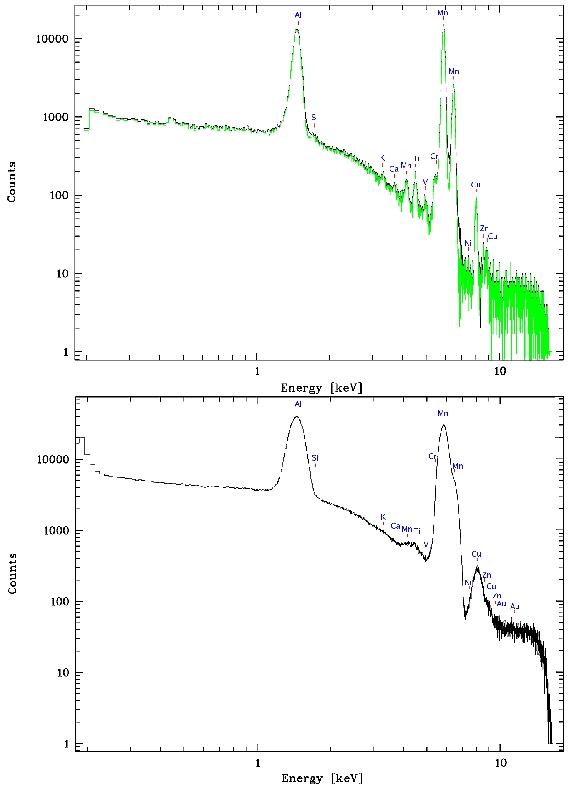
Figure 2; Effect of spectral broadening due to OoT events: the upper panel shows a spectrum extracted from a pn CalClosed full frame mode observation (black) together with the spectrum corrected for OoT events (green). In the lower panel the spectrum of the simulated OoT events over the whole FoV is plotted.
- Removed a total of (1) style text-align:center;
- Removed a total of (5) style text-align:justify;
- Removed a total of (2) border attribute.
- Converted a total of (4) center to div.