
 Sign in
SAS Thread - pn spectrum - XMM-Newton
How to extract PN spectra of a point-like source and associated matrices
|
Introduction This thread describes how to extract the spectrum of a point-like source observed with the PN camera using the command line. Expected Outcome The final outcome of this thread is the standard suite of spectral products required by spectral analysis packages such as XSPEC:
SAS Tasks to be Used Prerequisites
Useful Links This thread makes use of the image display software ds9. Last Reviewed: 31 January 2025, for SAS v22.0Last Updated: 24 May 2022 |
Procedure
This thread contains a step-by-step recipe to extract PN spectra of a point-like source observed in Imaging mode and to create associated response matrices, starting from a calibrated, concatenated event list (either produced with epproc or available as PPS product; here it has the assumed file name PN.fits).
All the analysis steps are performed with single SAS tasks started from the command line to explain the general method of generating spectral products and to show explicitly the usage and setting of task parameters. The users should note that the SAS meta-task xmmselect allows them to interactively define source and background regions (via ds9) and to run backscale on the fly. Especially the xmmselect: Spectral Products generation method, which in addition offers an optimisation of the source extraction region and which creates source and background spectra as well as related ancillary and redistribution files in one go, might in some cases be a GUI based alternative to the command line method described below. For more details on how to use xmmselect for the generation of EPIC spectra, the reader is referred to the Users Guide to the XMM-Newton Science Analysis System.
- Set up your SAS environment (following the SAS startup Thread)
- If necessary, create a PN cleaned and filtered for particle background event file for your observation (see the How to filter EPIC event lists for flaring particle background Thread). Let's assume that a filtered file has been created, with name: PNclean.fits
- Extract an image (sky coordinates in this example; extraction in detector - DET[XY] - coordinates is possible as well, and may be preferable for some specific scientific needs)
NOTE: arfgen / rmfgen do not support spectra extracted from a region defined in RAW coordinates
evselect table=PNclean.fits imagebinning=binSize imageset=PNimage.fits withimageset=yes \
xcolumn=X ycolumn=Y ximagebinsize=80 yimagebinsize=80 - Display the image
imgdisplay withimagefile=true imagefile=PNimage.fits
This command is equivalent to the following:
ds9 PNimage.fits - Select the region, from which the spectrum shall be accumulated, using the Region/Circle in ds9 (see Fig.1)
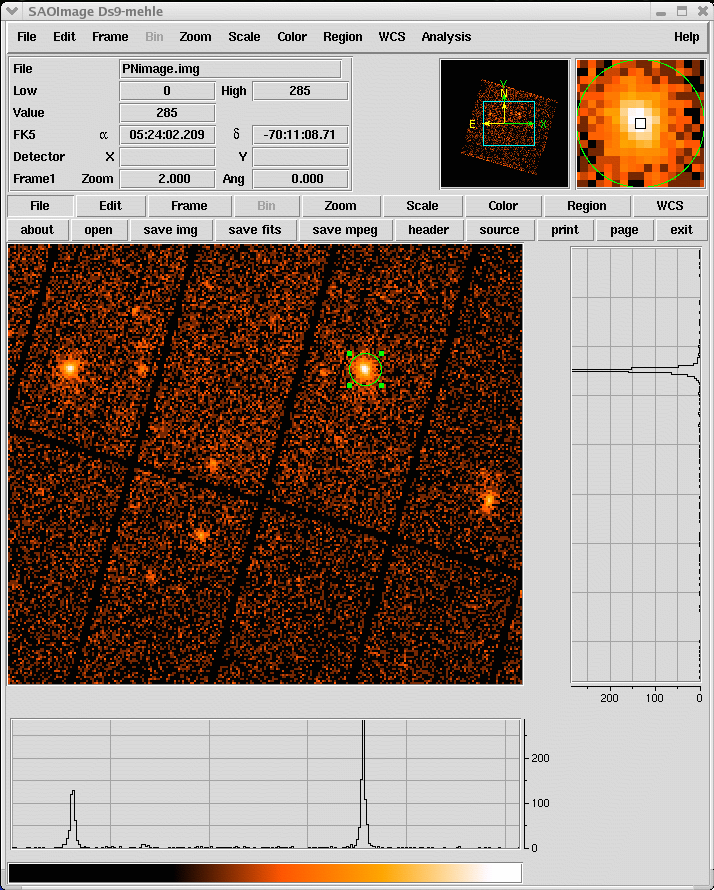 Fig.1: ds9 main window. A circular region (green circle) has been defined using the highlighted menu.
 - Double-click with the cursor on the defined region. A window pops up, showing the properties of the region (Fig.2) (you need to set 'Coord -> Physical' and 'Radius -> Physical' to switch to physical coordinates). Write down the coordinates of the Centre (30360.5,28400.5) and of the Radius (640) as they will be needed in step 8 to define the spatial filter expression.
(These values would also be propagated into a Selection Expression if pressing the "2D region" button in xmmselect...)
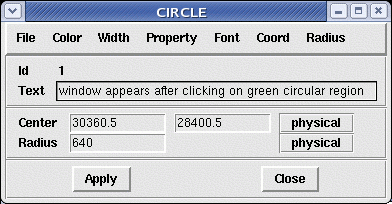 Fig.2: selection region properties window, pop'd-up by double-clicking on the region in the main ds9 window
 - If you want to see the center position in RA, Dec (J2000) coordinates, switch 'Coord -> WCS' (World Coordinate System) and select 'Equatorial J2000'. To display the radius of the selection region in arcsec, switch 'Radius -> WCS' and select 'ArcSec'. Units of sky coordinates (X,Y) are 0.05 arcsec, hence the radius in our example is 32 arcsec.
- Extract a source spectrum, using all the selection expressions defined so far & restricting the patterns to single and doubles.It is important to check withspecranges and use the following spectral bin range, specchannelmin=0 and specchannelmax=20479, to accumulate the spectrum (see Caveats).
evselect table=PNclean.fits withspectrumset=yes spectrumset=PNsource_spectrum.fits \
energycolumn=PI spectralbinsize=5 withspecranges=yes specchannelmin=0 specchannelmax=20479 \
expression='(FLAG==0) && (PATTERN<=4) && ((X,Y) IN circle(30360.5,28400.5,640))' - Extract a background spectrum. Have a look at the "EPIC status of calibration and data analysis" document (XMM-SOC-CAL-TN-0018) for latest recommendations on how to select source and background regions. In the following, we assume that the background is extracted from a source-free region at the same distance to the readout node (RAWY position) as the source region. If this is not possible, in order to ensure similar low-energy noise you should aim to select the background from the same CCD or same quadrant of the source region.
evselect table=PNclean.fits withspectrumset=yes spectrumset=PNbackground_spectrum.fits \
energycolumn=PI spectralbinsize=5 withspecranges=yes specchannelmin=0 specchannelmax=20479 \
expression='(FLAG==0) && (PATTERN<=4) && ((X,Y) IN circle(24440.5,29880.5,640))'
If you are interested in learning how to extract the background spectra from blank sky event lists, please go to the How to extract background spectra from blank fields event lists thread. - If you want to correct the source spectrum for Out-of-Time events, consult the Dealing with EPIC Out-of-Time (OoT) events Thread.
- Calculate the area of source and background region used to make the spectral files. The area is written into the header of the SPECTRUM table of the file as keyword BACKSCAL (if the spectrum is created via xmmselect, backscale will run automatically).
backscale spectrumset=PNsource_spectrum.fits badpixlocation=PNclean.fits
backscale spectrumset=PNbackground_spectrum.fits badpixlocation=PNclean.fits - Generate a redistribution matrix
Currently there are two possible approaches:
a) use the SAS task rmfgen to create a redistribution matrix for your previously extracted spectrum:
rmfgen spectrumset=PNsource_spectrum.fits rmfset=PN.rmf
NOTE: This can take long (>30 min) on low-performance computers...
b) use the ready-made (canned) response matrices. - Generate an ancillary file (for extended sources use extendedsource=yes detmaptype=flat or dataset)
NOTE: arfgen reads in the pattern range from the Data Sub Space (DSS) information in the spectrum dataset, and accumulates the quantum efficiency curves over those patterns, which is then combined to the other constituents of the ARF. Be aware that the entire range of allowed patterns are assumed if no pattern range is found in the DSS.
arfgen spectrumset=PNsource_spectrum.fits arfset=PN.arf withrmfset=yes rmfset=PN.rmf \
badpixlocation=PNclean.fits detmaptype=psf
As of SAS 20.0, a new correction is available through the arfgen call to align the PN and NuSTAR spectral shapes better (see Caveats).
- Rebin the spectrum and link associated files. In the following example the spectrum is rebinned in order to have at least 25 counts for each background-subtracted spectral channel and not to oversample the intrinsic energy resolution by a factor larger then 3.
specgroup spectrumset=PNsource_spectrum.fits mincounts=25 oversample=3 rmfset=PN.rmf \
arfset=PN.arf backgndset=PNbackground_spectrum.fits groupedset=PN_spectrum_grp.fits
The rebinning options shown in the example above, are by no means the only possible binning available, or the recommended one, more binning options are available in the description of the task specgroup. - Fit the grouped spectrum: PN_spectrum_grp.fits
|
Caveats |
- Removed a total of (1) style text-align:center;
- Removed a total of (10) style text-align:justify;
- Removed a total of (2) border attribute.
- Converted a total of (6) center to div.