
 Sign in
SAS Thread - omg - XMM-Newton
OM data reduction with SAS: grism data processing chain
|
Introduction The processing chain omgchain, used to obtain OM grism spectra from the ODF, is a concatenation of several SAS tasks run consecutively. While these steps are described in detail in the Step by Step thread this threads assumes the perl script to be run and describes recommends checks of the resulting output. Expected Outcome OM UV or optical grism spectra in fits format. Spectra will be given on a wavelength grid in count rates and absolute flux units. SAS Tasks to be Used Prerequisites The SAS has to be setup following the SAS Startup Thread. Useful Links Last Reviewed: 31 January 2025, for SAS v22.0Last Updated: 27 May 2019 |
Procedure
OM grism data are obtained as image mode data. The different nature of this type of data, dispersed spectra of each object in the field of view instead of their "sky" image, requires special processing of grism images. A series of tasks, some of them common with "normal" images, have been developed. They are concatenated in a perl script, omgchain, which works in a similar way to the image and fast mode chains.
A detailed description of each task can be found in the SAS documentation, both in HTML and Postscript format. A step by step description of the grism extraction chain and examples of the processing by individual execution of all tasks is given in the SAS User's Guide.
The omgchain applies all necessary corrections to the grism data files. The images are rotated to have the dispersion direction aligned with the image columns. Then a source detection algorithm is used to identify the spectra (zero and first dispersion orders) of the sources present in the grism image.
By default, omgchain will extract the spectrum of the target located at the boresight. All spectra present in the grism image (obtained in full frame or with a rectangular window) can be extracted using the parameter extractfieldspectra=yes when invoking omgchain. Then the spectra for which a correlation can be established between zero and first orders are extracted and fully calibrated. Astrometric corrections are applied to the zero order position of the extracted spectra to determine the sky co-ordinates of the corresponding object.
After running the chain, the checks described below should be performed on OM grism processed data. There is an additional task, omgsource, which allows interactive extraction and calibration of grism spectra.
- Recommended checks omgchain output products:
- The most important check to be done after running omgchain consists in verifying that the first order spectra have been properly found and correlated with the corresponding zero order. This can be done by displaying with ds9 the grism rotated image, e.g.
ds9 p0650300201OMS006RIMAGE0000.FIT -region p0650300201OMS006SPCREG0001.ASC \
-region p0650300201OMS006REGION0001.ASC -scale log -zoom to fit -invert
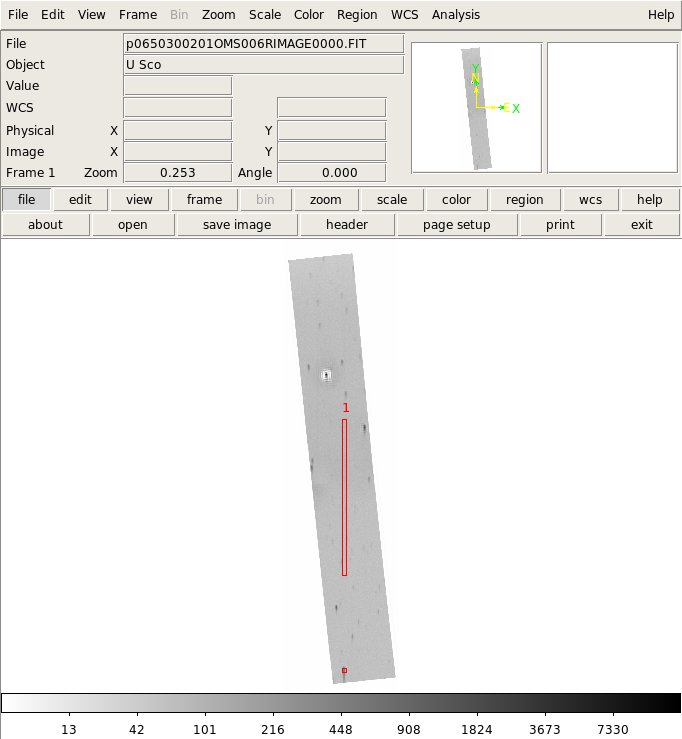
The figure shows the extractions finally done (red overlay, corresponding to *SPCREG* file) and also all detections performed (green overlay, corresponding to *REGION* file).
The positions for extracted zero and first orders given in the files *SPECLI* and *SWSRLI* and also in the headers of the extracted spectra contained in *SPECTR* can be verified in the displayed image.
Dubious or defaulted extractions, e.g. in case of very faint spectra, are indicated in the *SPECLI* file.
- In recent versions of SAS (from SAS 8.0), omgchain produces a postscript file showing the spectrum image with superimposed spectral extraction regions: *SPCREG*.PS
- Possible contamination by other spectra (zero and/or first orders) should be checked also on the displayed rotated grism image.
- The most important check to be done after running omgchain consists in verifying that the first order spectra have been properly found and correlated with the corresponding zero order. This can be done by displaying with ds9 the grism rotated image, e.g.
- Improving the extraction
- If the spectrum (or spectra) of interest has not been detected automatically because it is too faint, or if the standard extraction is contaminated by close features, then an interactive extraction tool is available with omgsource which uses the rotated image (see step3 of the Step by Step guide). The desired spectrum can be selected interactively, and appropriate source and background extraction regions can be defined.
- If the spectrum (or spectra) of interest has not been detected automatically because it is too faint, or if the standard extraction is contaminated by close features, then an interactive extraction tool is available with omgsource which uses the rotated image (see step3 of the Step by Step guide). The desired spectrum can be selected interactively, and appropriate source and background extraction regions can be defined.
- Time dependent sensitivity degradation.
- The time dependent sensitivity degradation of the OM detector affects data collected with the grisms. Spectra of the same source obtained at different epochs will show a decrease in the rates or fluxes. From SAS 18 onwards, the effect is automatically corrected for in the grism SAS task, omgchain, which is also run inside omgchain and omgsource.
| Year | UV_Grism | V_Grism |
| 2000 | 1.00 | 1.00 |
| 2002 | 1.011 | 1.009 |
| 2004 | 1.023 | 1.018 |
| 2006 | 1.035 | 1.027 |
| 2008 | 1.047 | 1.036 |
| 2010 | 1.060 | 1.046 |
| 2012 | 1.073 | 1.055 |
| 2014 | 1.086 | 1.065 |
| 2016 | 1.100 | 1.075 |
| 2018 | 1.114 | 1.085 |
| 2020 | 1.128 | 1.096 |
| 2022 | 1.142 | 1.106 |
| 2024 | 1.157 | 1.017 |
- Removed a total of (43) style text-align:center;
- Removed a total of (7) style text-align:justify;
- Removed a total of (1) align=center.
- Removed a total of (3) border attribute.
- Removed a total of (1) cellpadding attribute.
- Removed a total of (1) cellspacing attribute.
- Converted a total of (3) center to div.