Gaia Mission Science Performance - Gaia
![]()
Expected Science Performance for the nominal and the extended mission based on GAIA (E)DR3
| Astrometric Performance Photometric Performance Spectroscopic Performance PyGaia (Python toolkit) |
Since mid-2014, Gaia has been performing micro-arcsecond (μas) global astrometry for nearly ~2,000 million stars down to G ≈ 20.7 mag by linking objects with both small and large angular separations in a network in which each object is connected to a large number of other objects in every direction. Each star transits the astrometric instrument on average ~12 times per year, leading to ~630/1260 CCD detector transits over the nominal/extended (five/ten-year) mission lifetime. Gaia does not exclusively observe stars: all sufficiently point-like objects brighter than G ≈ 20.7 mag are observed, including solar-system objects such as asteroidsand Kuiper-belt objects, quasars, supernovae, multiple stars, etc. (while solar-system objects have been published starting with Gaia Data Release 2, results for non-single stars, quasars, and extended objects have been published starting with Gaia Data Release 3). The Gaia CCD detectors feature a pixel size of 10 μm (59 milli-arcsecond) in the scanning direction (also known as the along-scan direction) and the astrometric instrument has been designed to cope with object densities up to some 750,000 stars per square degree. In crowded fields, only the brightest stars are observed such that the completeness limit becomes brighter than 20.7th magnitude in such regions.
Photometric observations are being collected with the photometric instrument, at the same angular resolution as the astrometric observations and for all objects observed astrometrically, in order to:
- enable chromatic corrections of the astrometric observations;
- provide astrophysical information for all objects, including astrophysical classification (for instance object type such as star, quasar, etc.) and astrophysical characterisation (for instance interstellar reddenings and effective temperatures for stars, photometric redshifts for quasars, etc.). Astrophysical parameters for selected sources have been part of Gaia Data Release 2 and Gaia Data Release 3 contains object classifications and astrophysical parameters, together with the spectra they are based on, for a subset of spectroscopically and (spectro-)photometrically well-behaved objects;
- allow reconstruction of photometric time series for photometrically variable objects. Light curves (epoch photometry) and variable-star classifications of selected sources have been published as part of Gaia Data Release 2 while Gaia Data Release 3 contains the same information for a much extended sample. In addition, Gaia Data Release 3 contains the Gaia Andromeda Photometric Survey (GAPS), consisting of the photometric time series for all sources (variable or not) located in a 5.5°-radius field centred on the Andromeda galaxy.
Spectroscopic observations are being collected with the spectroscopic instrument for all objects down to GRVS ≈ 16 mag, in order to:
- provide radial velocities through Doppler-shift measurements using cross-correlation (reaching ~150 million stars in Gaia DR5). Median radial velocities for some 7 million bright stars have been published in Gaia Data Release 2 while Gaia Data Release 3 contains median radial velocities for an extended sample of some 33 million stars with available atmospheric-parameter estimates;
- provide (starting with Gaia Data Release 3) astrophysical information, such as interstellar reddening, atmospheric parameters, and rotational velocities, for stars brighter than GRVS ≈ 12 mag (reaching ~5 million stars in Gaia DR5); and
- provide (starting with Gaia Data Release 3) element abundances for stars brighter than GRVS ≈ 11 mag (reaching ~2 million stars in Gaia DR5).
The spectroscopic instrument can cope with object densities up to some 35,000 stars per square degree. In denser areas, only the brightest stars are observed such that the spectroscopic completeness limit becomes brighter than 16th magnitude in such regions.
Regarding multiple stars, the minimum separation to resolve a close, equal-brightness double star in the on-board star-mapper detector is 0.23 arcsec in the along-scan and 0.70 arcsec in the across-scan direction, independent of the brightness of the primary. During the course of the mission, a given object is being observed many times with 'random' scanning angles meaning that, typically, close double stars may be resolved on board in some transits and stay unresolved in others. In the on-ground processing, however, the full resolution of the astrometric instrument will ultimately allow to systematically resolve double stars down to separations of ~0.1 arcsec in Gaia DR5.
In the scientific performance assessments for Gaia presented below, all known instrumental effects have been included under the appropriate in-flight operating conditions (temperature, CCD operating mode, straylight, contamination of the telescopes, etc.). All error sources have been included as random variables with typical (median) deviations (as opposed to best-case or worst-case deviations).
Contrary to pre-launch and post-commissioning error budgets presented earlier on this website, the current predictions (published in 2020 for astrometry, based on Gaia EDR3, and in 2022 for photometry and spectroscopy, based on Gaia DR3) are based on extrapolations of real data and do no longer contain a 20% scientific contingency margin to cover calibration errors and real-sky complexities.
For each instrument, two sets of predictions are presented below:
- One for the nominal mission, which covers the five-year time interval from mid-2014 to mid-2019. The underlying scientific observations, which have already been collected by the spacecraft and transmitted to ground, are currently being prepared for processing by the Data Processing and Analysis Consortium (DPAC) and will be published as Gaia's fourth data release (Gaia DR4). In practice, it is planned that Gaia DR4 will be based on 5.5 years of science data (rather than 5 years, as assumed here) but this difference will be ignored here and the nominal-mission performance will, for simplicity, be referred to as Gaia DR4.
- One for the extended mission, which covers the 10-year time interval from mid-2014 to mid-2024. In this case, it has simply been assumed that spacecraft operations and science-data collection will continue until mid-2024, after which DPAC processing will ultimately result in Gaia's fifth data release (Gaia DR5). Needless to say, only time will tell whether the assumed availability of 10 years of science data for Gaia DR5 will be achieved.
The performance numbers presented below refer to the standard errors, i.e., they refer to the precision of the mission data. An assessment of (residual) systematic errors in the Gaia data, linking to its accuracy, is much more difficult to provide. As an example, for astrometry, a known contributor to systematic parallax errors are unmodelled spin-synchronous basic-angle variations. The metrology data derived from the basic-angle monitoring device should ultimately allow, after careful calibration, to limit systematic effects to 1 μas in Gaia DR5. Work to achieve this goal is ongoing inside DPAC.
The PyGaia Python toolkit implementing the error models described below is available here.
1. Astrometric performance (updated in 2020, based on Gaia EDR3)
The astrometric standard errors for the nominal and for the extended mission (for simplicity denoted "Gaia DR4" and "Gaia DR5", respectively) are extrapolated predictions based on real data, in particular Gaia EDR3 astrometry. As such, the predictions cover all instrumental effects, including the straylight levels as measured in flight, as well as residual calibration errors at ground-processing (DPAC) level. The Gaia EDR3 uncertainties underlying the Gaia DR4 and Gaia DR5 predictions have been inflated by a factor 1.1 to correct for the fact that the external errors of the published astrometry in Gaia EDR3 (like in Gaia DR2) are typically ~10% larger than the formal, published uncertainties. In other words, the earlier 20% science contingency margin to cover (residual) calibration errors and real-sky complexities has been reduced to a 10% inflation to cover remaining model errors in the data processing.
The predicted parallax standard errors σϖ, averaged over the sky for a uniform celestial distribution, are:
| Gaia DR4 | Gaia DR5 | |
| Very bright stars (G < 3 mag) | See text | See text |
| Bright stars (3 mag < G < 13 mag) | See text | See text |
| G = 13 mag | 10 μas | 7 μas |
| G = 14 mag | 14 μas | 10 μas |
| G = 15 mag | 22 μas | 16 μas |
| G = 16 mag | 35 μas | 25 μas |
| G = 17 mag | 59 μas | 42 μas |
| G = 18 mag | 107 μas | 75 μas |
| G = 19 mag | 211 μas | 149 μas |
| G = 20 mag | 462 μas | 325 μas |
| G = 20.7 mag | 835 μas | 588 μas |
A simple performance model which reproduces the parallax-standard-error estimates listed above, is:
σϖ [μas] = Tfactor · (40 + 800 · z + 30 · z2)1/2,
where
- Tfactor = 0.749 for Gaia DR4 and 0.527 for Gaia DR5 represents the temporal improvement factor in the parallax uncercainty allowed by adding more data that span a longer time interval;
- z = MAX[100.4 · (13 - 15), 100.4 · (G - 15)] is an auxiliary variable representing an inverse G-band photon flux;
- G - in the range 3-20.7 mag - denotes the broad-band, white-light, Gaia magnitude (see below).
The MAX function in the equation for z above allows to apply the simple performance model also in the bright-star magnitude range 3 ≤ G ≤ 13 mag and returns a constant bright-star parallax noise floor at σϖ = 10 μas and 7 μas for Gaia DR4 and Gaia DR5, respectively. However, despite this formal and seemingly precise prediction, these numbers should be treated with great care. For these stars, nominal yet shorter CCD integration times (through the use of TDI gates) are being used to limit saturation and the actual Gaia DR4 and Gaia DR5 performance depends sensitively on magnitude as well as on the adopted TDI-gate scheme and its associated residual calibration errors, which contribute significantly for bright stars yet which are notoriously difficult to predict forward in time. As a result, Gaia DR4 and Gaia DR5 performance predictions for bright stars are very uncertain.
All so-called very bright stars (G < 3 mag) are being observed with a special (SIF) mode, the data of which is not (yet) treated in the standard data-processing pipelines. Depending on how well this mode can ultimately be calibrated, parallax standard errors at the level of a few dozen μas could potentially be achieved for these objects. This remains the topic of ongoing work.
For sky-averaged position and proper-motion errors, σ0 [μas] and σμ [μas yr-1], the following scaling relations can be used:
| Gaia EDR3 | Gaia DR4 | Gaia DR5 | |
| σ0 | 0.75 · σϖ | 0.75 · σϖ | 0.75 · σϖ |
| σα* | 0.80 · σϖ | 0.80 · σϖ | 0.80 · σϖ |
| σδ | 0.70 · σϖ | 0.70 · σϖ | 0.70 · σϖ |
| σμ | 0.96 · σϖ | 0.54 · σϖ | 0.27 · σϖ |
| σμα* | 1.03 · σϖ | 0.58 · σϖ | 0.29 · σϖ |
| σμδ | 0.89 · σϖ | 0.50 · σϖ | 0.25 · σϖ |
where the asterisk denotes true arcs on the sky (σα* = σα · cos(δ), etc.).
2. Photometric performance (updated in 2022, based on Gaia (E)DR3)
Gaia's photometry comprises:
- broad-band white-light G-band fluxes obtained in the astrometric instrument, and
- low-resolution spectro-photometry obtained in the Blue and Red Photometers (BP and RP).
The wavelength coverage of the astrometric instrument, defining the white-light G band, is ~330-1050 nm. Photometric relationships between the Gaia broad-band G and other photometric systems can be found here.
The spectral dispersion of the photometric instrument is a function of wavelength and varies in BP from ~3 to ~27 nm pixel-1 covering the wavelength range ~330-680 nm. In RP, the wavelength range is ~640-1050 nm with a spectral dispersion of ~7 to ~15 nm pixel-1. Whereas the high-precision G-band data are particularly useful for stellar variability studies, the BP/RP spectra allow the derivation of astrophysical parameters, such as interstellar extinctions, surface gravities, etc., for the scientific exploitation of the astrometric data (see Creevey et al. 2022). Over the five-year nominal mission lifetime, and conservatively accounting for ~20% dead time and data losses, a star transits the photometric instrument on average ~70 times, leading to ~70 transits in BP and ~70 transits in RP (the dependence on ecliptic latitude is summarised in this table). The astrometric instrument collects the same number of transits but acquires ~9 times more CCD observations since one transit over the astrometric part of the focal plane typically involves 9 astrometric CCD detectors.
The photometric standard errors (uncertainties) of the integrated mean G-band, BP-band, and RP-band fluxes are standard outputs of the Gaia photometric data processing and are reported in each data release. A Python tool has been developed that reproduces the median Gaia (E)DR3 photometric uncertainties for the G, BP, and RP instruments, and their associated mean broad-band magnitudes (G, GBP, and GRP), using fitted B-splines to sources with a fixed number of observations. This tool also allows to scale the uncertainties to a user-defined number of observations, such that Gaia DR4 and DR5 predicted uncertainties become trivially small. The following photometric uncertainties in units of milli-magnitudes result, as function of the source brightness in the G band, for the Gaia (E)DR3, DR4, and DR5 data releases for three representative spectral types (B1V, G2V, and M6V):
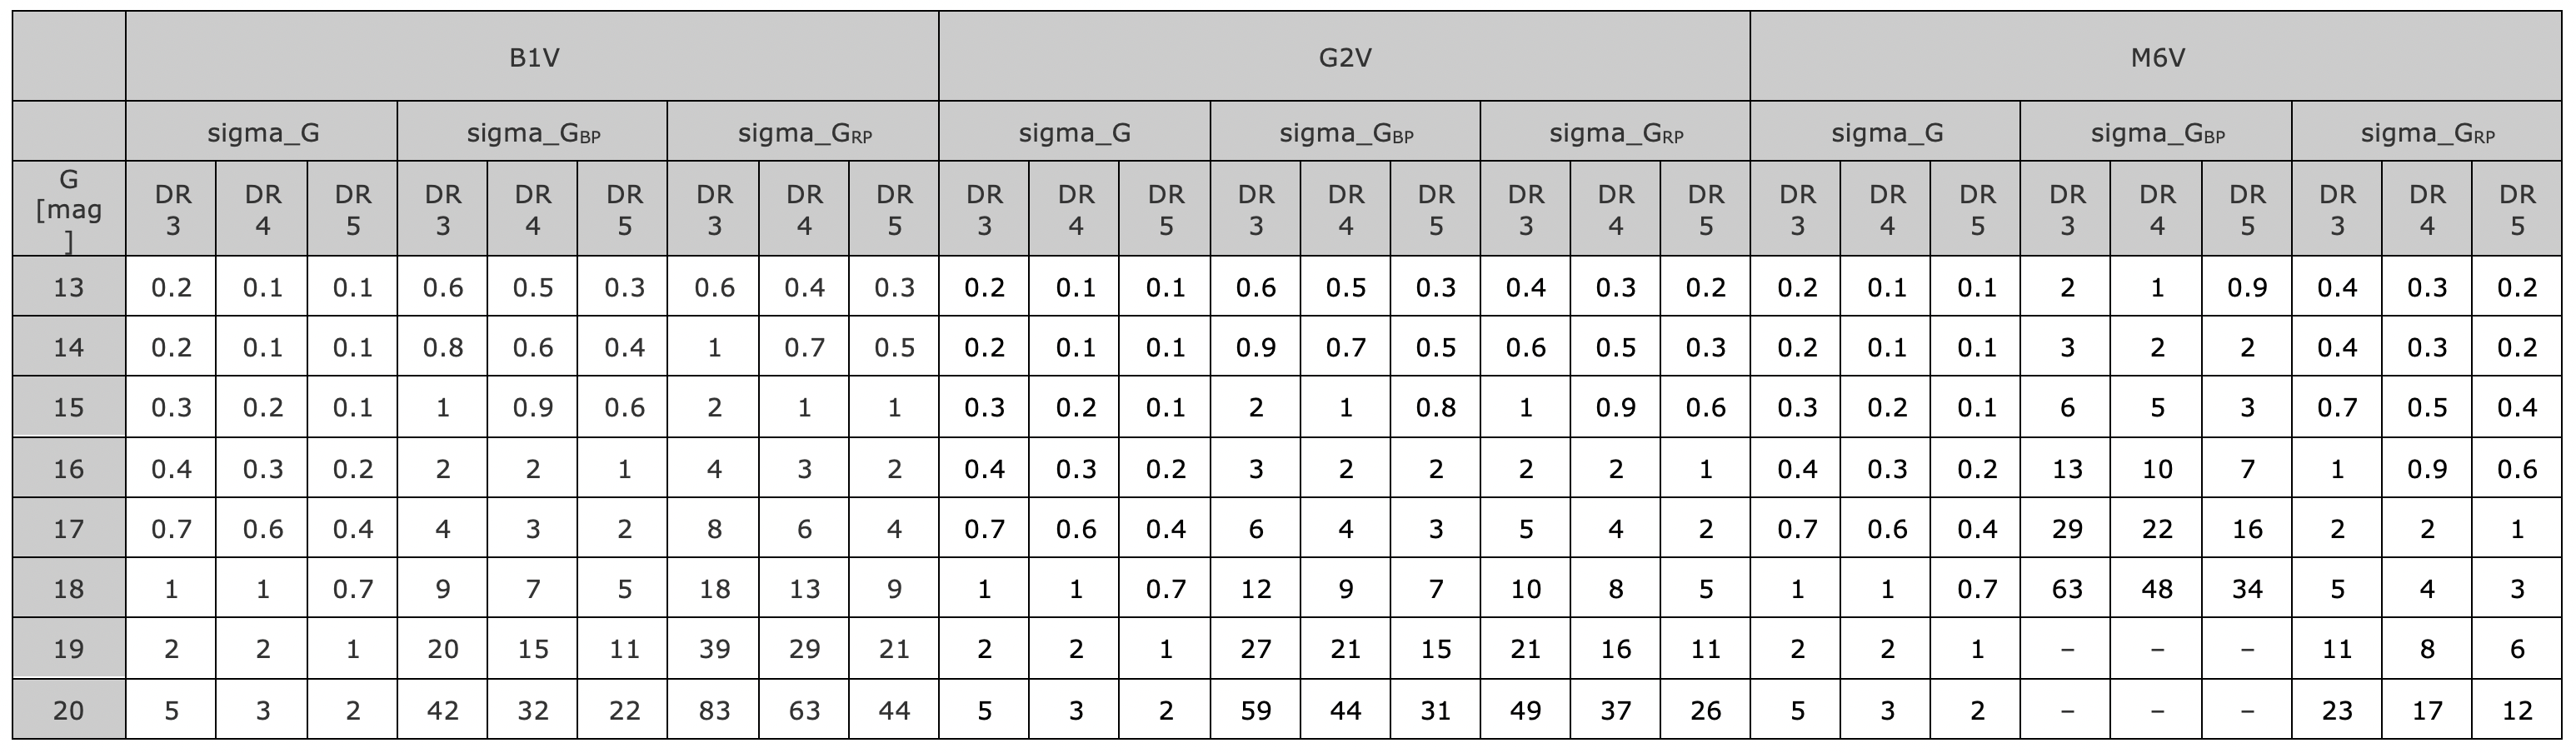
Several remarks apply to the above table and to the model on which it is based:
- As for astrometry, the bright-star uncertainties (G < 13 mag) depend sensitively on the TDI-gate scheme as well as on magnitude. The extrapolation provided by the model from Gaia (E)DR3 to DR4 and DR5 for bright stars is deemed to be reasonable albeit uncertain since the forthcoming releases enter uncharted territory. Whereas, to first order, the bright-end uncertainties can be expected to scale with the square root of the number of observations (as assumed by the model) since almost all the uncalibrated systematic errors are uncorrelated, systematic errors do exist that depend on the source, in particular on magnitude and on colour, that do not vanish with large numbers of observations. For getting a better understanding of the remaining systematics within the Gaia (E)DR3 photometry, please see Riello et al. (2021) and Fabricius et al. (2021).
- The above table assumes the following number of field-of-view transits and CCD observations, which refer to the nominal, sky-average number of transits and CCD observations for the assumed observation duration underlying each data release:
- G: 40 transits = 351 CCD observations for Gaia (E)DR3 (34 months), 70 transits = 620 CCD observations for DR4 (60 months), and 140 transits = 1240 CCD observations for DR5 (120 months);
- BP: 40 transits = CCD observations for Gaia (E)DR3, 70 transits = CCD observations for DR4, and 140 transits = CCD observations for DR5;
- RP: 40 transits = CCD observations for Gaia (E)DR3, 70 transits = CCD observations for DR4, and 140 transits = CCD observations for DR5.
- The faint-end GBP uncertainties for the red M6V star are absent since they fall beyond the validity of the model.
- Due to the time-variable straylight levels that Gaia experiences over a spin period and hence over the mission, the photometric uncertainties of a given source are not homoscedastic but heteroscedastic at transit level. Care is hence needed when using the above numbers and model in investigations and simulations involving variable sources.
- To compute broad-band Gaia magnitudes for the three spectral types, we have used the canonical photometric Gaia (E)DR3 Johnson–Cousins relations (Table 5.7) with V-IC = -0.22 mag for the B1V star, V-IC = 0.75 mag for the G2V star, and V-IC = 3.85 mag for the M6V star.
3. Spectroscopic performance (updated in 2022, based on Gaia DR3)
Gaia's spectroscopic instrument, the Radial-Velocity Spectrometer (RVS), is an integral-field spectrograph with resolving power ~11,500 covering the wavelength range 845-872 nm (see Cropper et al. 2018). The integrated magnitude associated with the passband is denoted GRVS (see Sartoretti et al. 2022). Over the five-year nominal mission lifetime, a star transits the spectroscopic instrument on average ~40 times, leading to ~120 CCD detector transits.
As described in Section 3.6 of Katz et al. (2022), radial velocities in Gaia DR3 have been derived differently for bright and faint stars, the border being at GRVS = 12 mag (bright stars have rv_method_used = 1 while faint stars have rv_method_used = 2). The reason is that, for faint objects, the signal-to-noise ratio of the transit spectra is insufficient for reliable cross correlation. Therefore, the transit cross-correlation functions are first combined into a composite cross-correlation function which is then used to estimate a single, time-averaged radial velocity. The radial velocities reported in Gaia DR3 refer to this approach for faint objects and refer to the median of all transit radial velocities for bright objects.
Gaia Data Release 3 (Gaia DR3)
The Gaia DR3 radial-velocity uncertainties are shown in Figure 9 in Section 8 of Katz et al. (2022). That figure shows the median formal precision (field radial_velocity_error in the gaiadr3.gaia_source and gaiadr3.gaia_source_lite tables in the Gaia ESA Archive) as a function of instrumental magnitude GRVS (field grvs_mag in the Archive) for 11 different subsamples of solar-metallicity stars (i.e., rv_template_fe_h ∈ [-0.5, 0.5] dex) along both the main sequence and the giant branch (with g1 at the top of the giant branch to g4 at the bottom and with d1 at the cool end of the main sequence to d7 at the hot end). Within a given subsample (constrained by rv_template_teff and rv_template_logg as shown in Figure F.1 of Katz et al. 2022), the dependence of the median formal precision with GRVS is well described by the simple model:
σvrad [km s-1] = radial_velocity_error = σfloor + b · EXP(a · [grvs_mag – GRVS,0]),
where a, b, σfloor, and GRVS,0 are constants that vary between the four giant and seven dwarf subsamples g1–g4 and d1–d7:
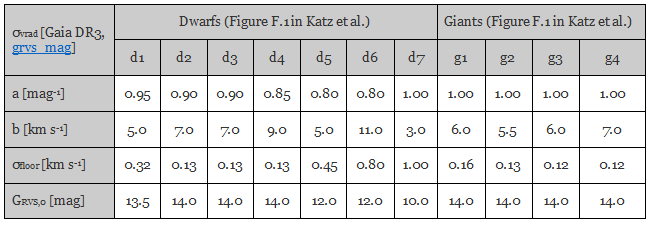
Several remarks apply to the above table and to the model which it describes:
- The model is valid for GRVS = grvs_mag ≤ 14 mag or σvrad = radial_velocity_error ≤ 20 km s-1, whichever limitation is more restrictive.
- The data that have been used to fit the model are the same as those presented in Figure 9 in Katz et al. (2022) except that the points of subsamples d5 and d6 fainter than grvs_mag = 12 mag are not included (these are hot dwarfs with rv_template_teff ≥ 7000 K). Each data point represents at least 50 objects.
- The model fits are generally conservative at all magnitudes. In the case of hot dwarfs in subsamples d5, d6, and d7 (rv_template_teff ≥ 7000 K), a trade-off was needed between fitting the data either at large(r) values of the radial_velocity_error (i.e., faint stars) or at small(er) values (i.e., bright stars). In these cases, priority has been given to adequately fit the data with radial_velocity_errors above ~1–2 km s-1, at the expense of overestimating the uncertainties for bright stars.
- As discussed in Section 2.1.3 in Gaia Collaboration, Babusiaux, et al. (2022) and as discussed in Section 7 and shown in Figure 8 in Katz et al. (2022), the formal radial velocity uncertainties that are published in Gaia DR3 are possibly underestimated by up to ~50% for grvs_mag ≲ 11–12 mag and possibly overestimated by up to ~25% for fainter stars. Depending on the science case, such an error correction could be, but has not been, included in the model presented here.
- The quantity σfloor denotes the bright-star, high-signal-to-noise performance floor for each subsample. In several subsamples, it reaches formal levels as small as ~125 m s-1. This performance floor reflects the intrinsic precision of the radial velocities and not the external accuracy. As discussed in Section 6 in Katz et al. (2022), systematics in the radial velocities themselves for instance linked to gravitational redshift or the zero-point and changes thereof as function of, for instance, magnitude, can be significantly larger than the intrinsic performance floor.
- Within each subsample, and for a given GRVS magnitude, the model reproduces the median formal uncertainties of the Gaia DR3 radial velocities. This median represents stars of similar spectral type, luminosity class, metallicity, and instrumental magnitude but with widely varying numbers of transits (field rv_nb_transits in the Archive, with 1 transit = 3 CCD observations) due to the objects being located all over the sky. As explained above in the 2. Photometric performance section, the median transit numbers in the Gaia DR3 catalogue are ~20%–30% smaller than the sky-average predictions since the typical Gaia DR3 source is in the galactic plane, which receives on average less transits than the sky average. Concretely, the median value of rv_nb_transits in the 34-month Gaia DR3 dataset equals 18 (54 CCD observations) such that the nominal five-year mission would see 32 transits (96 CCD observations), compared to the sky-average number of transits of 40 (120 CCD observations) mentioned above. Sky dependencies are further discussed in Section 8 and Figure 10 in Katz et al. (2022).
Gaia DR4 and Gaia DR5
The Gaia DR3 performance model described above can also be used to make predictions for Gaia DR4 (60 months of data) and Gaia DR5 (120 months of data). The following steps apply:
- Choose the number of field-of-view transits of interest, for instance rv_nb_transits = 32 for Gaia DR4 or rv_nb_transits = 64 for Gaia DR5.
- Choose the grvs_mag for the star of interest.
- Compute the total collected signal S for the object of interest using: S = 10(GRVS_ZEROPOINT – grvs_mag) / 2.5 · EXPOSURE_TIME · N_SPECTRUM_PER_TRANSIT · rv_nb_transits · (PIXEL_WIDTH_AL / BAND_WIDTH), where:
- GRVS_ZEROPOINT = 21.317 mag (see Section 7 in Sartoretti et al. 2022);
- EXPOSURE_TIME = 4.4167032 s;
- N_SPECTRUM_PER_TRANSIT = 3;
- PIXEL_WIDTH_AL = 0.02453 nm;
- BAND_WIDTH = 870.0 - 846.0 = 24.0 nm.
- Compute the rv_expected_sig_to_noise using: rv_expected_sig_to_noise = S / SQRT(S + BCK + RN), where:
- BCK = MEDIAN_BACKGROUND · N_SPECTRUM_PER_TRANSIT · rv_nb_transits · N_AC_PIXELS;
- MEDIAN_BACKGROUND = 4.7 e-/pixel;
- N_AC_PIXELS = 10;
- RN = RON2 · N_SPECTRUM_PER_TRANSIT · rv_nb_transits · N_AC_SAMPLES;
- RON = 3.2 e-;
- N_AC_SAMPLES = N_AC_PIXELS = 10 for grvs_mag ≤ 7 mag and 1 otherwise.
- Use the recipe below to predict σvrad for the computed value of rv_expected_sig_to_noise.
The Gaia DR3 data have been used to map the signal-to-noise ratio (rv_expected_sig_to_noise, SNR) to the radial-velocity uncertainty (radial_velocity_error). The data is well described by two analytical equations, one for high and one for low signal-to-noise ratios, that are smoothly connected at a break point by a hyperbolic tangent:
σvrad [km s-1] = radial_velocity_error = h · σhighSNR + (1 - h) · σlowSNR,
where:
- σlowSNR = σbreak · (SNR/SNRbreak)f;
- σhighSNR = σfloor + (σbreak - σfloor) · EXP(g · [LOG10(SNR) – LOG10(SNRbreak)]);
- h = (1 + TANH(k · [LOG10(SNR) – LOG10(SNRbreak)]))/2;
- SNR = rv_expected_sig_to_noise,
where f, σfloor, σbreak, SNRbreak, g, and k are constants that vary between the four giant and seven dwarf subsamples g1–g4 and d1–d7:
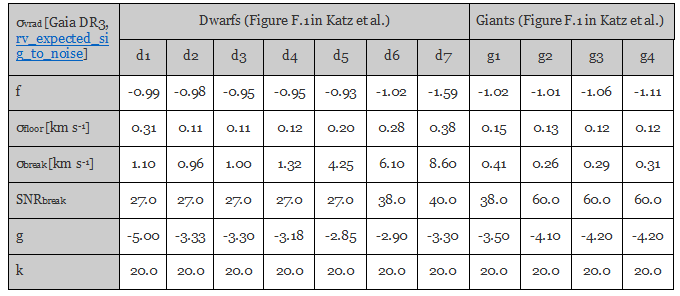
Several remarks apply to
- The model is valid for GRVS = grvs_mag ≤ 16 mag (12 mag for hot stars) although in dense areas, Gaia DR4 and DR5 may not reach this faint limiting magnitude and/or may show degraded performance at this limit.
- In theory, the above model can also be applied to predict the uncertainty of the epoch radial velocities (rv_nb_transits = 1) that are baselined to be published in Gaia DR4 for all objects with GRVS = grvs_mag ≤ 14 mag.
- The data that have been used to fit the model are the same as those presented in Figure 9 in Katz et al. (2022) except that the points of subsamples d5 and d6 fainter than grvs_mag = 12 mag are not included (these are hot dwarfs with rv_template_teff ≥ 7000 K). Each data point represents at least 50 objects.
- The model fits are generally conservative at all signal-to-noise ratios, in particular below rv_expected_sig_to_noise values of ~5–10. In the case of hot dwarfs in subsamples d5, d6, and d7 (rv_template_teff ≥ 7000 K), the model is very uncertain (yet conservative) below rv_expected_sig_to_noise values of ~15–20.
- As discussed in Section 2.1.3 in Gaia Collaboration, Babusiaux, et al. (2022) and as discussed in Section 7 and shown in Figure 8 in Katz et al. (2022), the formal radial-velocity uncertainties that are published in Gaia DR3 are possibly underestimated by up to ~50% for grvs_mag ≲ 11–12 mag and possibly overestimated by up to ~25% for fainter stars. Depending on the science case, such an error correction could be, but has not been, included in the model presented here.
- The quantity σfloor denotes the bright-star, high-signal-to-noise performance floor for each subsample. In several subsamples, it reaches formal levels as small as ~125 m s-1. This performance floor reflects the intrinsic precision of the radial velocities and not the external accuracy. As discussed in Section 6 in Katz et al. (2022), systematics in the radial velocities themselves for instance linked to gravitational redshift or the zero-point and changes thereof as function of, for instance, magnitude, can be significantly larger than the intrinsic performance floor.
- The quantity σfloor in this table is not 100% consistent with the same quantity in the [Gaia DR3, grvs_mag] table above. This is caused by the slightly different stellar samples that underly both tables.
![[Gaia DR3, grvs_mag] table](https://www.cosmos.esa.int/documents/29201/302420/PerformanceSpectroscopyDR3.png/a6617f6b-4ca1-ae6c-ebfc-6ef8c0fee58d?t=1663769757177)