Gaia DR1 info - Gaia

Gaia Data Release 1 (Gaia DR1)
This page presents the contents of Gaia DR1, DR1 statistical information, uncertainty statistics as well as a summary of the limitations of the first data release. A list of Gaia DR1 A&A papers is available below. The Gaia Archive can be reached at archives.esac.esa.int/gaia.
Contents of Gaia DR1
- Positions (α, δ) and G magnitudes for all sources with acceptable formal standard errors on positions. Positions and individual uncertainties are computed using a generic prior and Bayes' rule (detailed description in "Gaia astrometry for stars with too few observations. A Bayesian approach").
- The five-parameter astrometric solution - position, parallax, and proper motion - for stars in common between the Tycho-2 Catalogue and Gaia is contained in Gaia DR1. This part of Gaia DR1 is based on the Tycho-Gaia Astrometric Solution (Image of the Week with short TGAS description; paper with a more detailed description; paper describing theory and background; paper describing quasar extension).
- At the beginning of the routine phase, for a period of 4 weeks, a special scanning mode repeatedly covering the ecliptic poles on every spin was executed for calibration purposes. Photometric data of selected RR Lyrae and Cepheid variable stars including these high-cadence measurements are contained in Gaia DR1.
- Positions (α, δ) and G magnitudes for 2152 ICRF quasars (F. Mignard et al., 2016).
- Cross-matches will be provided between Gaia sources on the one hand and Hipparcos-2, Tycho-2, 2MASS PSC, GSC2.3, PPM-XL, UCAC-4, SDSS DR10 / DR12, AllWISE, and URAT-1 data on the other hand.
Gaia DR1 is based on observations collected between 25 July 2014 and 16 September 2015.
|
|
||||||||||||||||||||||||||||||||
* TGAS = Tycho-Gaia Astrometric Solution, also referred to as primary solution for primary sources.
** The astrometric solution of secondary sources (non-TGAS sources) is derived using the calibrations of the spacecraft attitude and the geometry of the instrument as `fixed' input, as derived from the astrometric solution of primary sources (i.e., the TGAS solution).
Gaia Source Identifiers
Sources in the Gaia DR1 and subsequent releases are all identified through the Gaia Source Identifier, i.e. the source_id field in the various tables in the Gaia Archive. The construction of the source identifiers is explained in the archive documentation, in the data model section. In particular the source_id number contains rough information about the source position on the sky.
As explained in the announcement about the Gaia DR2 schedule there are various reasons why the identifier of a specific source may change or disappear when going from the Gaia DR1 to the Gaia DR2 source list. Users of Gaia data should thus be aware that the source list for Gaia DR2 should be treated as independent from Gaia DR1. It is expected that the majority of sources in Gaia DR1 can be identified with the same source in Gaia DR2 through the Gaia source identifier. To cope with the cases where this is not possible, a means to trace sources across the Gaia DR2 and Gaia DR1 source lists will be provided. In future releases the source list is expected to become progressively more stable.
DR1 statistics
|
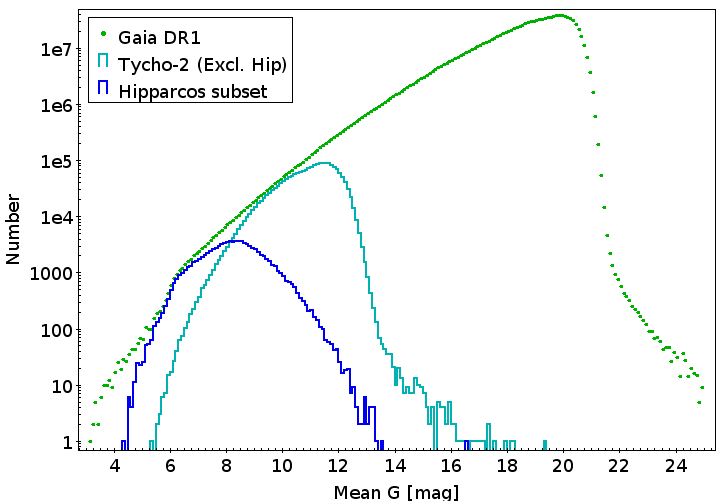
Gaia DR1 magnitude histogram |
 |
|
Gaia DR1 sky density plot for the TGAS sources in equatorial (ICRS) coordinates |
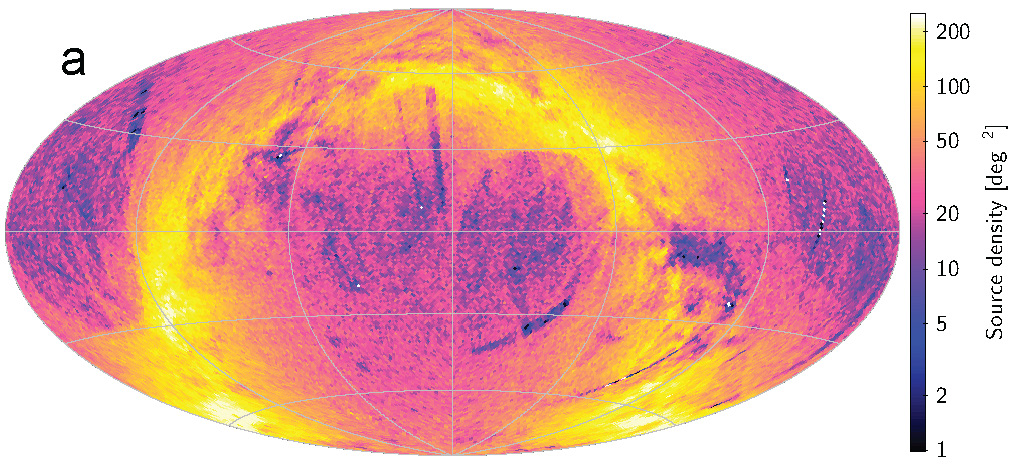 |
(L. Lindegren et al., 2016)
Uncertainty statistics
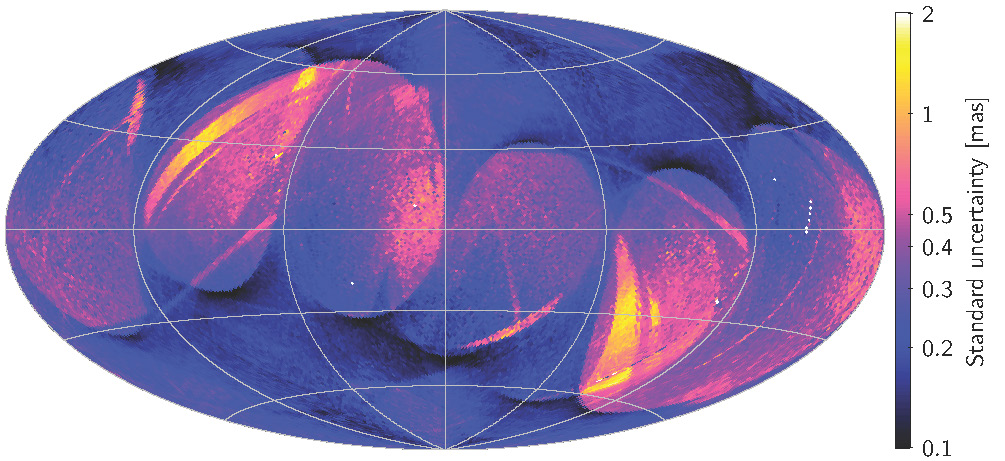
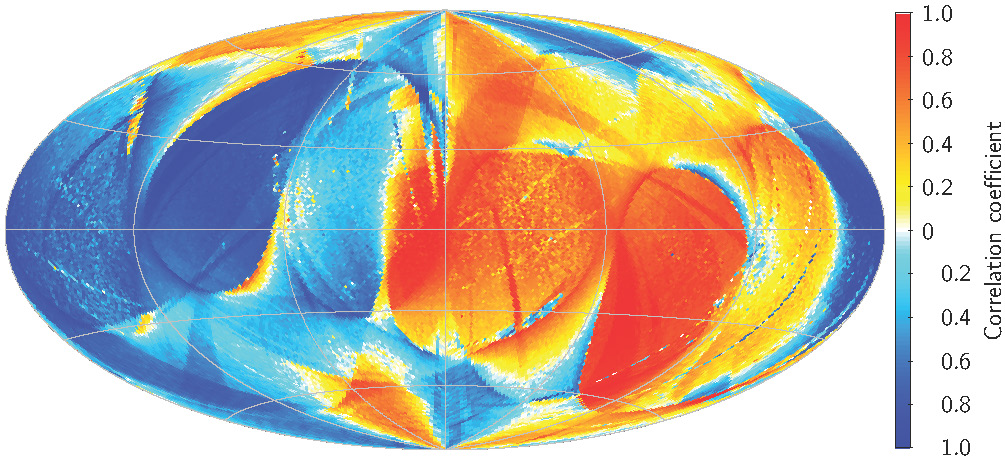
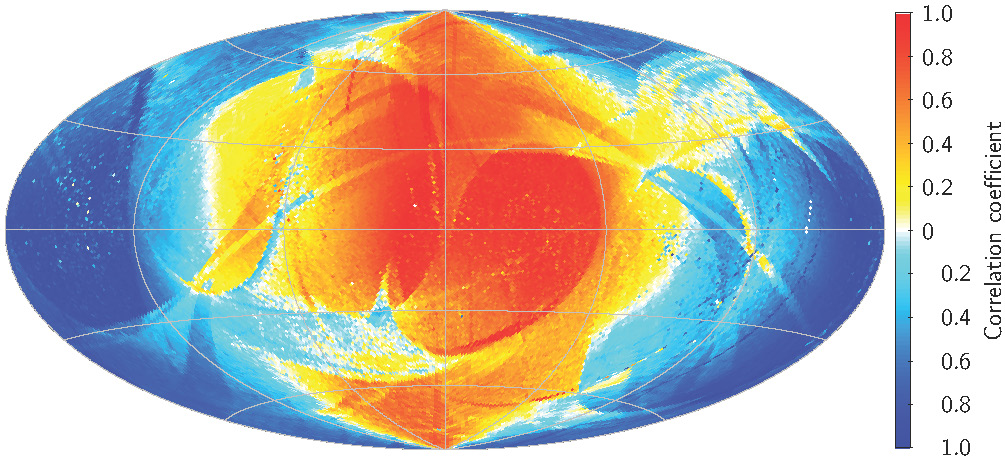
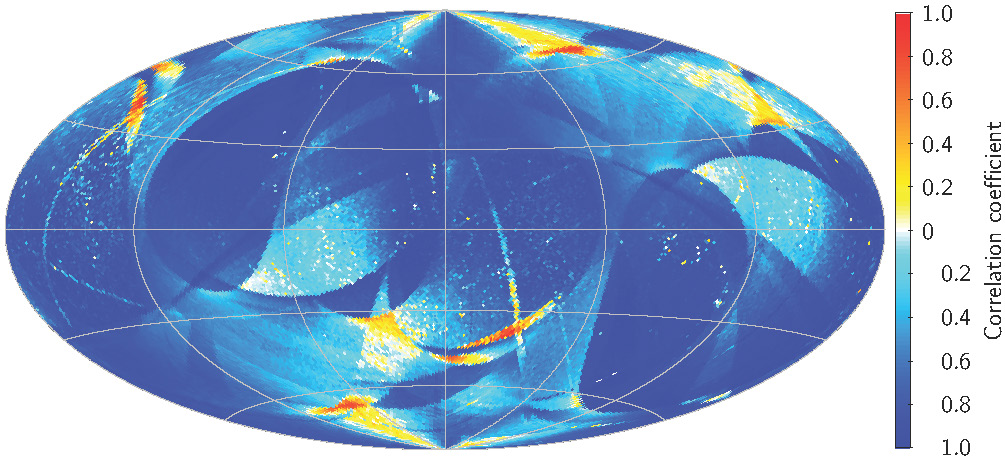
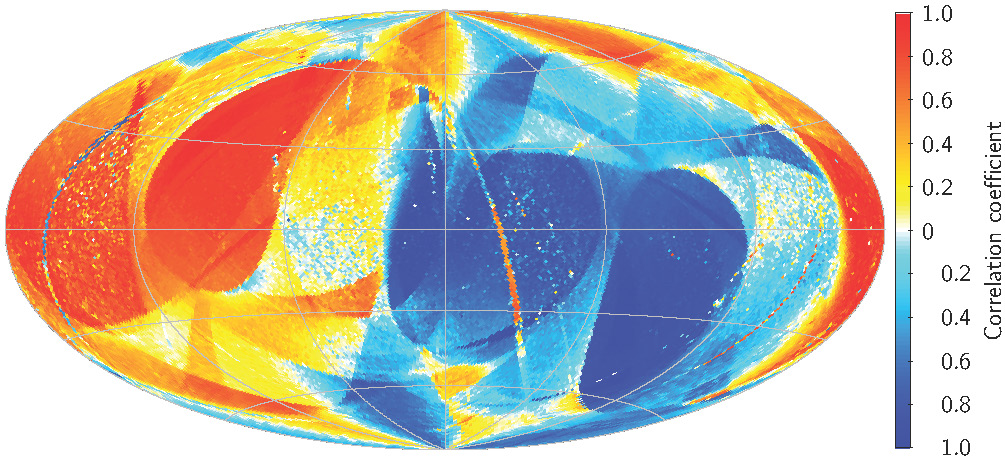
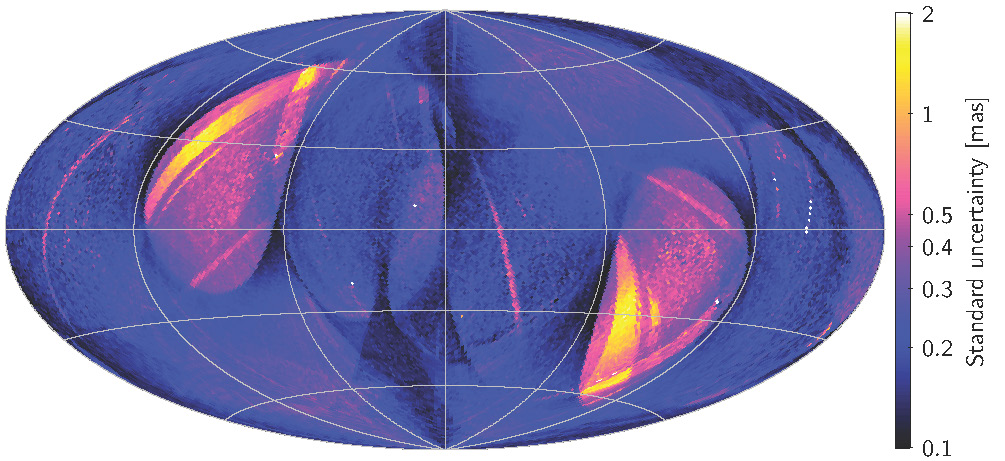
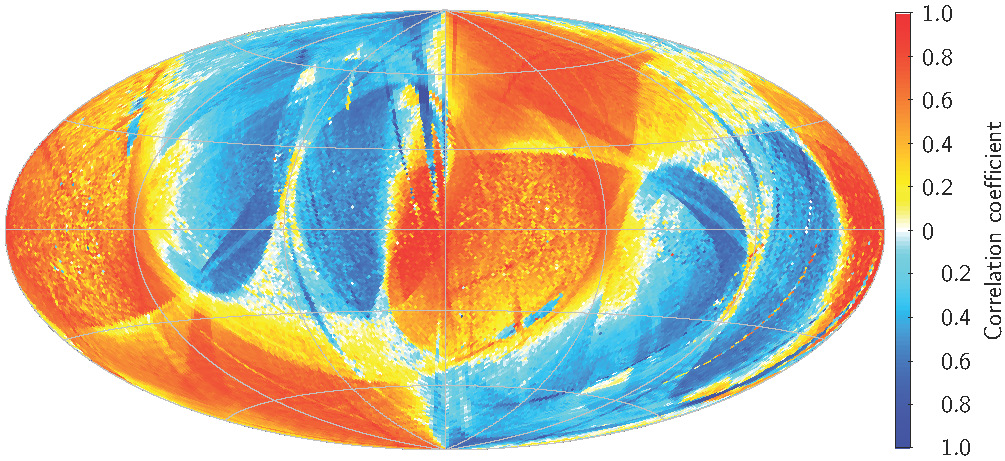
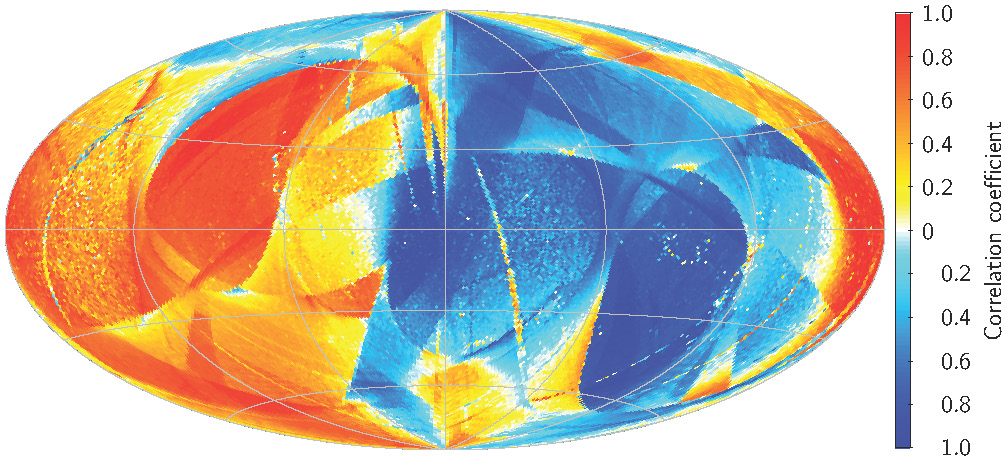
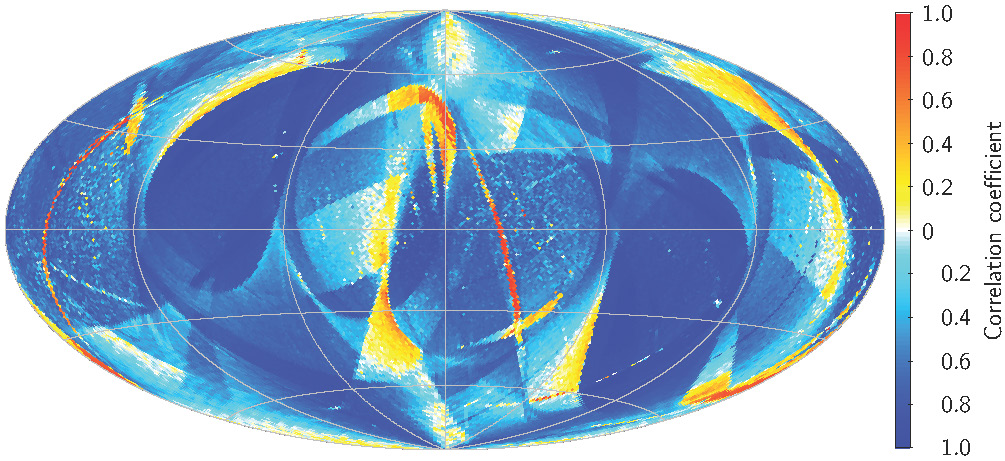
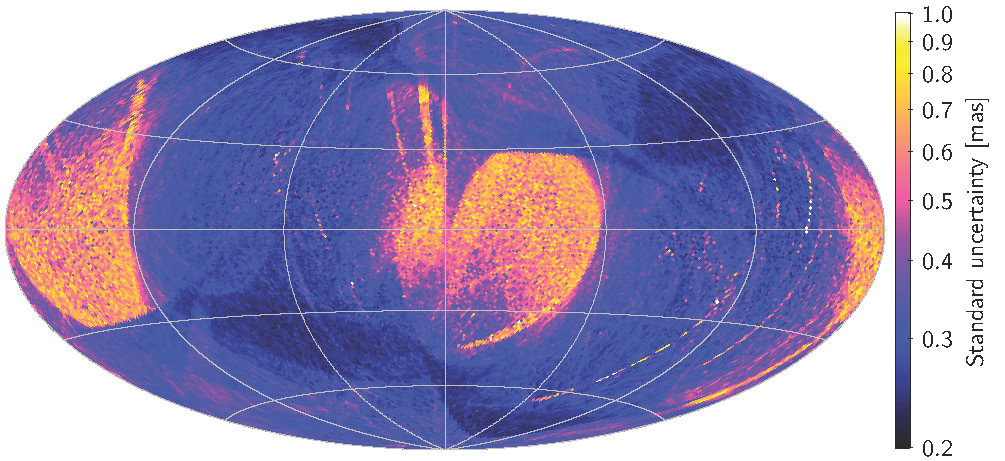
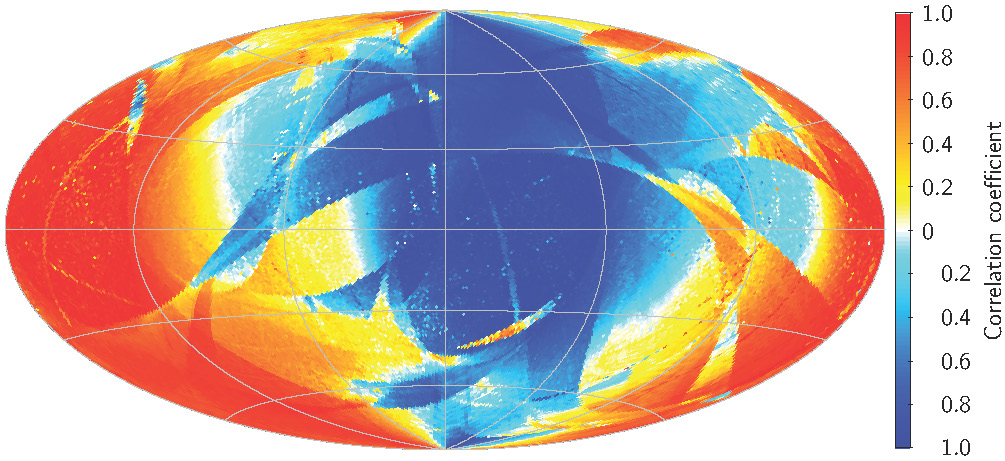
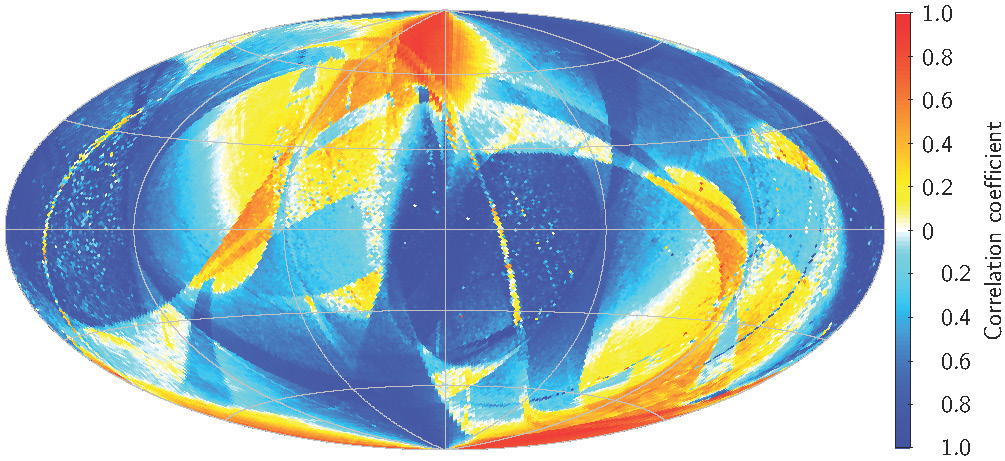
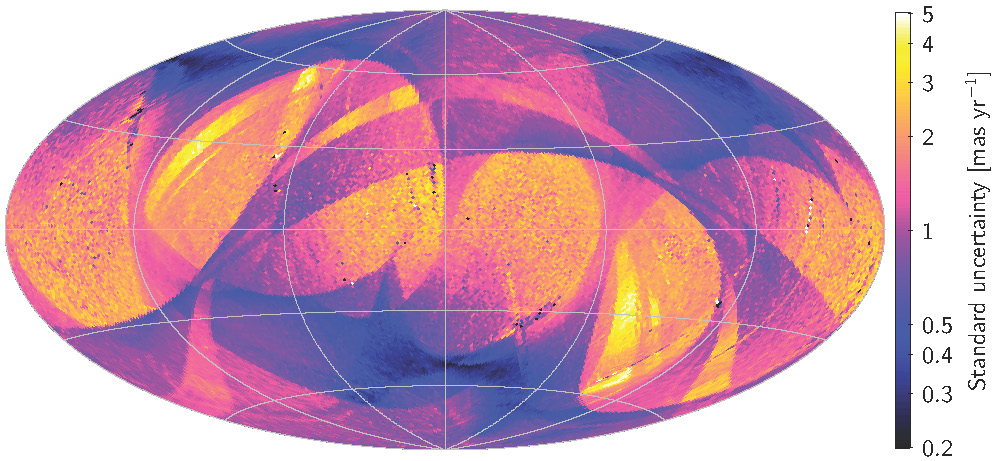
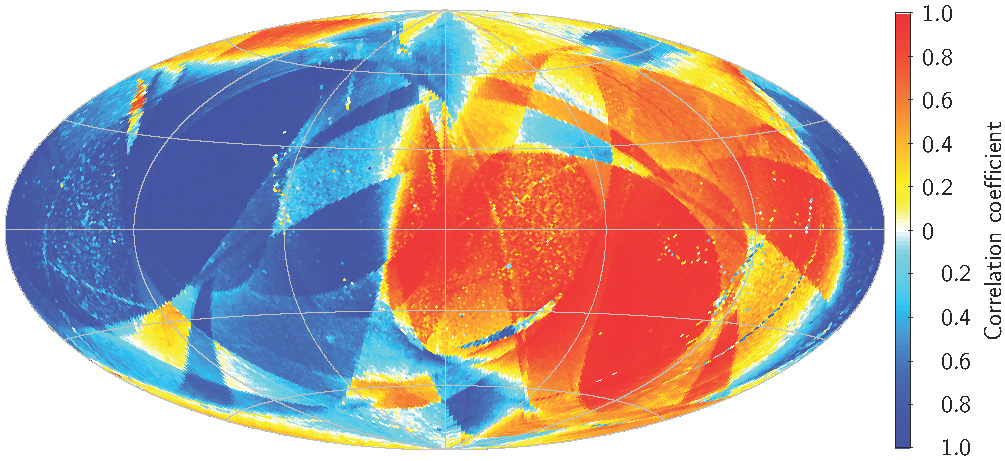
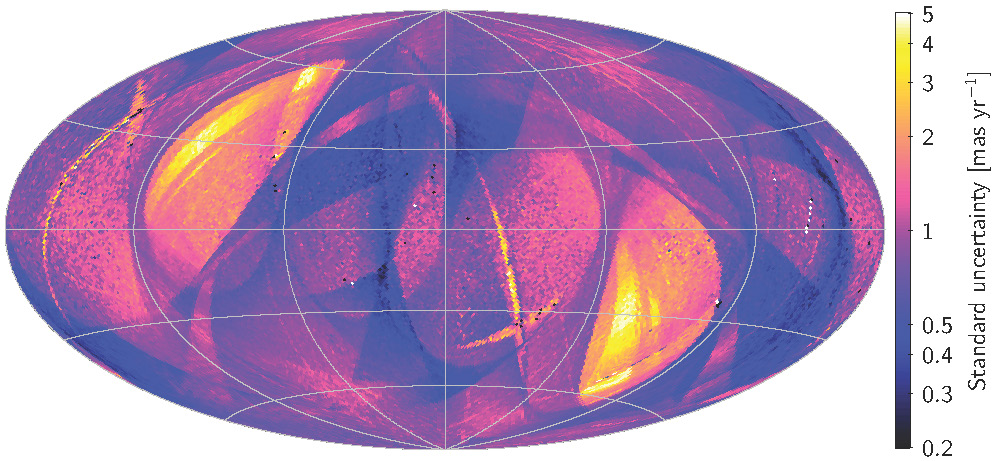
The maps below depict summary statistics for the 2 million sources in the TGAS dataset. The five maps along the main diagonal show, from top-left to bottom-right, the standard uncertainties in α, δ, ϖ, μα*, μδ. The ten maps above the diagonal show the correlation coefficients, in the range −1 to +1, between the corresponding parameters on the main diagonal. All maps use an Aitoff projection in equatorial (ICRS) coordinates, with origin α = δ = 0 at the centre and α increasing from right to left. Median values are shown in cells of about 0.84 deg2 (L. Lindegren et al., 2016).
Note that the uncertainty statistics are different from the predictions in the TGAS papers by Michalik et al. The predictions were based on simulations that are not fully representative of the actual Gaia mission and DR1.
Click on the maps to enlarge the images. Click on the labels to download the statistics (in csv format).
| σα* | ρ(α,δ) | ρ(α,ϖ) | ρ(α,μα*) | ρ(α,μδ) |
 |
 |
 |
 |
 |
| σδ | ρ(δ,ϖ) | ρ(δ,μα*) | ρ(δ,μδ) | |
 |
 |
 |
 |
|
| σϖ | ρ(ϖ,μα*) | ρ(ϖ,μδ) | ||
 |
 |
 |
||
| σμα* | ρ(μα*,μδ) | |||
 |
 |
|||
| σμδ | ||||
 |
Astrometric UNCERTAINTY
TGAS - astrometric uncertainties
| All TGAS sources | Hipparcos subset | |||||
| 10% | 50% | 90% | 10% | 50% | 90% | |
| G magnitude | 9.29 | 11.04 | 12.05 | 7.00 | 8.32 | 9.73 |
| position (mas) | 0.20 | 0.32 | 0.75 | 0.20 | 0.26 | 0.46 |
| parallax (mas) | 0.24 | 0.32 | 0.64 | 0.23 | 0.28 | 0.48 |
| proper motion (mas yr-1) | 0.72 | 1.32 | 3.19 | 0.04 | 0.07 | 0.14 |
These are precisions. There is an additional systematic parallax error of ±0.3 mas.
Secondary set - positional uncertainties
| G mag | fraction | 10% | 50% | 90% |
| < 16 | 7% | 0.1 | 0.3 | 5.3 |
| 16-17 | 7% | 0.2 | 0.5 | 12.1 |
| 17-18 | 12% | 0.3 | 0.8 | 12.4 |
| 18-19 | 21% | 0.5 | 1.5 | 13.7 |
| 19-20 | 30% | 0.9 | 2.7 | 16.6 |
| 20-21 | 22% | 1.9 | 2.4 | 21.5 |
| All | 100% | 0.35 | 2.4 | 16.3 |
Quantile positional precisions in mas.
PHOTOMETRIC UNCERTAINTY
 |
|
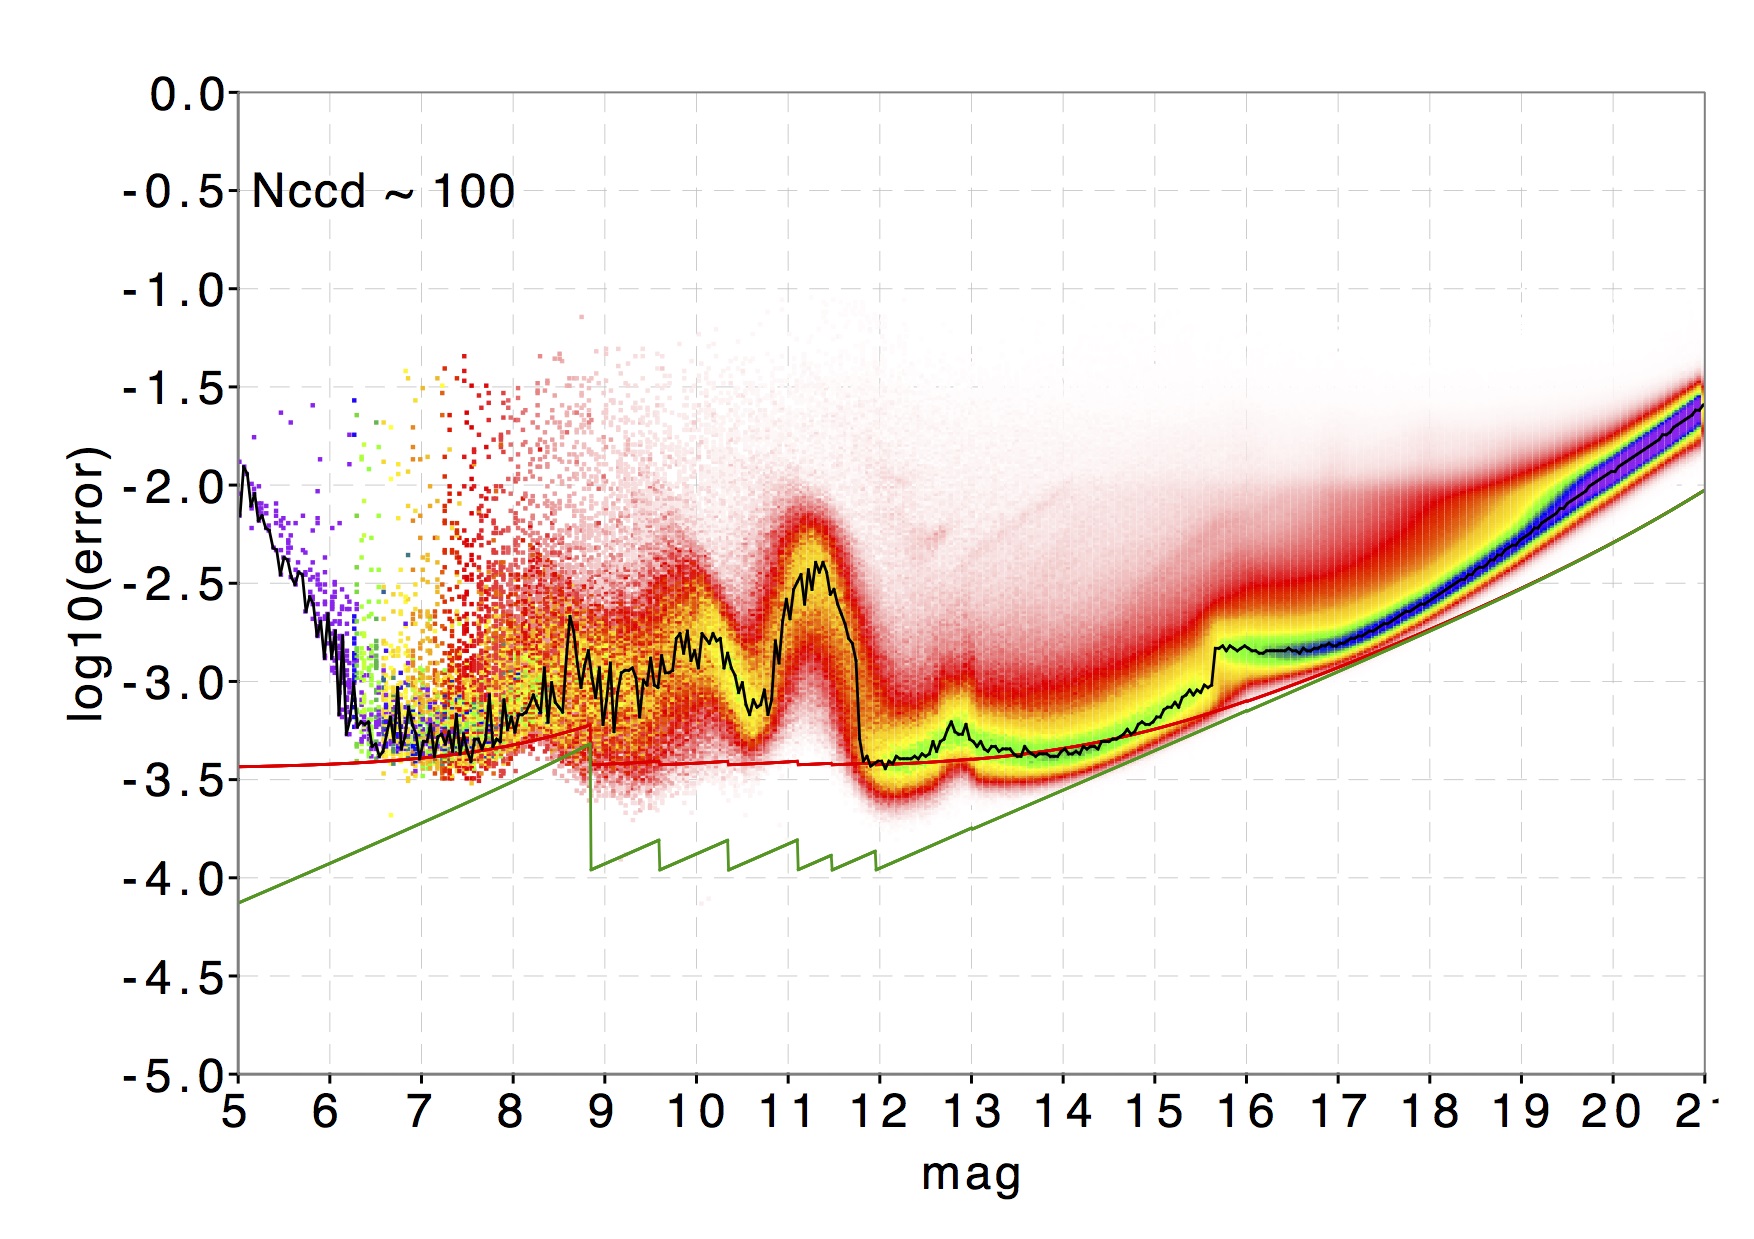
The distribution of error on the weighted mean G-value as a function of magnitude. The black line shows the mode of the distribution. This plot is restricted to all sources with between 90 and 110 CCD transits. The green line shows the expected errors for sources with 100 CCD transits and for a nominal mission with perfect calibrations. The red line shows the same error function but with a calibration error of 3 mmag added in quadrature to the individual observations (Evans et al., 2016). |
Limitations of Gaia DR1
We summarise below the shortcomings of Gaia DR1 that are most relevant when it comes to the scientific interpretation of the catalogue data. For more details please refer to the Gaia DR1 papers and to the Gaia DR1 documentation (available on 14 September 2016). All of the DR1 shortcomings listed below will be addressed in future Gaia data releases with very substantial improvements already expected for Gaia DR2.
Survey completeness
- This initial Gaia DR1 is not a complete survey. The source list for the release is incomplete at the bright end and has an ill-defined faint magnitude limit, which depends on celestial position;
- The combination of the Gaia scan law coverage and the filtering on data quality done prior to the publication of Gaia DR1 results in large regions on the sky (predominantly along the ecliptic) where many sources are missing, with source density fluctuations that reflect the scan law pattern. In addition, gaps may appear in the source distribution;
- Many bright stars at G≲7 are missing from Gaia DR1;
- Sources close to bright objects are sometimes missing;
- High proper motion stars (μ>3.5 arcsec yr-1) are missing;
- Extremely blue and red sources are missing;
- In dense areas on the sky (above some 400,000 stars per square degree) the effective magnitude limit of Gaia DR1 may be brighter by up to several magnitudes;
- For double stars or binaries at separations below about 4 arcsec, there is a notable decrease in the completeness of the detection of the secondaries. This is a side effect of the non-optimal way in which close pairs have been handled in the cross matching. This feature will disappear with the next Gaia data release due to improvements in the cross-matching algorithm.
Astrometry
- All sources were treated as single stars without taking their radial velocity into account. Any astrometric effects due to the orbital motion in binaries or due to perspective acceleration were ignored. These source modelling errors are in principle accounted for in the astrometric_excess_noise data field but this quantity should be treated with caution as it also includes other modelling errors present in Gaia DR1;
- A global parallax zero point offset of ±0.1 mas may be present, where during the Gaia DR1 validation a value of −0.04 mas was found;
- The correlations between the astrometric parameters for a given source can reach significant values over large areas of the sky. It is thus very important to make use of the full covariance matrix when taking the standard uncertainties on (subsets and linear combinations of) the astrometric parameters into account in any scientific analysis of the Gaia DR1 data;
- There are colour dependent and spatially correlated systematic errors at the level of ±0.2 mas. Over large spatial scales, the parallax zero-point variations reach an amplitude of ±0.3 mas, while over a few smaller areas (∼2 degree radius), much larger parallax biases may occur of up to ±1 mas. Averaging parallaxes over small regions of the sky will not reduce the uncertainty on the mean below the 0.3 mas level. Whereas it has been suggested, for instance in Gaia Collaboration et al. (2016a) that a systematic error of ~0.3 mas should be 'added' (in quadrature) to the published parallax uncertainties, this is not correct: Brown (2017) clarifies that reported parallax standard errors already include local systematics as a result of the calibration of the TGAS parallax uncertainties by comparison to Hipparcos parallaxes. The advice is to use the uncertainties quoted in the catalogue (while possibly modelling systematic effects as part of the analysis), but to keep the systematics in mind when interpreting the results of the data analysis.
Photometry
- For the brightest stars, G<12, the photometric accuracy is estimated to be limited to a calibration floor of ∼3 mmag for the individual CCD transits;
- The quoted standard uncertainties on the mean G-band magnitudes at the bright end vary by an order of magnitude due to not fully converged calibrations;
- Over the range G=12–17, the distribution of photometric standard uncertainties as a function of magnitude shows two bumps at G≈13 and G≈16 due to not fully converged calibrations;
- A small fraction of sources has clearly wrong G-band magnitude values. These are sources with quoted magnitudes well beyond the Gaia survey limit, or sources in common with Tycho-2 that have magnitudes well beyond the Tycho-2 survey limit.
Documentation
Access to the Gaia Archive Documentation is provided here.
The Archive Documentation Data Model (column description) can be found here.
Media information
Media Kit for Gaia Data Release 1
Watch a replay of the Gaia First Data Release Media Briefing
Gaia's First Sky map - annotated
last updated: 14/09/2016
A&A papers
Access the A&A special Gaia issue here.
The Gaia mission
Gaia Collaboration, Prusti, T., de Bruijne, J.H.J., et al., 2016a (arXiv)
Gaia Data Release 1: Summary of the astrometric, photometric, and survey properties
Gaia Collaboration, Brown, A.G.A., Vallenari, A., et al., 2016b (arXiv)
Gaia Data Release 1: On-orbit performance of the Gaia CCDs at L2
Crowley et al. (arXiv)
Gaia Data Release 1: Pre-processing and source list creation
Fabricius et al. (arXiv)
Gaia Data Release 1: Astrometry: one billion positions, two million proper motions and parallaxes
Lindegren et al. (arXiv)
Gaia Data Release 1: The photometric data
van Leeuwen et al. (arXiv)
Gaia Data Release 1: Principles of the Photometric Calibration of the G band
Carrasco et al. (arXiv) (corrigendum: A&A 601, C1)
Gaia Data Release 1: Validation of the Photometry
Evans et al. (arXiv)
Gaia Data Release 1: Catalogue validation
Arenou et al. (arXiv)
Gaia Data Release 1: The reference frame and the optical properties of ICRF sources
Mignard et al. (arXiv)
Gaia Data Release 1: The variability processing & analysis and its application to the south ecliptic pole region
Eyer et al. (arXiv)
Gaia Data Release 1: The Cepheid & RR Lyrae star pipeline and its application to the south ecliptic pole region
Clementini et al. (arXiv)
Gaia Data Release 1: Open cluster astrometry: performance, limitations, and future prospects
Gaia Collaboration et al. (arXiv)
Gaia Data Release 1: Testing the parallaxes with local Cepheids and RR Lyrae stars
Gaia Collaboration et al. (arXiv)
Gaia Data Release 1: Cross-match with external catalogues - algorithm and statistics
Marrese et al. (arXiv)
Gaia Data Release 1: The archive visualisation service
Moitinho et al. (arXiv)
The Gaia Archive
The ESA Gaia Archive: Data Release 1 (2017)
Salgado, J. et al. (arXiv)
Status of the Gaia sky
The Gaia sky: version 1.0
Brown, A.G.A. (arXiv)