
 Sign in
Diffuse Interstellar Bands from RVS spectra - Gaia
Gaia Focused Product Release
Revealing both strong and weak diffuse interstellar bands with Gaia
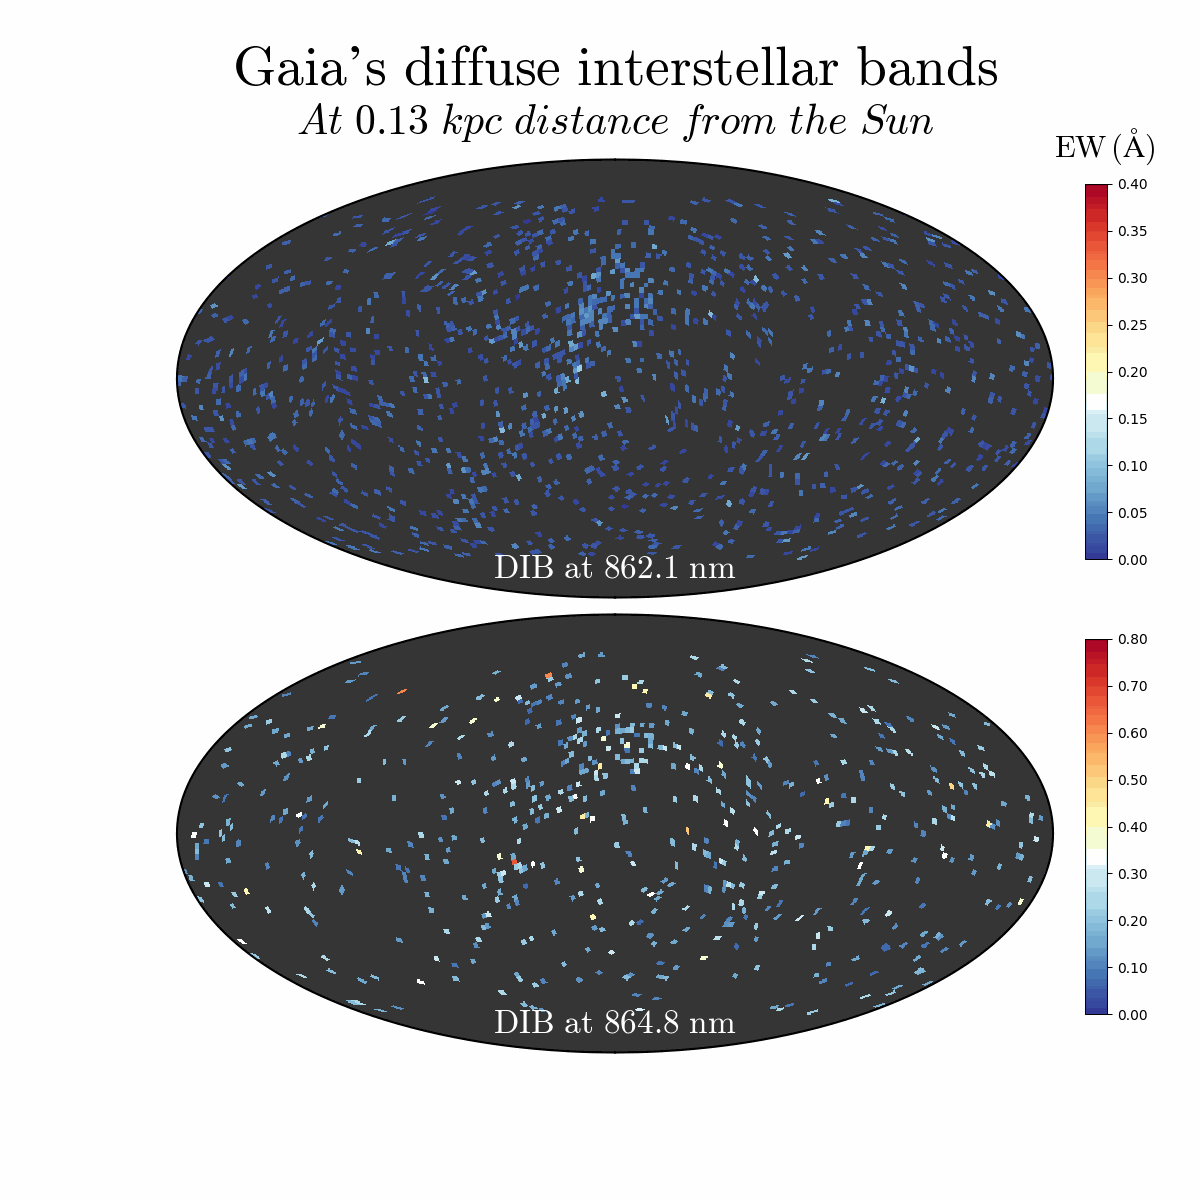
Figure 1. Animated GIF highlighting the mapped diffuse interstellar bands at 862.1nm (top) and at 864.8nm (bottom) in Galactic coordinates. Diffuse interstellar bands are broad absorption bands seen in the spectra of stars. The results are shown at different distances from the Sun. Note: the colour scales for top and bottom are different. Credits: ESA/Gaia/DPAC - CC BY-SA 3.0 IGO. Acknowledgements: Based on the paper “Gaia Focused Product Release: spatial distribution of two diffuse interstellar bands” by Gaia Collaboration, M. Schultheis, et al. Created by Mathias Schultheis, Rosanna Sordo, Tineke Roegiers
Gaia surveys billions of stars and as such unveils the larger structures in our Milky Way. But did you know Gaia also allows to study a type of macromolecule, out there in interstellar space?
The matter in between stars is made from dust and gas. Little do we know though of the exact composition of the interstellar matter. It surely changes from place to place, and possibly even with time. This poses a real issue for astronomers since it does affect our observations of stars: their spectrum is changed if the light coming from these stars travels through more, or less interstellar matter. This effect of the interstellar matter seen in the spectrum is referred to as interstellar absorption and its imprint can be seen on the entire spectrum altogether (it changes the colours of the source). Sometimes specific imprints on the spectrum are visible and small, well-defined absorption features appear, quite similar to those belonging to the star itself.
Since about a century ago, mysterious features were spotted, which could not be traced back to a specific origin. These features are referred to as diffuse interstellar bands. These seem to behave similarly to dust absorption, but with notable yet elusive differences. More data is needed to unveil more hints on the source of this phenomenon and better understand their differences.
With Gaia’s Focused Product Release, Gaia maps two diffuse interstellar bands, present in its RVS spectrum: one stronger and one weaker. It is the first time ever that a weak diffuse interstellar band is mapped with this detail, and… all-sky!
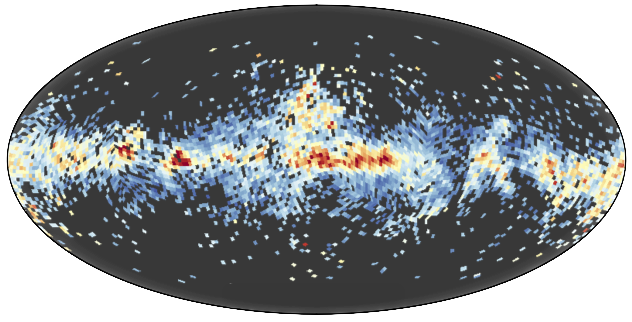
Figure 2. Sky map of the mapped diffuse interstellar bands at 864.8nm in Galactic coordinates, at 1.67kpc from the Sun. Diffuse interstellar bands are broad absorption bands seen in the spectra of stars. Credits: ESA/Gaia/DPAC - CC BY-SA 3.0 IGO. Acknowledgements: Based on the paper “Gaia Focused Product Release: spatial distribution of two diffuse interstellar bands” by Gaia Collaboration, M. Schultheis, et al. Created by Mathias Schultheis, Rosanna Sordo
So how does this work? Already with Gaia’s Data Release 3, Gaia mapped the interstellar medium for the first time all-sky. The strong diffuse interstellar band at 862.1nm is visible in Gaia’s RVS spectra. The weak, associated diffuse interstellar band though, is harder to unveil. To really see it, the signal of this weak diffuse interstellar band needs to be amplified in some way.
Animation. Gaia observes each target, where diffuse interstellar bands (DIBs) are expected, with its radial velocity spectrometer (RVS). This results in an RVS spectrum. At high Galactic latitudes, where DIBs are not expected, stars have similar RVS spectra. These different spectra are stacked together to create a stacked reference spectrum. The spectrum of the target star can be divided by this stacked reference spectrum, revealing the diffuse interstellar bands (DIBs) in the spectrum. Using this technique, 235 428 measurements of DIBs were performed with Gaia, allowing to probe DIBs in great detail as well as farther away from us. Credits: ESA/Gaia/DPAC - CC BY-SA 3.0 IGO. Acknowledgements: Mathias Schultheis, He Zhao, Rosanna Sordo, Federico Di Giacomo. Video editing: Federico Di Giacomo. Images: ESA/Gaia/DPAC, Rosanna Sordo.
To truly highlight the diffuse interstellar bands, a reference spectrum without DIBs is needed first. For each target star for which the DIB is potentially measurable, reference stars are identified having nearly identical RVS spectra. One important difference though, these reference stars belong to areas in the sky where, from previous investigations, DIBs are not expected.
By stacking the RVS spectra of these reference stars, taken at high galactic latitudes to prevent them from being too heavily affected by dust and gas, a reference stacked spectrum is thus created. The target spectrum is then divided by the reference stacked spectrum, revealing not only the strong DIB at 862.1nm in full detail, but now also the weak DIB at 864.8nm.


Figure 3. On the left, the face-on view of the mapped diffuse interstellar band at 862.1nm with Gaia’s data release 3. On the right, face-on view of the mapped diffuse interstellar band at 862.1nm with Gaia’s focused product release. It is clearly seen that in this new release, the mapping of the diffuse interstellar band reaches a larger distance from the Sun. Observing in both cases the top plot, the diffuse interstellar band is clearly more strong in-plane and less visible out-of-plane. Credits: “Gaia Focused Product Release: spatial distribution of two diffuse interstellar bands” by Gaia Collaboration, M. Schultheis, et al.
Detecting both the strong and weak diffuse interstellar bands, with such precision in a large portion of the Galaxy, helps to cast light on the nature of one of the macromolecules that are out there in interstellar space. This, in turn, helps us to better understand Gaia observations.
Further reading:
- Gaia Focused Product Release: Spatial distribution of two diffuse interstellar bands by Gaia Collaboration, M. Schultheis, et al.
- Gaia Data Release 3 story: what is in between the stars? Gaia's view on dust and the interstellar medium
Story written by Tineke Roegiers, Rosanna Sordo, Mathias Schultheis, Orlagh Creevey
Credit: ESA/Gaia/DPAC
Contact email: Gaia Helpdesk
Published: 10-10-2023
- Removed a total of (11) style text-align:center;
- Removed a total of (1) style text-align:left;
- Removed a total of (8) style text-align:justify;
- Removed a total of (1) style float:none;
More Gaia Focused Product Release stories?
COSMOLOGY:
Gaia's gravitational lens search around quasars
Solar System:
Updated astrometry for Gaia's Solar System Objects
Variability:
Gaia's extended radial velocity epoch data for Long Period Variables
Interstellar Medium:
Diffuse Interstellar Bands from Gaia's Radial Velocity Spectra
Globular Clusters:
Gaia's additional data from engineering images taken in crowded regions
-
ESA's press release for Gaia's Focused Product Release
-
- Removed a total of (15) style text-align:center;
- Removed a total of (1) style float:right;