
 Sign in
Additional data from engineering images in omega Centauri - Gaia
Gaia Focused Product Release
Omega Centauri, a globular cluster bursting with stars
Gaia's additional data from engineering images taken in crowded regions
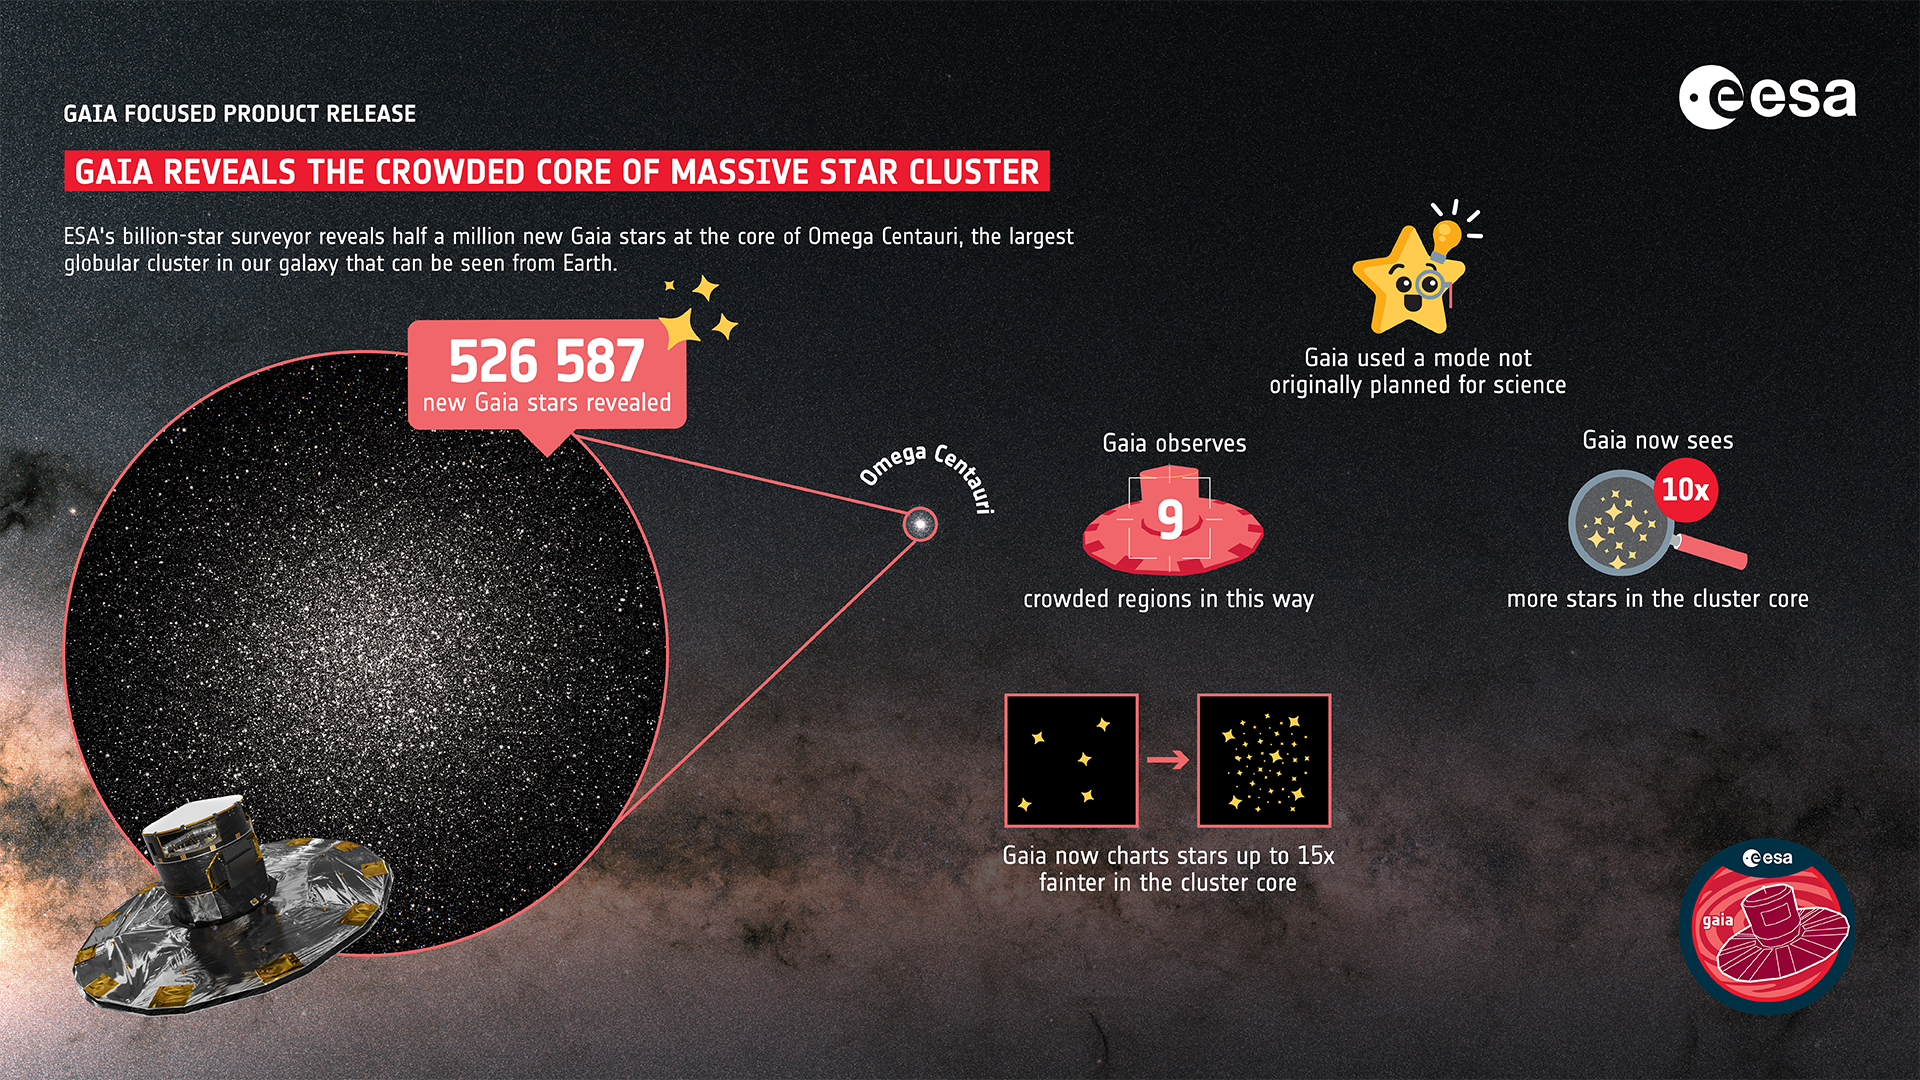
Figure 1. Gaia reveals more than half a million stars in a massive cluster – stars the telescope had not seen before. Gaia’s third data release (DR3) contains data on over 1.8 billion stars, building a pretty complete view of the Milky Way and beyond. However, there remained gaps in the mapping. Gaia had not yet fully surveyed areas of sky that were especially densely packed with stars, leaving these comparatively unexplored – and overlooking stars shining less brightly than their many neighbours. To patch the gaps in our maps, Gaia selected omega Centauri, the largest globular cluster that can be seen from Earth and a great example of a ‘typical’ cluster. Rather than just focusing on individual stars as it typically would, Gaia enabled a special mode to truly map a wider patch of sky surrounding the cluster’s core every time the cluster came into view. 526 587 new Gaia stars from this cluster alone are published now, stars too densely packed together to be measured in the telescope’s regular pipeline and those in the cluster core that are up to 15 times fainter than previously seen. The new data reveal 10 times more Gaia stars in omega Centauri! This new knowledge will enable researchers to study the cluster’s structure, how the constituent stars are distributed, how they’re moving, and more, creating a complete large-scale map of omega Centauri. Gaia explores nine crowded regions in this way, with the results to be included in Gaia Data Release 4. The image of omega Centauri in this infographic, in the inset circle, shows the cluster as observed by Gaia. Credits: ESA/Gaia/DPAC - CC BY-SA 3.0 IGO. Acknowledgements: Based on the paper by Gaia Collaboration, K. Weingrill et al., image of omega Centauri created by Stefan Jordan and Toni Sagristá. Graphic produced by ATG under contract to ESA, created by Juliana Calegari with help from Nicola Jenner, Nicole Shearer, Iris Nijman, Tineke Roegiers, Katja Weingrill, Alexey Mints, Stefan Jordan.
For the first time, Gaia presents data captured with its special observation mode. A newly developed data reduction pipeline adds new sources to the already existing Gaia catalogue and calculates their information from full two-dimensional detector images. The pipeline is specialized to disentangle the information in extremely crowded regions in the sky, in which star images often overlap on the detector. One such region is the globular cluster omega Centauri, for which half a million new sources are now published by the Gaia Collaboration. Compared to the existing 1.8 billion Gaia stars this may seem few, but they are all in one and the same crowded region of the sky, and it increases the number of Gaia stars in the very core of this region tenfold.
Animation showing a zoom into the globular cluster ω Centauri to highlight the number of stars added by the analysis of 2300 two-dimensional SIF images captured within the globular cluster. Credits: ESA/Gaia/DPAC - CC BY-SA 3.0 IGO. Acknowledgements: Based on the paper by Gaia Collaboration, K. Weingrill, et al., 2023; artificial voice, video created by Stefan Jordan, Katja Weingrill, Alexey Mints using visualisation software „Gaia Sky“ developed by Toni Sagristà.
Gaia’s standard observation strategy uses small readout windows dedicated to a single star. This method reaches its limitations in very crowded regions. The existing Gaia catalogue therefore has holes in these regions, visible most prominently for the faint stars as is illustrated in Figure 2. With Gaia’s special observation mode that collects the full detector images, these holes can now be filled up with the new Crowded Field sources. In a way, with this new release, Gaia patches this region to show truly how it is bursting with stars.
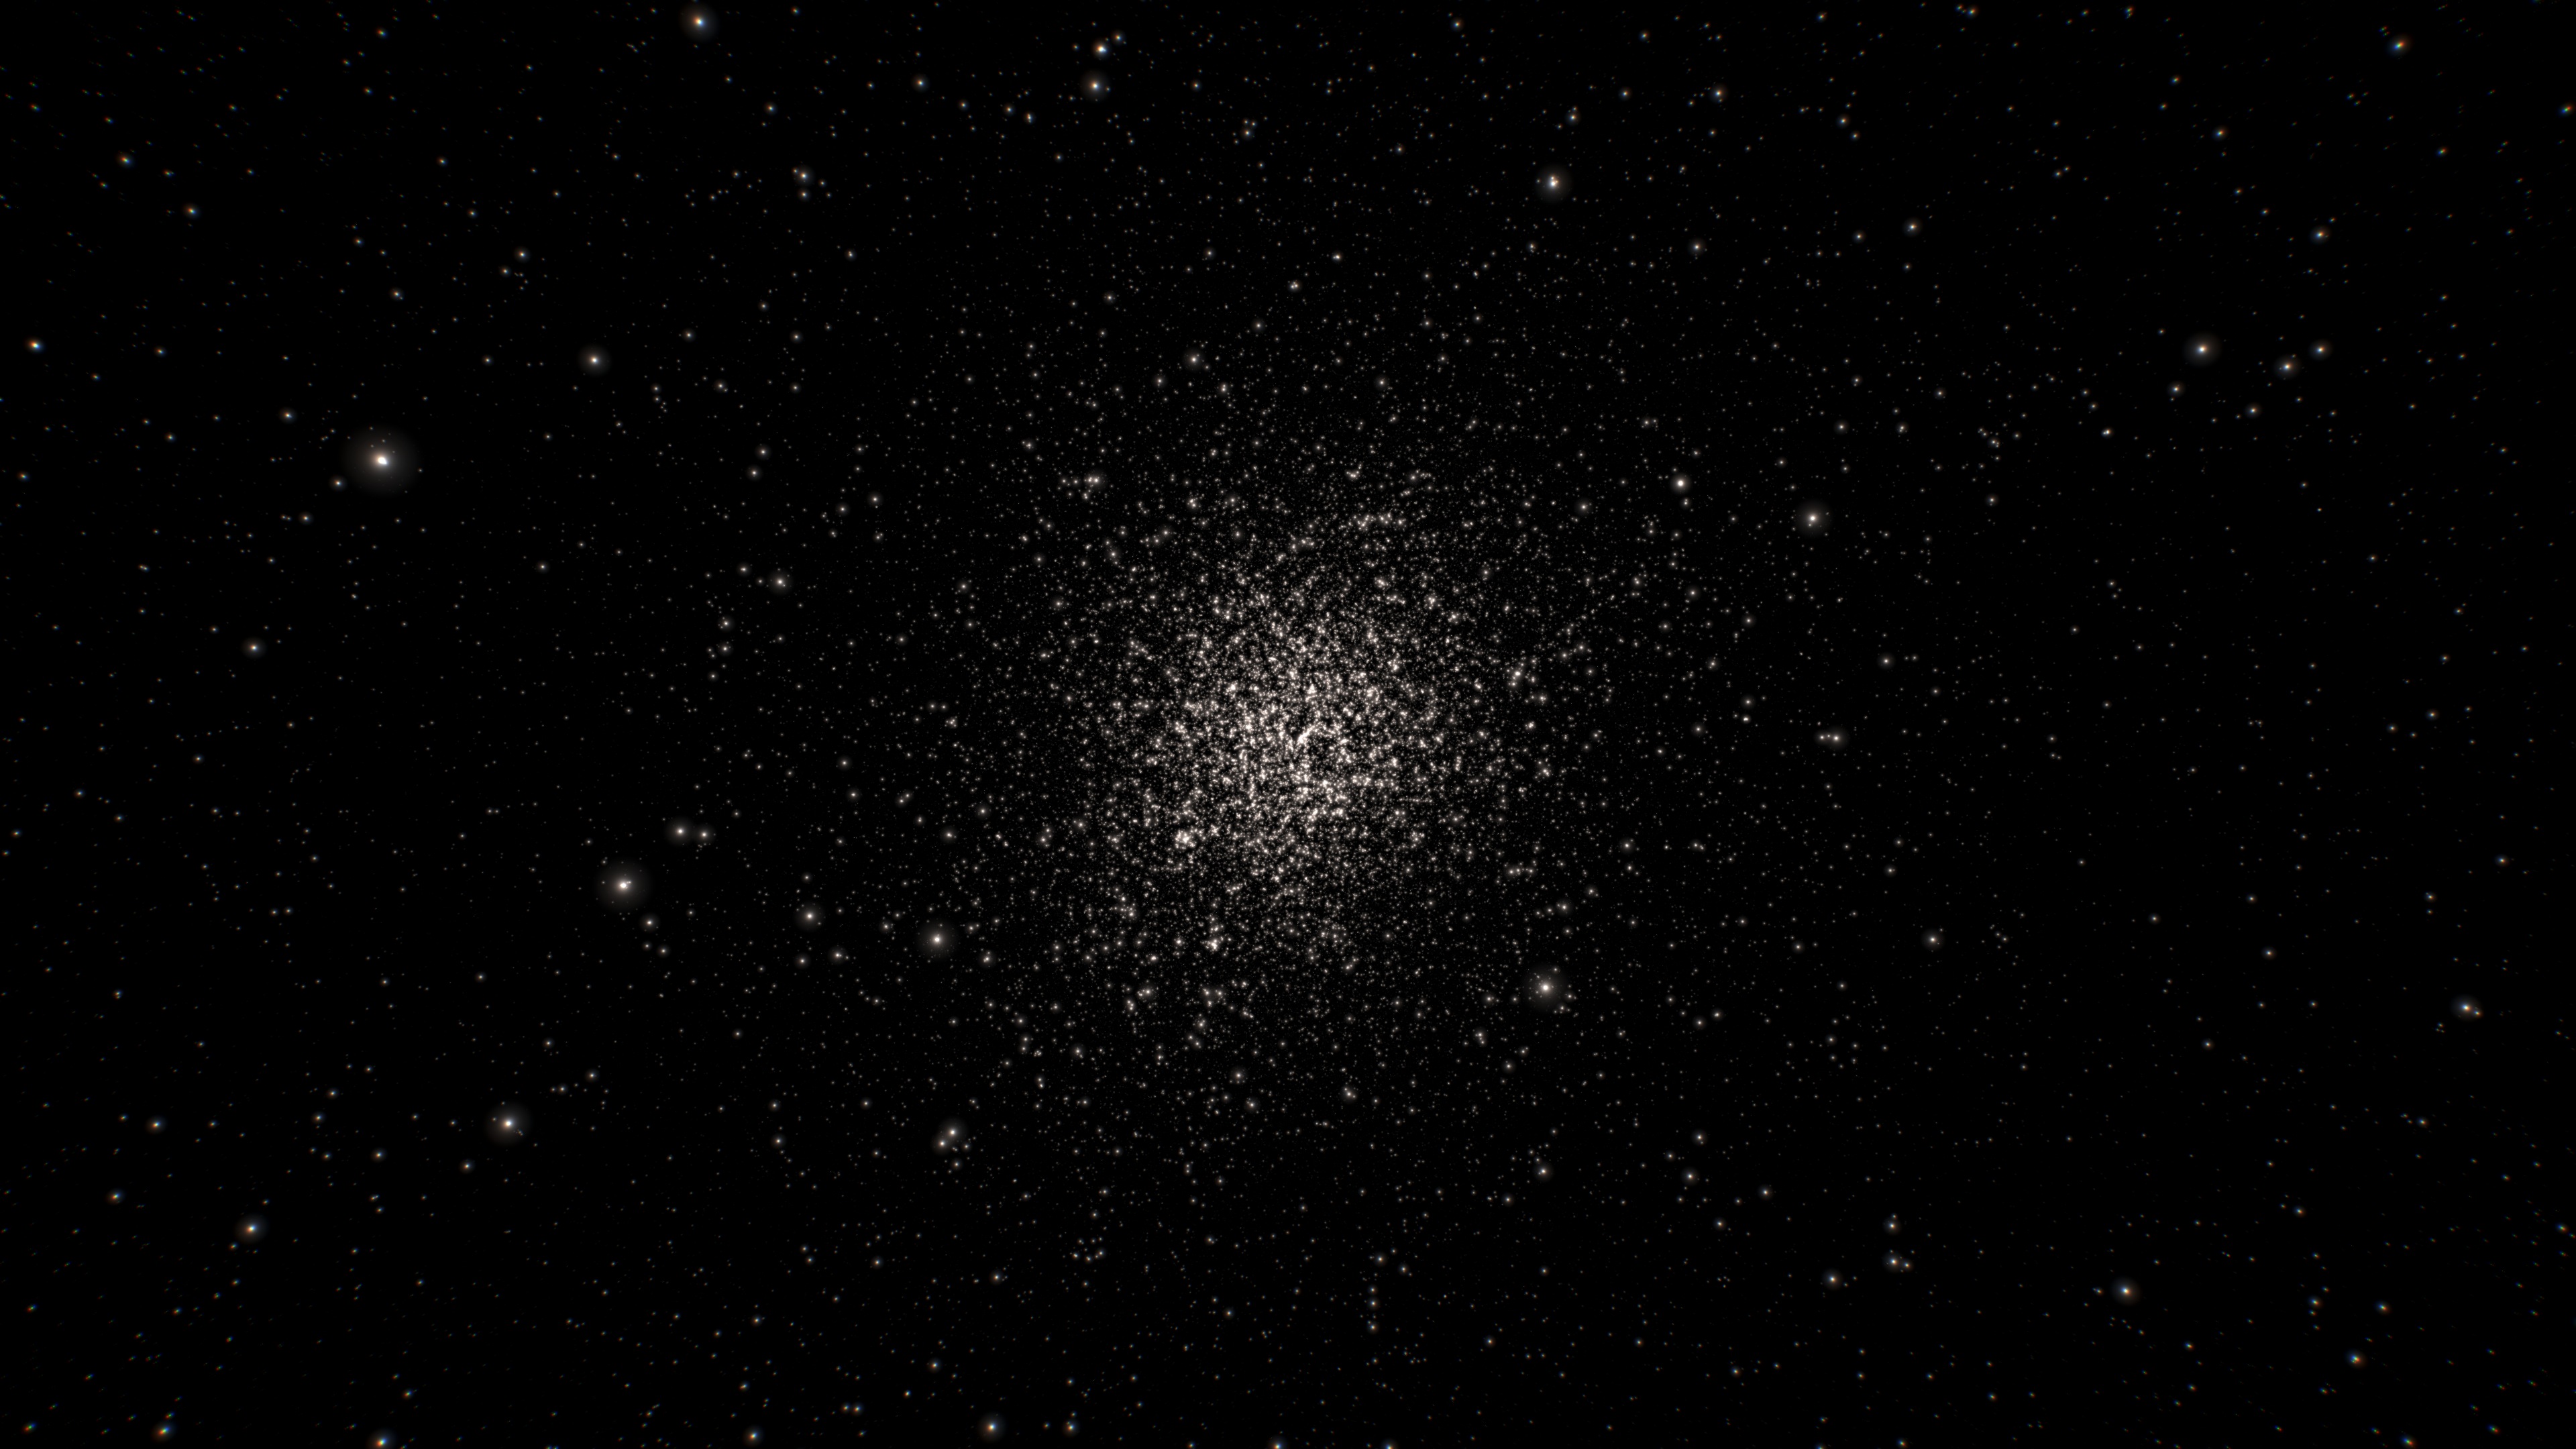
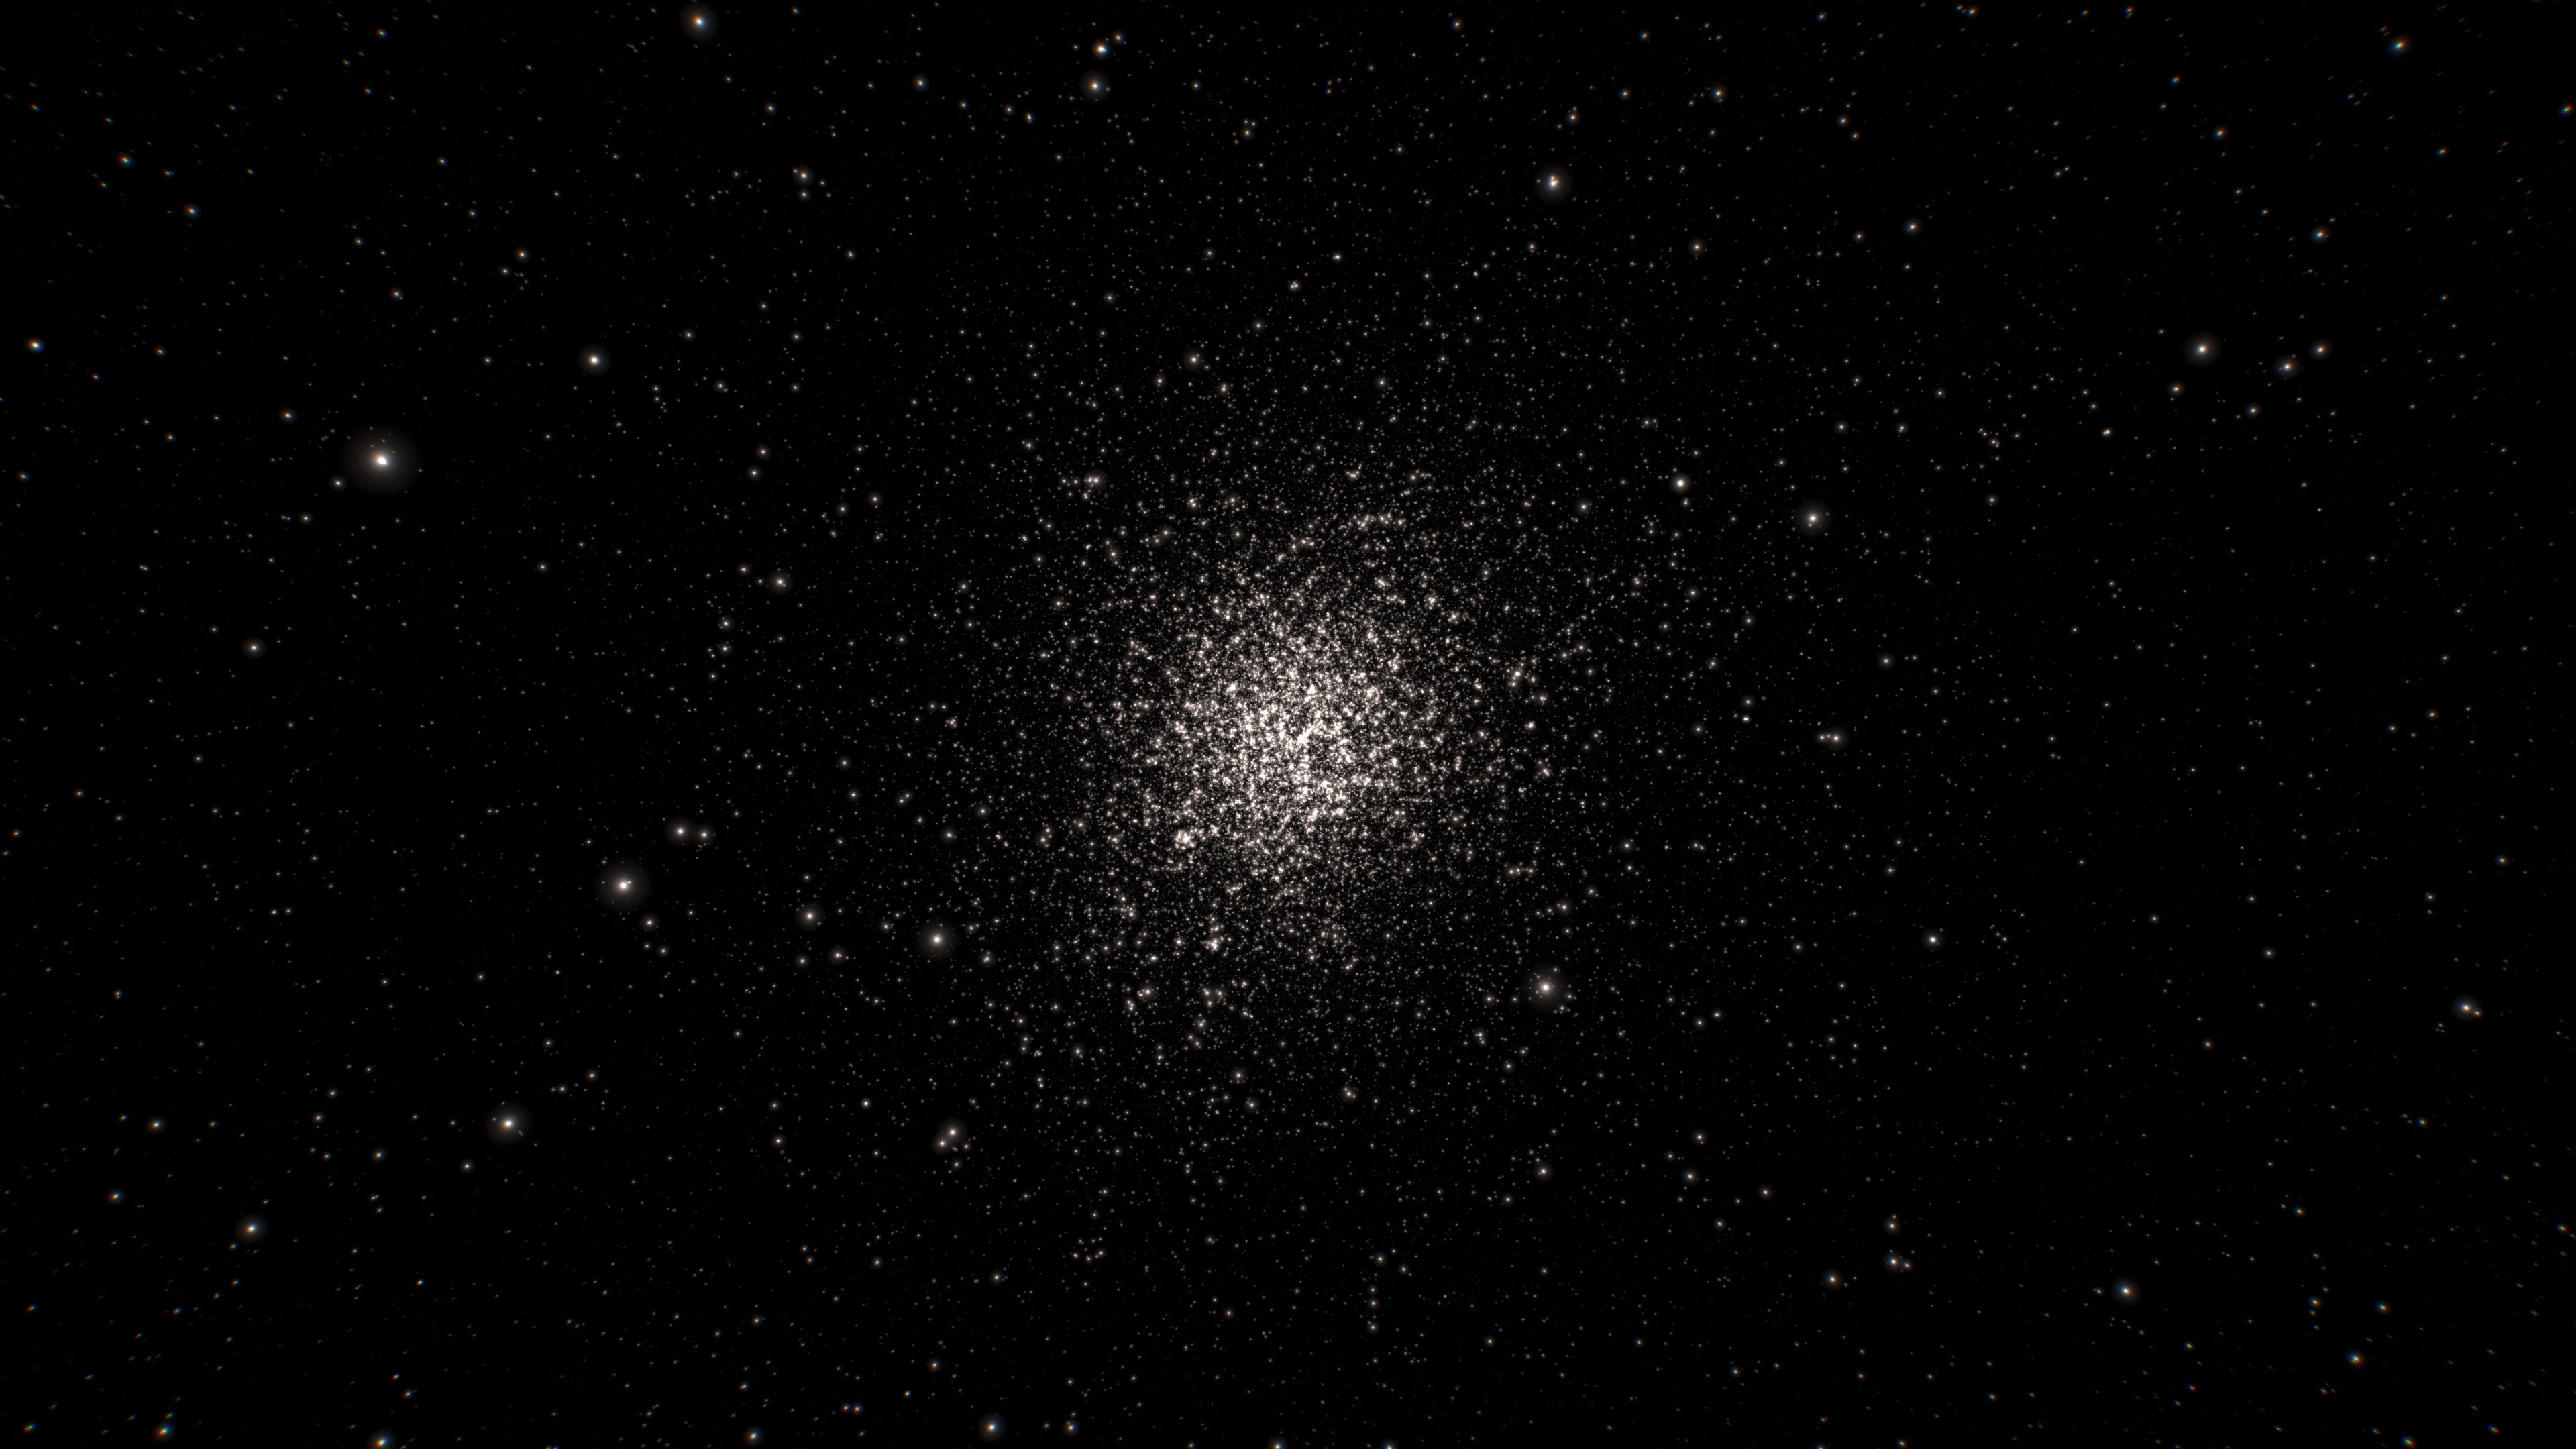
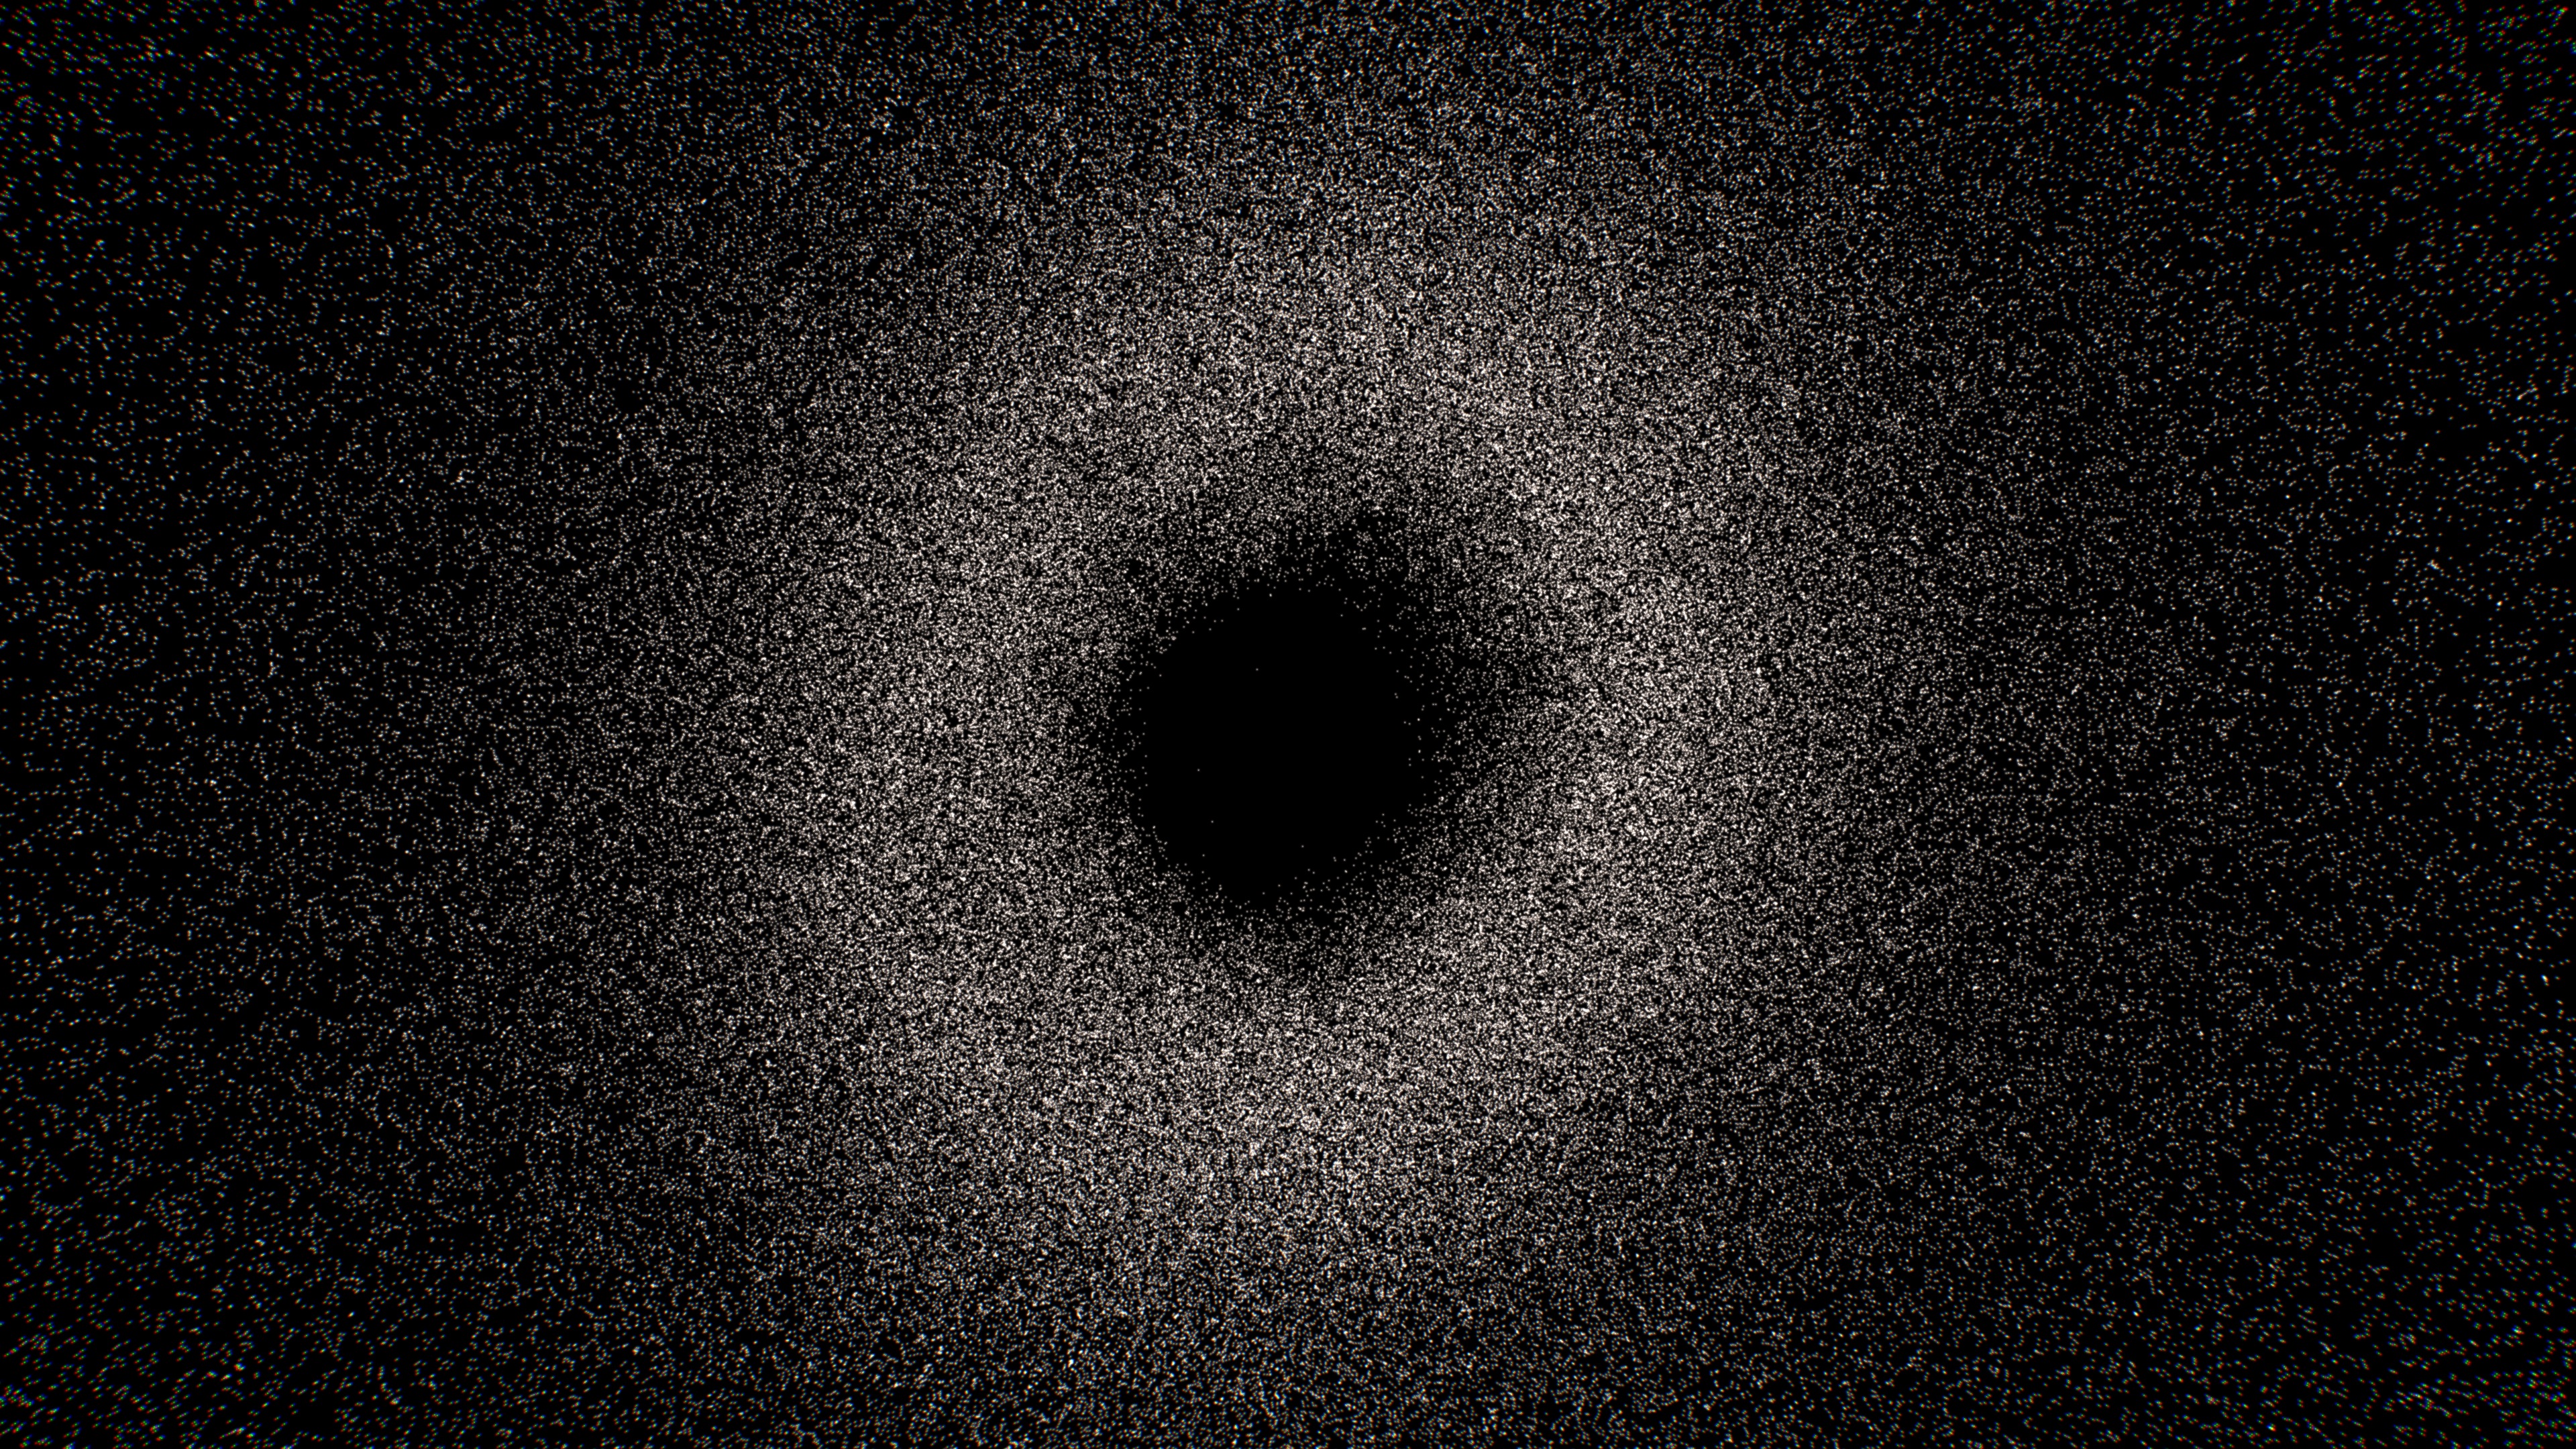
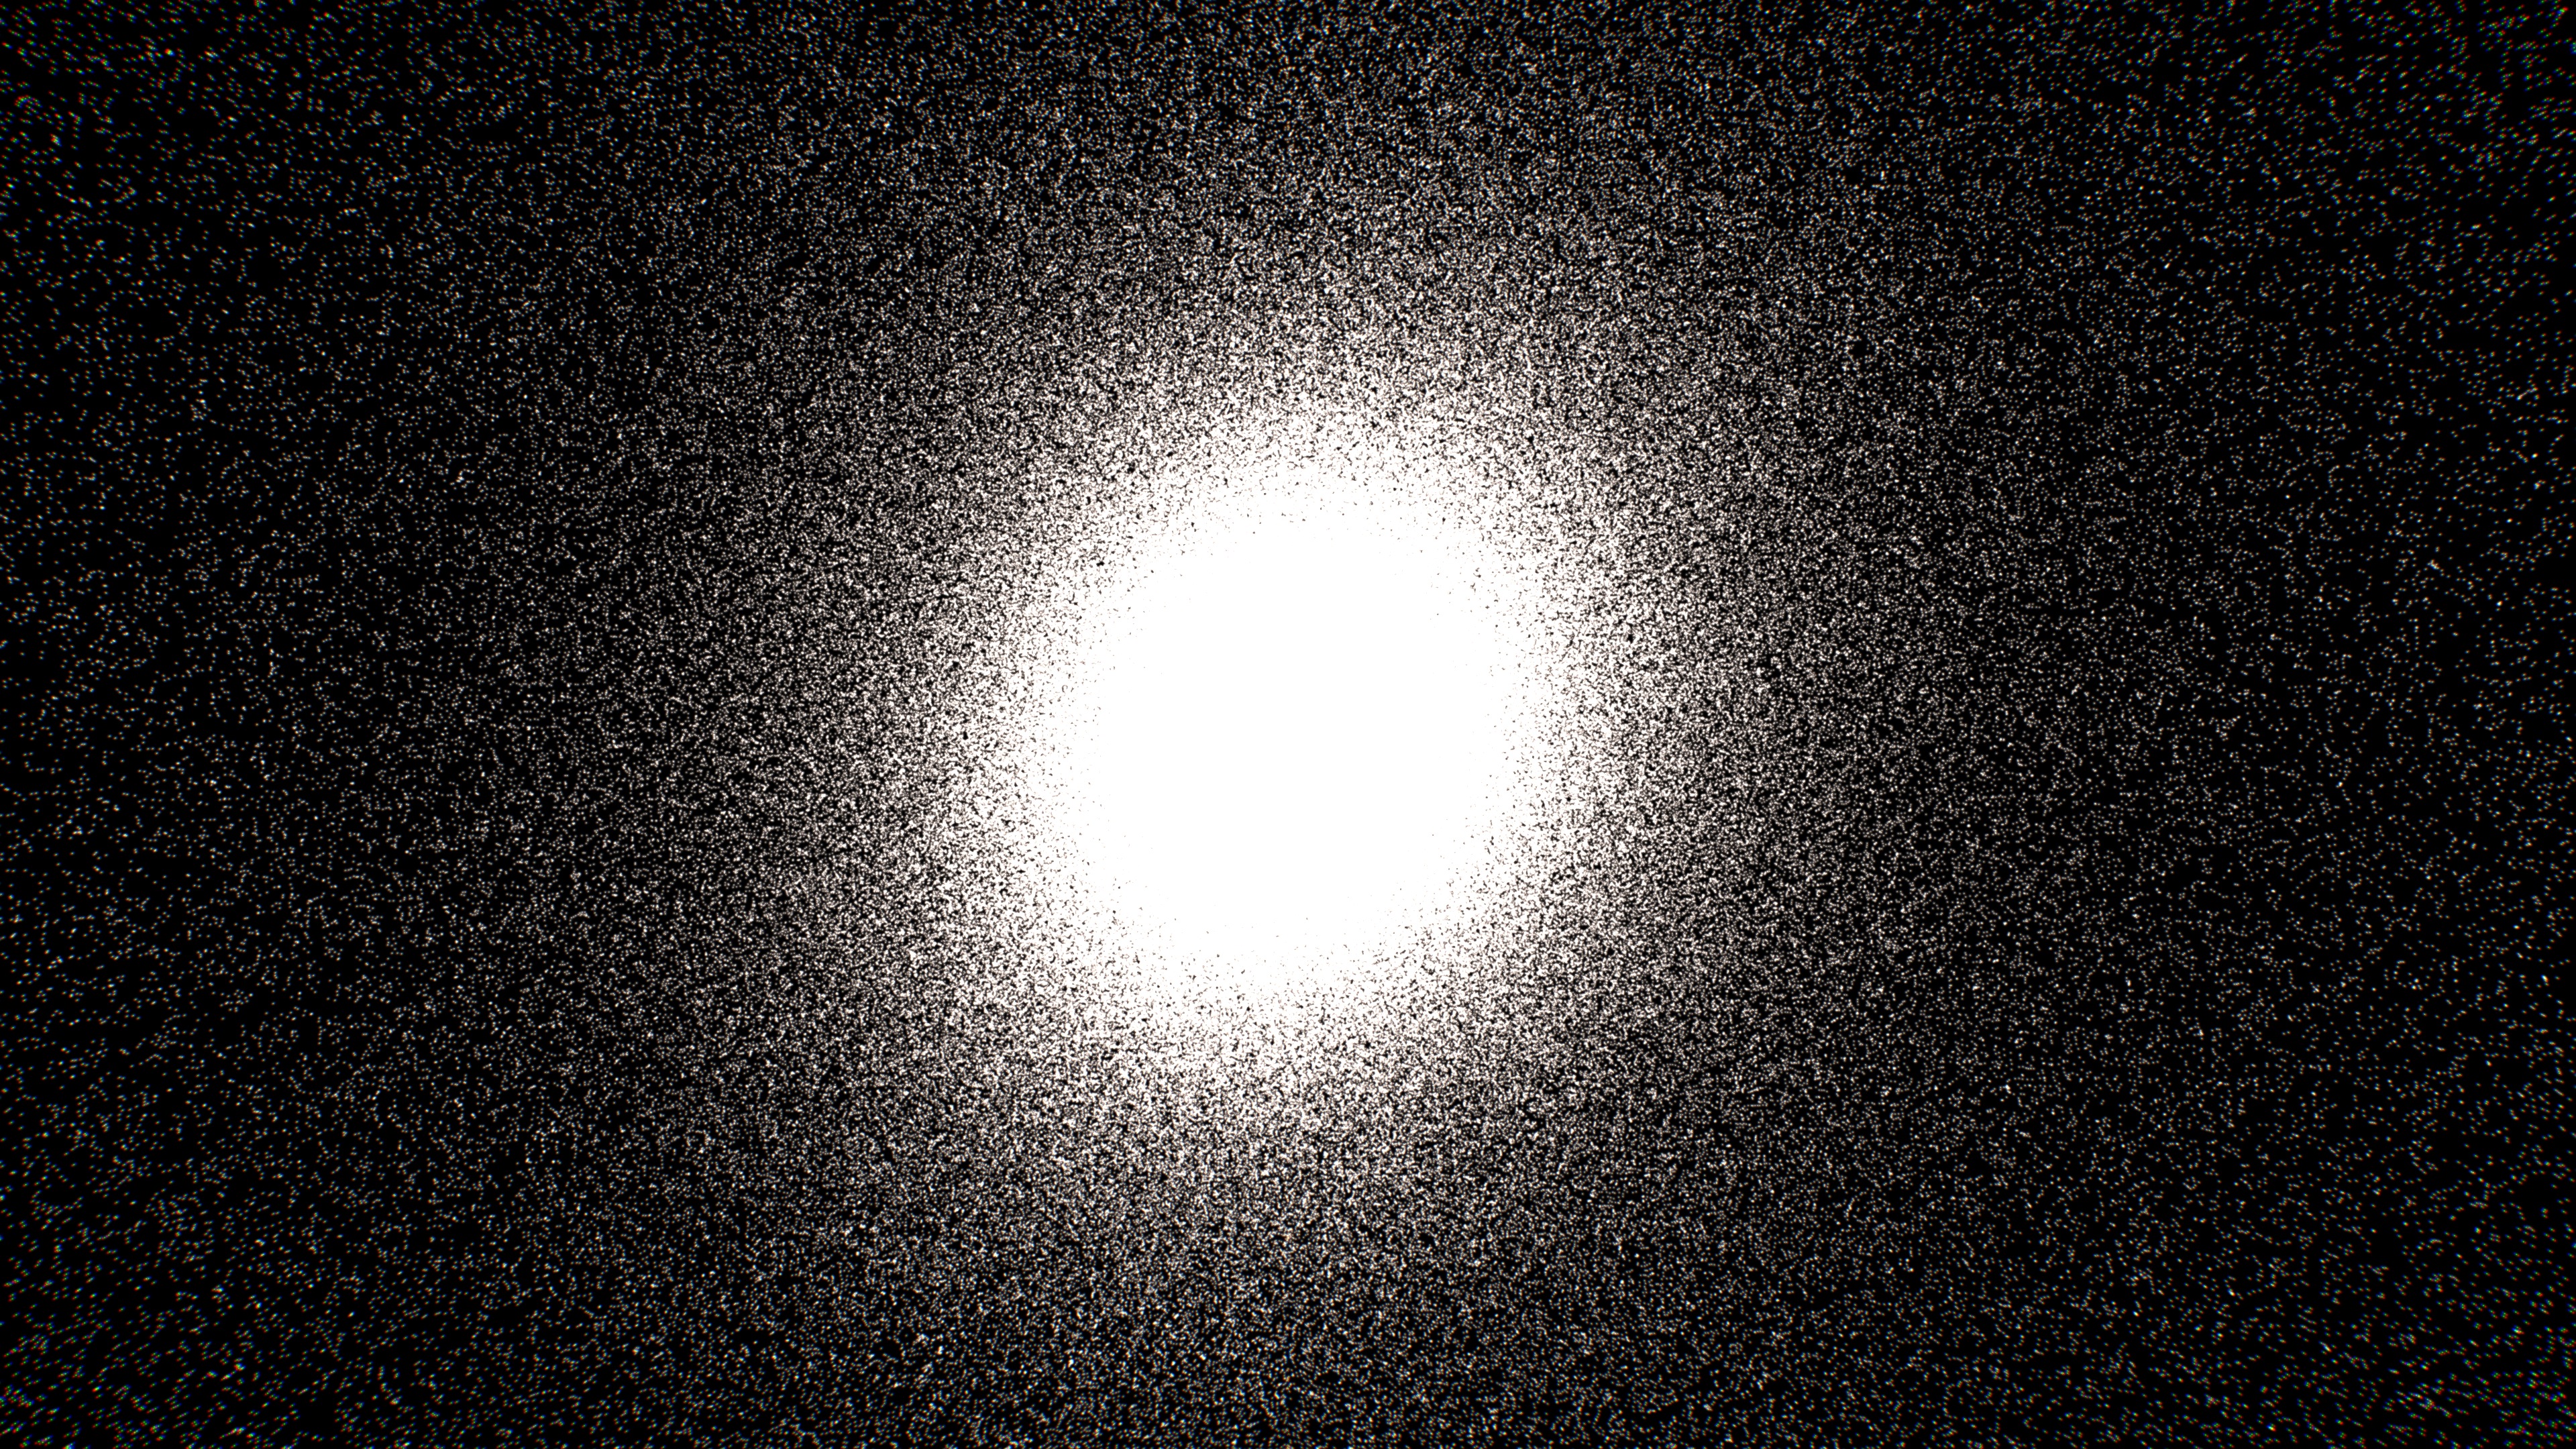
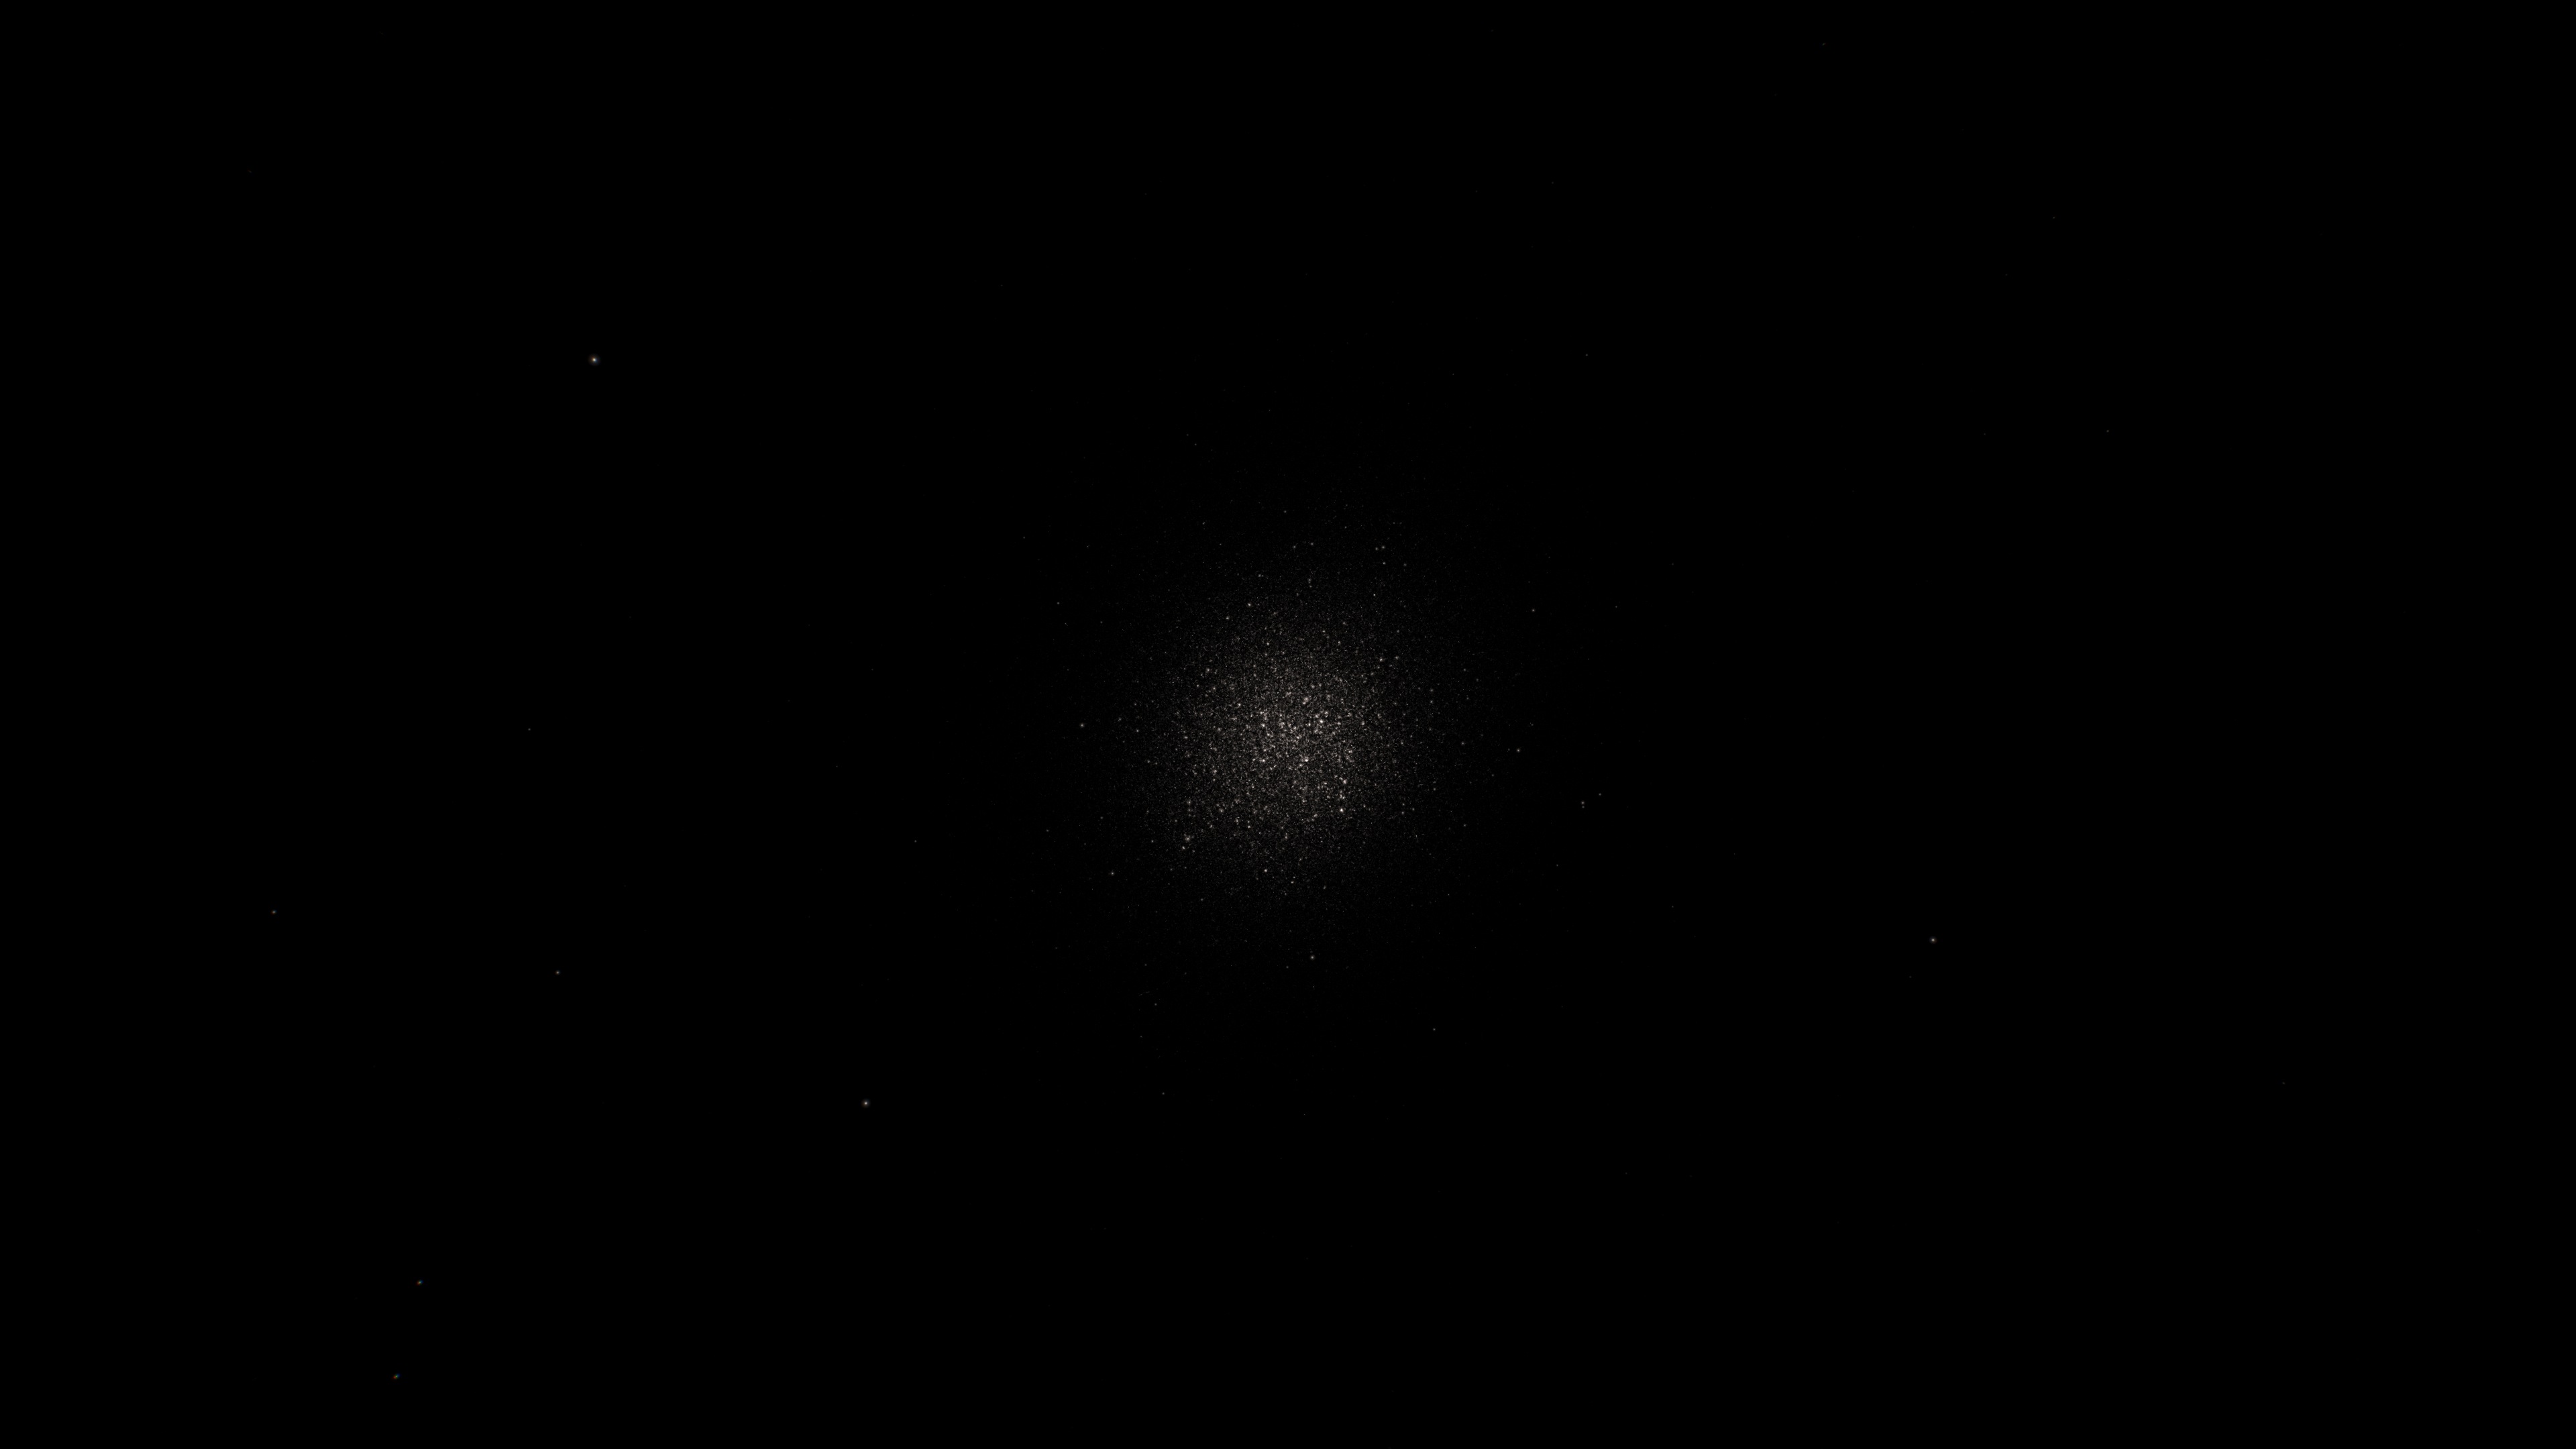
Figure 2. Top row: On the left, all stars in omega Centauri as available in Gaia's Data Release 3 are shown. In the middle, the complete set of stars now available from Gaia, combining the data set from Gaia's Data Relesae 3 with Gaia's Focused Product Release as obtained from engineering images (image showing only the Gaia FPR stars in this region is available here). A GIF on the right alternates between both images. In the top row plots, stars with all varying brightness levels are on display, ranging from magnitude 6.5, just below the naked eye's visibility limit, to the faintest at magnitude 21.8, which is over a million times fainter. It is not easy to see for the full set, what Gaia adds to omega Centauri. To truly see the difference, the bottom row highlights only the faint stars with magnitudes between 18 and 21. To make the faint stars properly visible, they have all been plotted with the same brightness. Now on the left is seen the Gaia Data Release 3 stars available for omega Centauri, with a clear emptiness at the core of the cluster at the faint end. In the middle, the complete set with both Gaia DR3 and Gaia FPR faint stars is seen, where the addition of over half a million sources in the cluster's core becomes evident. A GIF on the left helps to see the massive improvement made with this Gaia Focused Product Release in this region. Credits: ESA/Gaia/DPAC - CC BY-SA 3.0 IGO. Acknowledgement: Stefan Jordan, Katja Weingrill, Alexey Mints, Tineke Roegiers. The visualisation was performed with „Gaia Sky“, developed by Toni Sagristà.
Omega Centauri is a globular cluster in the constellation of Centaurus. It is the largest globular cluster in our Milky Way, and it is estimated to contain about 10 million stars. The Gaia Collaboration selected omega Centauri as one of nine regions to be observed with full crowded field images. Over the past 5 years, these full images were gathered every time Gaia scanned this region. Due to Gaia’s scanning law, the scans of a certain region in the sky are not performed just north to south or east to west. Scans happen in various directions and with varying image lengths. Because of the enormous amount of data contained in images of dense areas, the onboard data handling unit must work overtime.
Animation showing one of the 2300 two-dimensional SIF images captured within the globular cluster “omega Centauri”. The video pans through the image from one side to the other to fully show its extension. Credits: ESA/Gaia/DPAC - CC BY-SA 3.0 IGO. Acknowledgements: Based on the paper by Gaia Collaboration, K. Weingrill, et al., 2023 / Video: Stefan Jordan / Images: Alexey Mints, Katja Weingrill / Visualisation: with „Gaia Sky“, developed by Toni Sagristà.
The new processing pipeline, developed by a small Gaia DPAC team, is part of Gaia’s coordination unit 3 responsible for the astrometric data reduction and uses the full set of images as input to extract the relative positions and observed brightnesses for the many, many sources in omega Centauri. Then the team matches the observations taken at different times and assigns these to individual sources. The positions extracted for these sources are relative to sources already present in the Gaia DR3 catalogue and their brightnesses are calibrated in the Gaia DR3 reference system. Motions are deduced from comparing the various scans and the tiny changes seen in the position of the same sources over time. The Focused Product Release hence publishes positions, motions across the sky and brightnesses of these new sources.
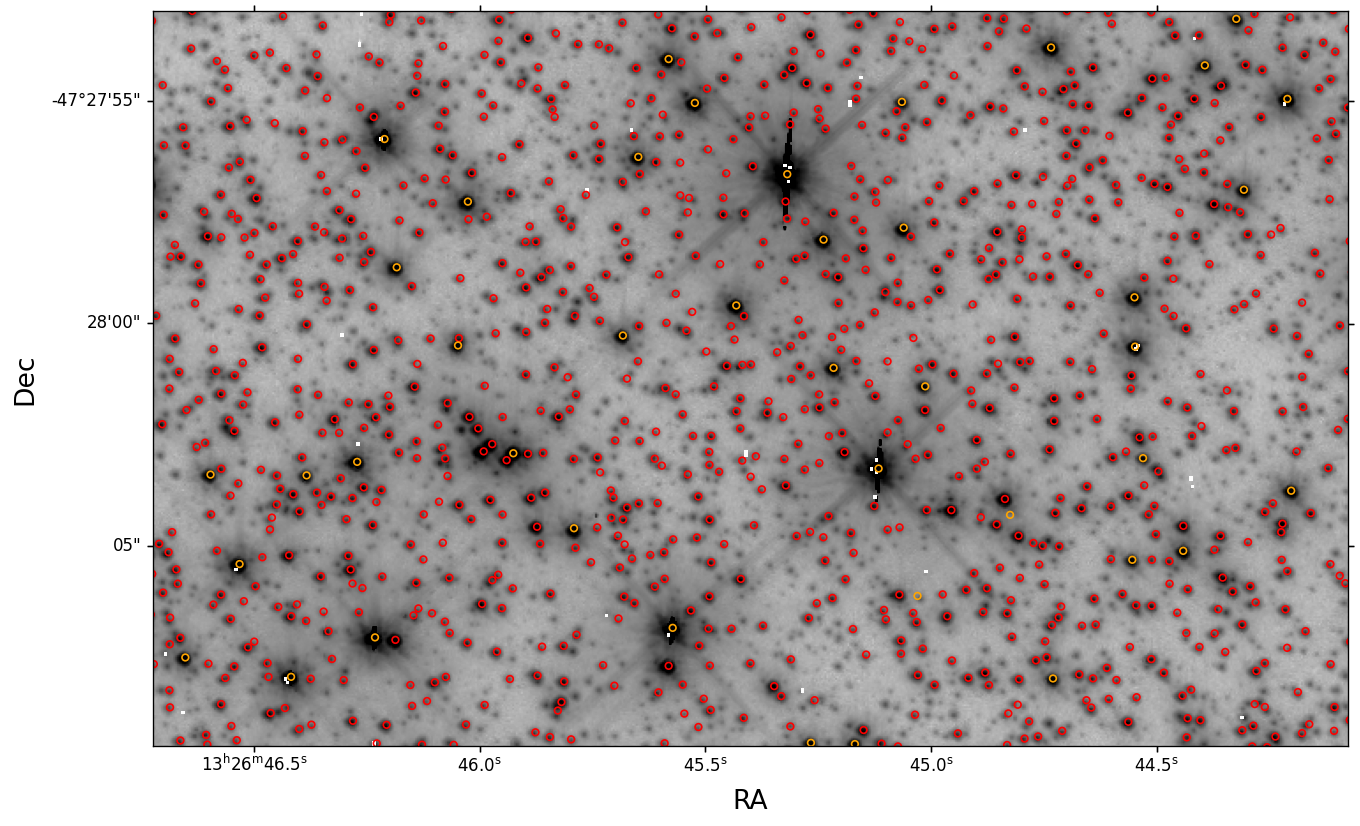
Figure 3. Region in the omega Centauri globular cluster. In the background an image by the Hubble Space Telescope, where the stars are shown in black and the background is white. This helps to show even the fainter stars in this image. Overplotted on this image are the existing Gaia Data Release 3 sources in this region, highlighted with orange circles. Also overplotted are the newly published sources in Gaia’s Focused Product Release, as obtained from engineering images, highlighted with red circles. It is immediately clear that Gaia is adding a massive amount of stars to its catalogue in the omega Centauri globular cluster. Credits: ESA/Gaia/DPAC, background image: Hubble Space Telescope. Acknowledgements: Alexey Mints, Katja Weingrill
With this new data, structures in the globular cluster can be investigated a lot better. Globular clusters are the oldest objects in the Universe. They contain information on the very early stages of our galaxy and hence are of interest when investigating the Milky Way history to understand more about its formation. Even though they are bright objects, clearly visible in the sky, we do not yet understand them very well. They could be the cores of dwarf galaxies that at some point merged with our Milky Way, or they could be something else entirely. Many theories exist and data is needed to investigate which of these theories make most sense.
The images obtained with Gaia for crowded regions are referred to as Service Interface Function images (SIF CF images). For the first time, results obtained from these SIF images are published by the Gaia Collaboration. But what is the difference between these special images and the regular observations by Gaia? This is easier explained when comparing the type of data downloaded for the same regions.
Figure 4. Illustration of a high star density region of the sky observed by Gaia in the nominal way using readout windows (not true to scale) compared to an engineering image of the same region taken with Gaia's Sky Mapper instrument. In normal readout window mode, Gaia only downloads the small regions around detected stars. In a high star density region, there are more stars than Gaia can place windows around, as is nicely illustrated here. Other versions for download (1:1 small extract, full image). Credits: ESA/Gaia/DPAC - CC BY-SA 3.0. Acknowledgements: Alexey Mints, Katja Weingrill, Tineke Roegiers
In the regular Gaia observations, the light enters the Gaia space telescope through both of its “eyes” and falls onto its two Sky Mapper fields. The onboard computer then determines where sources are seen and places small windows around these sources. These windows are then tracked through all Gaia’s CCD detectors while Gaia scans over them. Only the information from within these windows is sent to Earth.
Inside Gaia's billion-pixel camera (Focal plane). Credits: ESA.
When Gaia is about to enter one of these 9 crowded fields, additionally to the normal Gaia observations, the full two-dimensional detector images are downlinked from the Sky Mapper instrument. Since this is a lot of data, these special images can be obtained from very limited regions in the sky only - those for which it is known that the readout window strategy reaches its limitations: the very dense regions bursting with stars.
The data published today for the omega Centauri region was produced from images covering the full nominal mission lifetime. It brings the most complete Gaia map of the omega Centauri region ever and publishes the most crowded field existing in the Gaia catalogue so far. And this is only the first of nine such regions. With Gaia Data Release 4, also the other eight regions will be published: Baade’s Window (Bulge region), Sagittarius I (Bulge region), 47 Tuc (NGC 104), M22 (NGC 6656), NGC 4372, M4 (NGC 6121) as well as the Large and Small Magellanic Cloud regions.
Further reading:
- Gaia Focused Product Release: Sources from Service Interface Function Image Analysis - Half a Million New Sources in Omega Centauri by Gaia Collaboration, K. Weingrill, et. al.
- Service Interface Function explained in Gaia's Data Release 3
Animation focusing on one of the 2300 two-dimensional SIF images captured by the Gaia space telescope within the globular cluster “omega Centauri”. This particular SIF image is highlighted to show its location, then further examined in detail by panning through it. Credits: ESA/Gaia/DPAC - CC BY-SA 3.0 IGO. Acknowledgements: Based on the paper by Gaia Collaboration, K. Weingrill, et al. 2023 / Video: Stefan Jordan / Text: Katja Weingrill, Stefan Jordan / Images: Alexey Mints, Katja Weingrill / Voice: artificial voice / Visualisation: created with „Gaia Sky“, developed by Toni Sagristà.

Short GIF comparing the view of the globular cluster omega Centauri with Gaia Data Release 3 with the new published data added with Gaia Focused Product Release. Credits: ESA/Gaia/DPAC - CC BY-SA 3.0. Acknowledgements: Based on the paper by Gaia Collaboration, K. Weingrill, et al., 2023; Short created by Tineke Roegiers using screenshots of the video created by Stefan Jordan, Katja Weingrill, Alexey Mints. Also available as video.
Story written by Tineke Roegiers, Katja Janßen, Alexey Mints, Jos de Bruijne
Credit: ESA/Gaia/DPAC
Contact email: Gaia Helpdesk
Published: 10-10-2023
- Removed a total of (25) style text-align:center;
- Removed a total of (18) style text-align:justify;
More Gaia Focused Product Release stories?
COSMOLOGY:
Gaia's gravitational lens search around quasars
Solar System:
Updated astrometry for Gaia's Solar System Objects
Variability:
Gaia's extended radial velocity epoch data for Long Period Variables
Interstellar Medium:
Diffuse Interstellar Bands from Gaia's Radial Velocity Spectra
Globular Clusters:
Gaia's additional data from engineering images taken in crowded regions
-
ESA's press release for Gaia's Focused Product Release
-
- Removed a total of (15) style text-align:center;
- Removed a total of (1) style float:right;