
 Sign in
Radial velocity time series for LPVs - Gaia
Gaia Focused Product Release
Radial velocity time series for long period variables
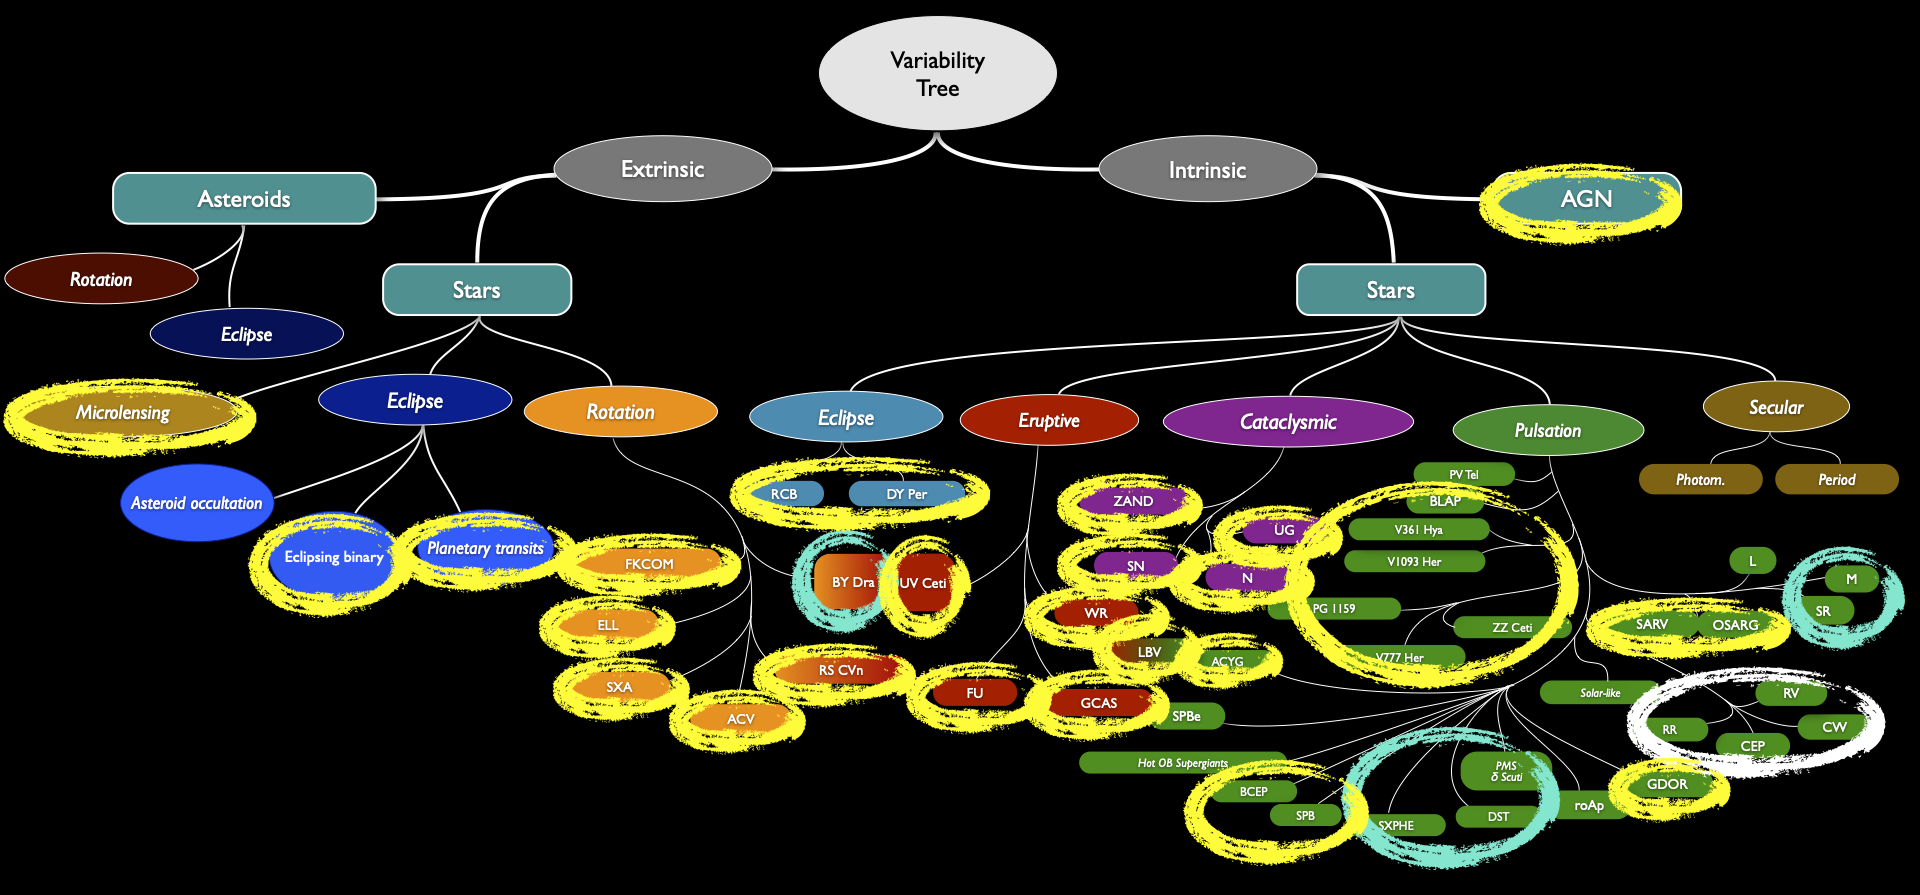
Figure 1. Sky map of 9,614 of Gaia's Long Period Variables released in Gaia's Data Release 3 for which radial velocitiy time series are now published with this Gaia Focused Product Release. Each symbol indicates the position on the sky, in Galactic coordinates, of one of the sources from this catalogue. The symbols are colour-coded according to the variability type the corresponding source has been identified with. Red symbols are Long Period Variables (LPVs) whose variability seen by Gaia is caused by stellar pulsation. Green symbols are LPVs whose variability seen by Gaia is a so-called "long secondary period", the origin of which is still debated, but is believed to be linked with a cloud of dust orbiting around the star. The blue symbols are ellipsoidal variables, red giant stars that are part of a binary system with a dense compact object, and whose shape is distorted into an egg-like shape due to tidal effects caused by the strong gravitational pull of the companion. Each source changes in luminosity in a more or less periodic fashion. Additionally, each source shows a change (with roughly the same period) in the velocity along the line of sight measured by the Gaia Radial Velocity Spectrometer. This means the stellar surface is cyclically approaching us or receding from us as the star pulsates, or that the star itself is approaching/receding as it moves throughout its orbit. The darker (lighter) the tone of the symbol, the more its velocity changes throughout its cycle. The size of the symbols reflect the same. Credit: ESA/Gaia/DPAC - CC BY-SA 3.0 IGO. Acknowledgements: Image created by Michele Trabucchi from the university of Padova (Italy) and Geneva (Switzerland), Nami Mowlavi from the university of Geneva (Switzerland) and Thomas Lebzelter from the university of Vienna (Austria).
In order to probe the structure and constituents of the Milky Way, Gaia has been scanning the sky repeatedly over the past few years since its start of science operations in July 2014. Observing the stars just once would teach us where they are and how bright they are shining at that very moment. To know at what pace a star is moving or varying, a series of observations over time is absolutely needed.
Animation of the Gaia's nominal scanning law. Gaia scans the sky continuously over its mission lifetime. This video shows the first 5 years of the Gaia mission's scanning law, assuming a nominal scanning law. While Gaia scans, more and more objects transit the Gaia field of view, as is illustrated with the colour codes on the right. The scanning law aims for a full coverage in 5 years. Interesting to note is that some objects in the sky are seen almost 250 times over 5 years. That's 50 times a year! Other objects are seen only few times. Gaia aimed to see every object on average 70 times in the course of its nominal mission lifetime of 5 years. With Gaia now firm in its misson extension, each object has been seen on average about 140 times by now. Gaia's actual commanded scanning law is available from the Gaia Data Release 3 auxiliary data set in the Gaia Archive. A similar video covering a shorter period of scanning was published in 2016 here. Credit: ESA/Gaia/DPAC - CC BY-SA 3.0 IGO. Acknowledgements: created by Berry Holl.
After three data releases starting in 2016, each time with an increased data volume and increased variety of data products, the Gaia Data Processing and Analysis Consortium (DPAC) is now preparing itself to release the full batch of its over one trillion individual observations and derived data products in the fourth data release planned not before the end of 2025. The increased complexity in the processing presents a challenge for the consortium to deliver the most valuable data to the scientific community!
The additional measurements obtained by Gaia over time allow to improve the mean values of quantities characterizing the celestial objects, such as their mean positions and motions on the sky, distances in the Galaxy, and brightness. It is indeed one of the aims of Gaia to reach outstanding precisions on these values. With Gaia’s data release 4 (DR4), in addition, the full time series will be released for all the sources Gaia scanned across, allowing the scientific community to analyse the temporal behaviour of the properties of the stars. The Gaia collaboration is intensely at work with the full processing of these data sets and the preparation to make this huge amount of data available to the community in an accessible way. But while waiting for the Gaia DR4 data products, the consortium is releasing a first glimpse of some additional products in the form of this Gaia Focused Product Release (FPR).

Figure 2. Gaia’s variability tree, showing the large variety of variable stars, split in two main groups: intrinsic and extrinsic. On this tree many variability types are highlighted with different colours. When highlighted with white, these variability types were published for the first time in Gaia’s Data Release 1. The cyan ones were added with Gaia’s Data Release 2. The many yellow types were added with Gaia’s Data Release 3. Credits = Gaia Consortium, Eyer et al. 2019; adapted from L. Eyer & N. Mowlavi (03/2009) - CC BY-SA 3.0 IGO.
With Gaia Data Release 3, the photometric time series in three bands have been published for more than ten million variable stars, but epoch radial velocities were released for short of 2,000 among which Cepheid and RR Lyrae variables. These stem from the higher-resolution spectra obtained from the radial velocity spectrometer. Now, with this Gaia Focused Product Release, this data product is extended to the Long Period Variables with the release of epoch radial velocities for close to ten thousand of them. The significance of this release becomes visible when we realize that such radial velocity time series exist in the literature to date for only a few dozen Long Period Variables.
The brightness of Long Period Variables varies by up to several magnitudes on time scales between 10 to 1,000 days. For one, this variability could be caused by pulsation, when the atmospheric layers of the star successively expand and compress over time.
Another source of variability lies in the star’s shape. Close binarity can cause one of the stars, a red giant in the case of Long Period Variables, to be deformed in an ellipsoidal shape by the gravitational force of the companion. As the distorted star orbits around the common center of gravity of the system, the asymmetry leads to the observed long period variability of the brightness.
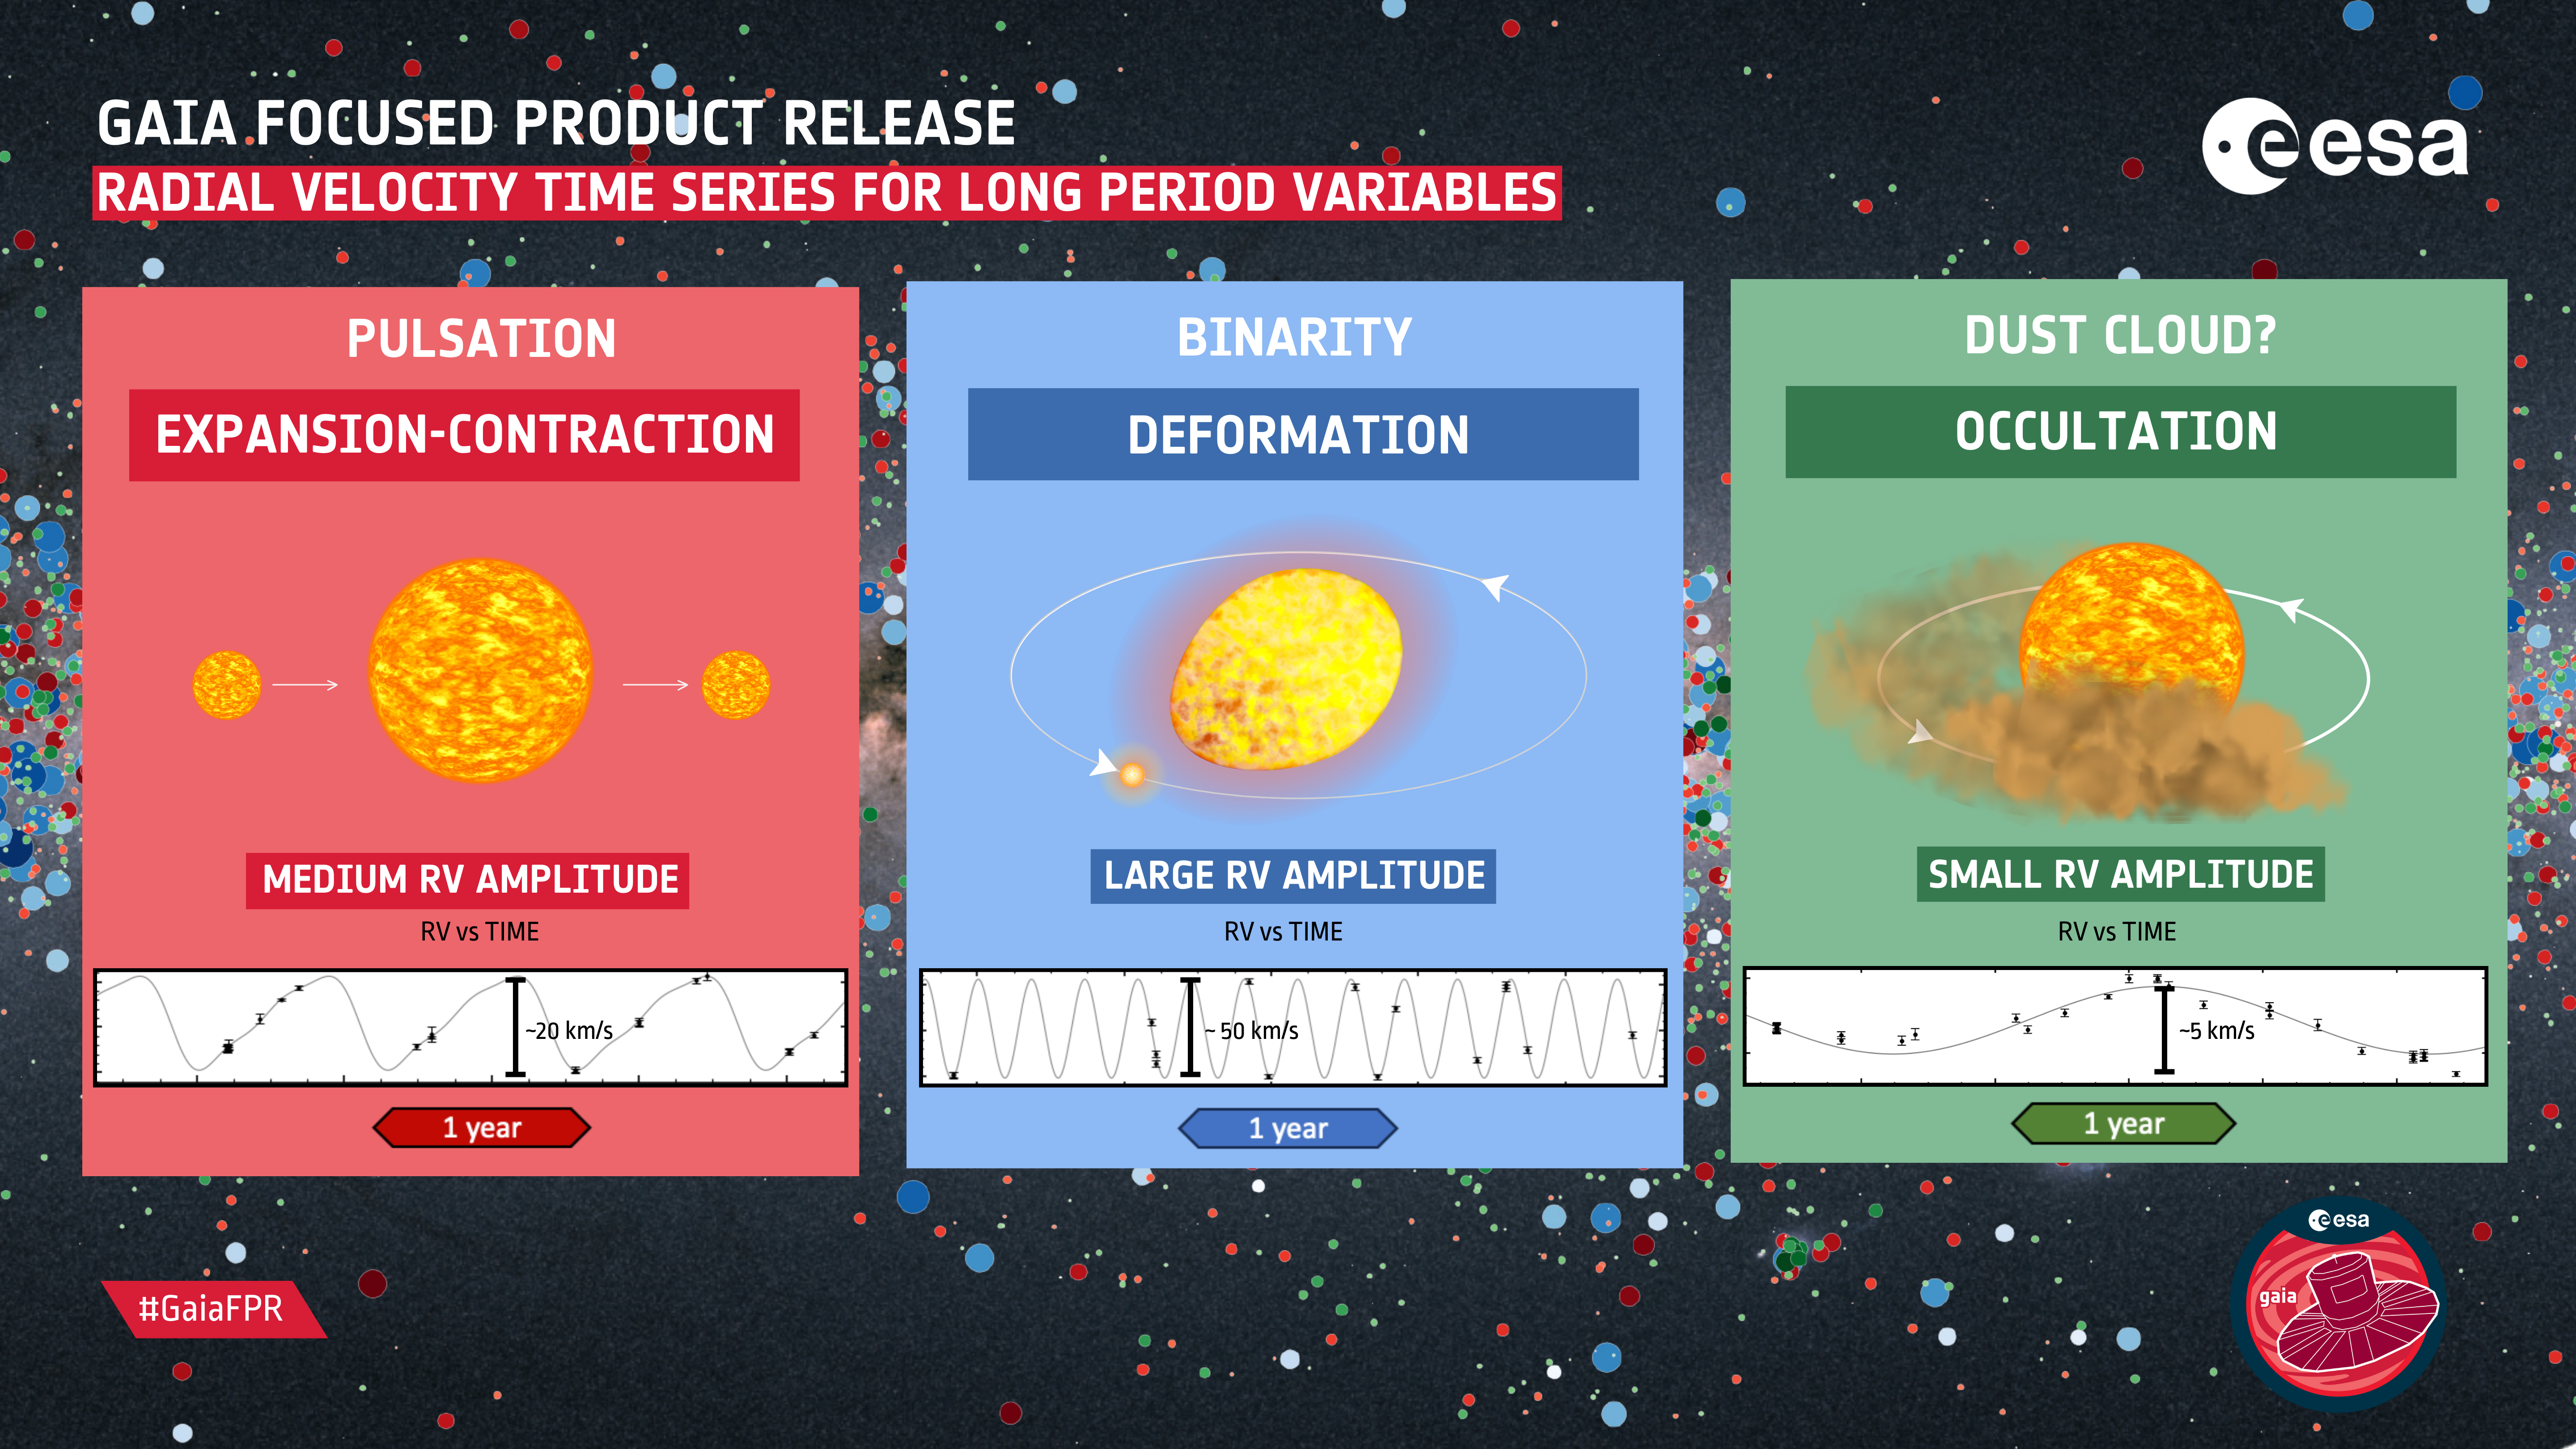
Figure 3. Infographic highlighting the contents of the Gaia Focused Product Release with respect to radial velocity time series for long period variables, as presented in the paper by Gaia Collaboration, M. Trabucchi, et al. 2023. The three panels in this infographic analyse in more detail the three types of variability and follow the same colour code as the sky map, shown as background here and in full detail in Figure 1. The brightness of Long Period Variables varies by several magnitudes on timescales ranging from 10 to 1,000 days. This variability could be caused by pulsation when the atmospheric layers of the star expand and contract over time; this example is shown in the leftmost panel. Another source of variability, illustrated in the central panel, lies in the shape of the star. Tight binary systems can cause one of the stars, a red giant in the case of long-period variables, to be deformed into an ellipsoidal shape by the gravitational force of the companion. Since the deformed star orbits around the system's common center of gravity, the asymmetry leads to the observed long-period brightness variability. However, there can be more complicated cases that give rise to such long-term variability in the star's brightness, such as the presence of a dust cloud orbiting a star in a certain way. This is one of the possible explanations for some of the so-called secondary long-period variables and is illustrated in the third and final panel. For each of these three cases, a graph representing radial velocity over time is also provided. The amplitude is a determining factor in differentiating the three cases mentioned above. Credit ESA/Gaia/DPAC - CC BY-SA 3.0 IGO. Acknowledgements: Created by Mariasole Agazzi, Tineke Roegiers, Michele Trabucchi, Nami Mowlavi, Thomas Lebzelter.
There may be more complicated cases though that give rise to such a variability in the star’s brightness over a long period, such as the presence of a cloud of dust orbiting a star in a certain way. This is one of the possible explanations for some of the so-called Long Secondary Period variables.
In all these cases the power of Gaia resides in the capability to obtain simultaneous photometric and spectroscopic observations. From these, brightness, colour and radial velocity can be derived for each epoch. “The combined analysis of these data cubes provides key clues to identify the origin of the variability of each Long Period Variable.” says Thomas Lebzelter of the Vienna University and member of the core team responsible for the Long Period Variable data products published in the Gaia Data Releases.
From the 9,614 Long-Period Variable candidates in the data set delivered in this Gaia FPR, about 6,000 of them show a full compatibility when comparing the period derived from the radial velocity time series with the periods derived from the G, GBP, and GRP photometric time series. It is truly the most top-quality data set for Long Period Variables out there.
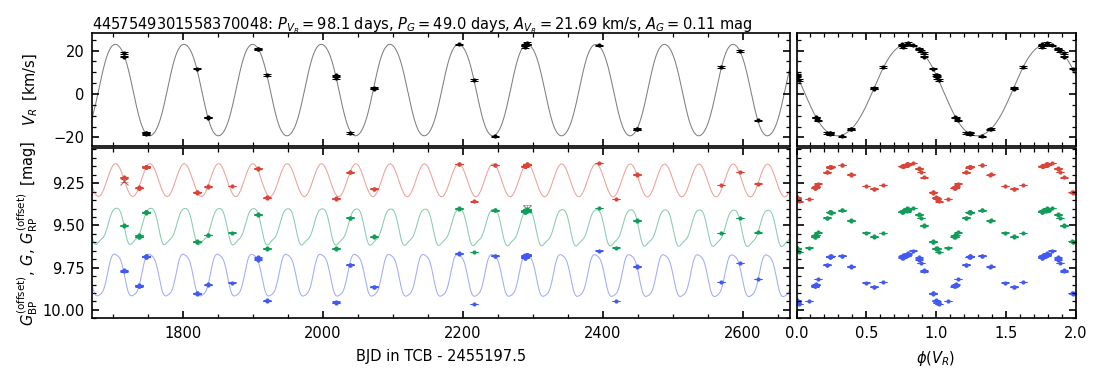
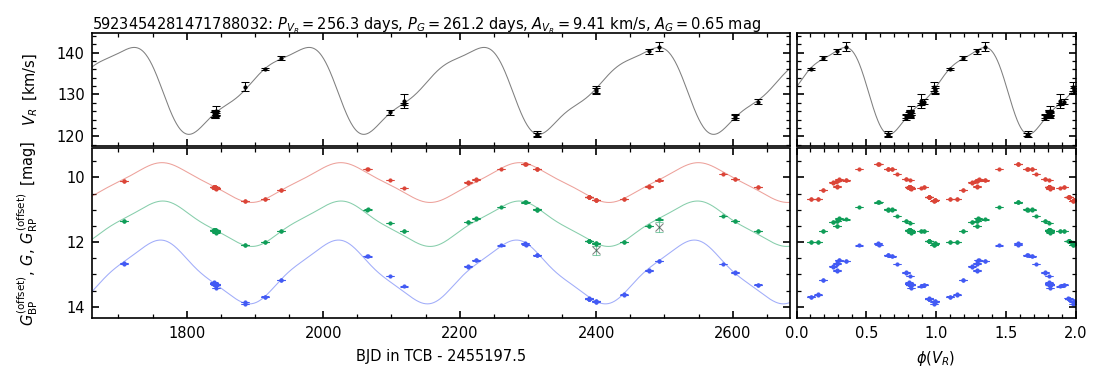
Figure 4. Here time series in G, GBP, GRP and the radial velocity are shown for both a pulsating star (bottom) and an ellipsoidal variable (top). The same variability is seen in all four time series for each of the cases. Credit: Gaia Focused Product Release: Radial velocity time series of long-period variables by Gaia Collaboration, M. Trabucchi , et al.
“A survey like Gaia which is an all-sky survey and observes over such a long lifetime brings a truly unique data set for Long Period Variables! With this Gaia FPR, we extend the number of these variables having radial velocity time series from a few dozen currently available in the literature to almost 10,000. This is a really big increase.” says Nami Mowlavi of the Geneva University and also a member and main coordinator of the core team responsible for these Long Period Variables within the Gaia Consortium.
Gaia has observed thousands of pulsating cool giant stars. Since launch in 2013, Gaia has repeatedly observed these variable stars. Red giants are about ten to hundreds of times larger than the Sun, while their outer envelope is lower in temperature giving them a yellowish-orange hue. They have luminosities up to nearly three thousand times that of the Sun, with spectral types of K or M, and surface temperatures of 2700 to 3700 degrees Celsius. The outer layers of these large red stars continuously expand and contract over long periods of time, from about a hundred to 400 days. The red giant star Mira is considered the prototype of the long period variables. The atmospheric pulsations cause the periodical brightness variability observed by Gaia. But Gaia also observes the spectrum from which the envelope expansion and contraction velocities are measured. The dark spectral lines move back and forth, changing their wavelength positions due to the Doppler effect. The spectral line shifts are proportional to the velocities with which the envelope contracts and expands in our line-of-sight to the red giant. The Gaia Data Archive offers the largest sample of velocity and brightness curves of Mira variables observed to date. A technical version of this video can be found here. Credit: ESA/Gaia/DPAC. Acknowledgements: Alex Lobel, Royal Observatory of Belgium, Brussels.
The few dozen sources that do have radial velocity time series published in the literature consist of either bright, and hence relatively close sources, or faint ones typically from sources lying in external galaxies. The Gaia dataset provided in this Focused Product Release, in addition to extending the number of bright LPVs having such data, also fills, for the first time, the middle magnitude range for which there is currently little data.
About 1,100 of them are candidate ellipsoidal variables. These represent a sample of sufficient size to allow some statistical analysis of their properties in the framework of binary system characterization and evolution. Some of them were already identified in the Gaia Catalogue of Non-Single Stars published in Gaia Data Release 3, thus confirming their binary nature. Most of the other ones are brand new ellipsoidal variable candidates. The additional data expected for Gaia Data Release 4 and their even higher precisions will allow both a confirmation of these candidates and an extension of the number of such identifications.
Disentangling true pulsation long-period variables from these candidate ellipsoidal variables is important to obtain clean, high-quality samples of pulsating stars. The information obtained for this Gaia Focused Product Release is used to improve the ongoing data processing for Gaia’s Data Release 4, with hopes to further improve the variability classifications.
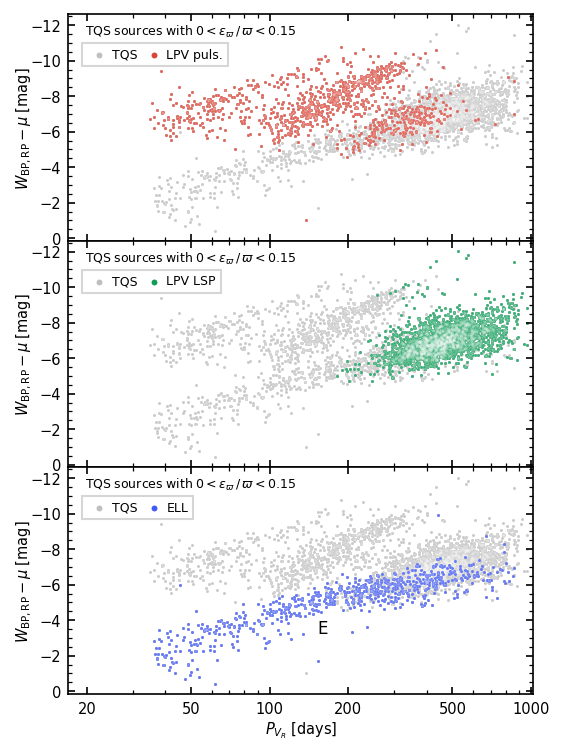
Figure 5. This image shows the so-called period-luminosity diagram, illustrating the fact that, for many types of variable stars, the brighter they are, the longer the period of their variability is. This property is called period-luminosity relation. In this figure, the intrinsic brightness of the stars, corrected for their different distances to us, is obtained using the parallaxes measured by Gaia. Each of the three panels shows a different type of variable star among a top-quality sample (TQS) of the long period variables (LPVs) published in this Gaia Focused Product Release: the pulsating LPVs (red), the LPVs whose variability is caused by a long secondary period (green), and the ellipsoidal variables (blue). Each sequence is a period-luminosity relation. Each type of variable follows its own relation, except the pulsating stars that can follow more than one such relation. Indeed, they can oscillate in distinct "pulsation modes", like a musical instrument playing different notes. Credit: Gaia Focused Product Release: Radial velocity time series of long-period variables by Gaia Collaboration, M. Trabucchi , et al.
“A good clean sample of Long-Period Variables can provide a data set for studies on the distance ladder.” concludes Michele Trabucchi of the Padova University and coordinating author of the paper describing the Gaia FPR results for Long Period Variables. “Usually, these studies are done with Cepheids, but in principle all kinds of variables showing a clear relation between period and luminosity can be used for this task. A good quality sample of true pulsating Long Period Variables likely fulfills this criterion. The investigation might be a bit more tricky, but when done, there are many advantages over Cepheids. Long-Period Variables are much more numerous and, in the infrared range, they are among the brightest objects in any galaxy, hence would allow to reach larger distances.”
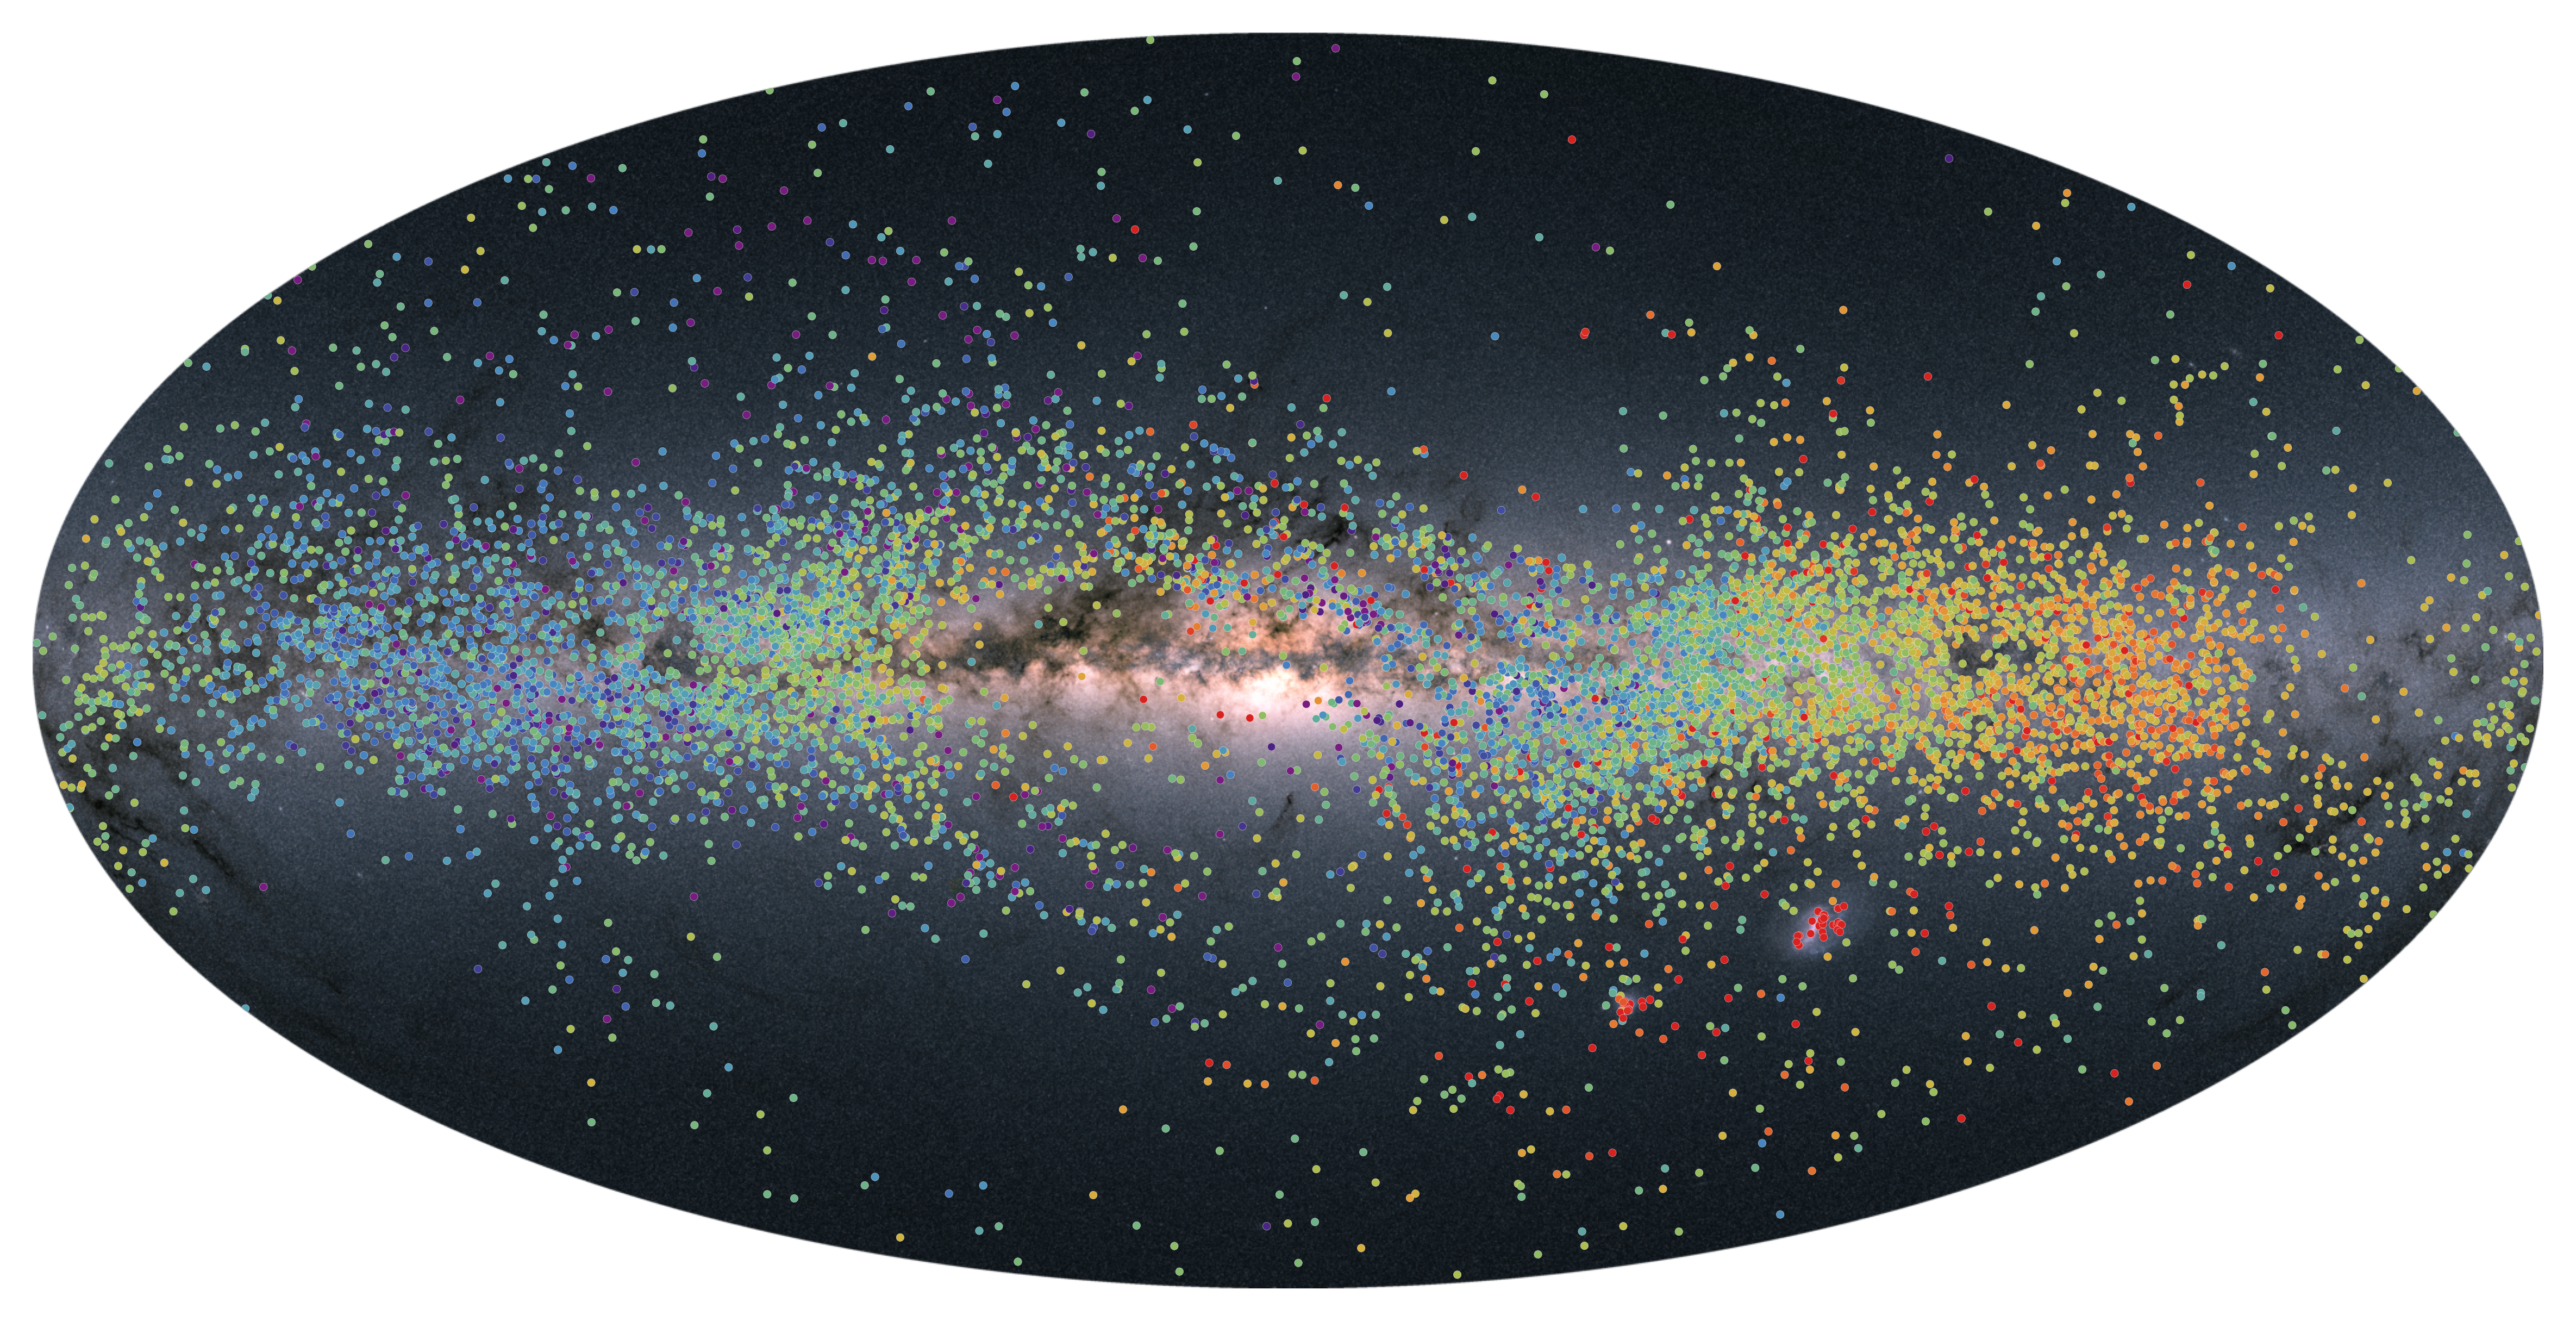
Figure 6. Sky map of 9,614 of Gaia's Long Period Variables released in Gaia's Data Release 3 for which radial velocitiy time series are now published with this Gaia Focused Product Release. Each symbol indicates the position on the sky, in Galactic coordinates, of one of the sources from the catalogue. The sources are colour-coded by the median value of their radial velocity (the velocity by which the star moves towards us or away from us along the line of sight) as measured by the Gaia Radial Velocity Spectrometer. Green symbols are stars that move slowly or not at all with respect to us. Yellow-red symbols are stars moving away from us (the redder the symbol, the faster they are). Blue-purple symbols are moving towards us (the darker, the faster). The Galactic rotation is clearly visible in this sample. Credit: ESA/Gaia/DPAC - CC BY-SA 3.0 IGO. Acknowledgements: Image created by Michele Trabucchi from the university of Padova (Italy) and Geneva (Switzerland), Nami Mowlavi from the university of Geneva (Switzerland) and Thomas Lebzelter from the university of Vienna (Austria).
Explore this interactive application for the long period variables
Further reading
Story written by Tineke Roegiers, Michele Trabucchi, Nami Mowlavi and Thomas Lebzelter
Credit: ESA/Gaia/DPAC
Contact email: Gaia Helpdesk
Published 10-10-2023
- Removed a total of (24) style text-align:center;
- Removed a total of (28) style text-align:justify;
More Gaia Focused Product Release stories?
COSMOLOGY:
Gaia's gravitational lens search around quasars
Solar System:
Updated astrometry for Gaia's Solar System Objects
Variability:
Gaia's extended radial velocity epoch data for Long Period Variables
Interstellar Medium:
Diffuse Interstellar Bands from Gaia's Radial Velocity Spectra
Globular Clusters:
Gaia's additional data from engineering images taken in crowded regions
-
ESA's press release for Gaia's Focused Product Release
-
- Removed a total of (15) style text-align:center;
- Removed a total of (1) style float:right;