



























 Sign in
 Science & Technology
Stories - Gaia
Image of the Week
61 Cygni marks the end of Gaia's science observation phase
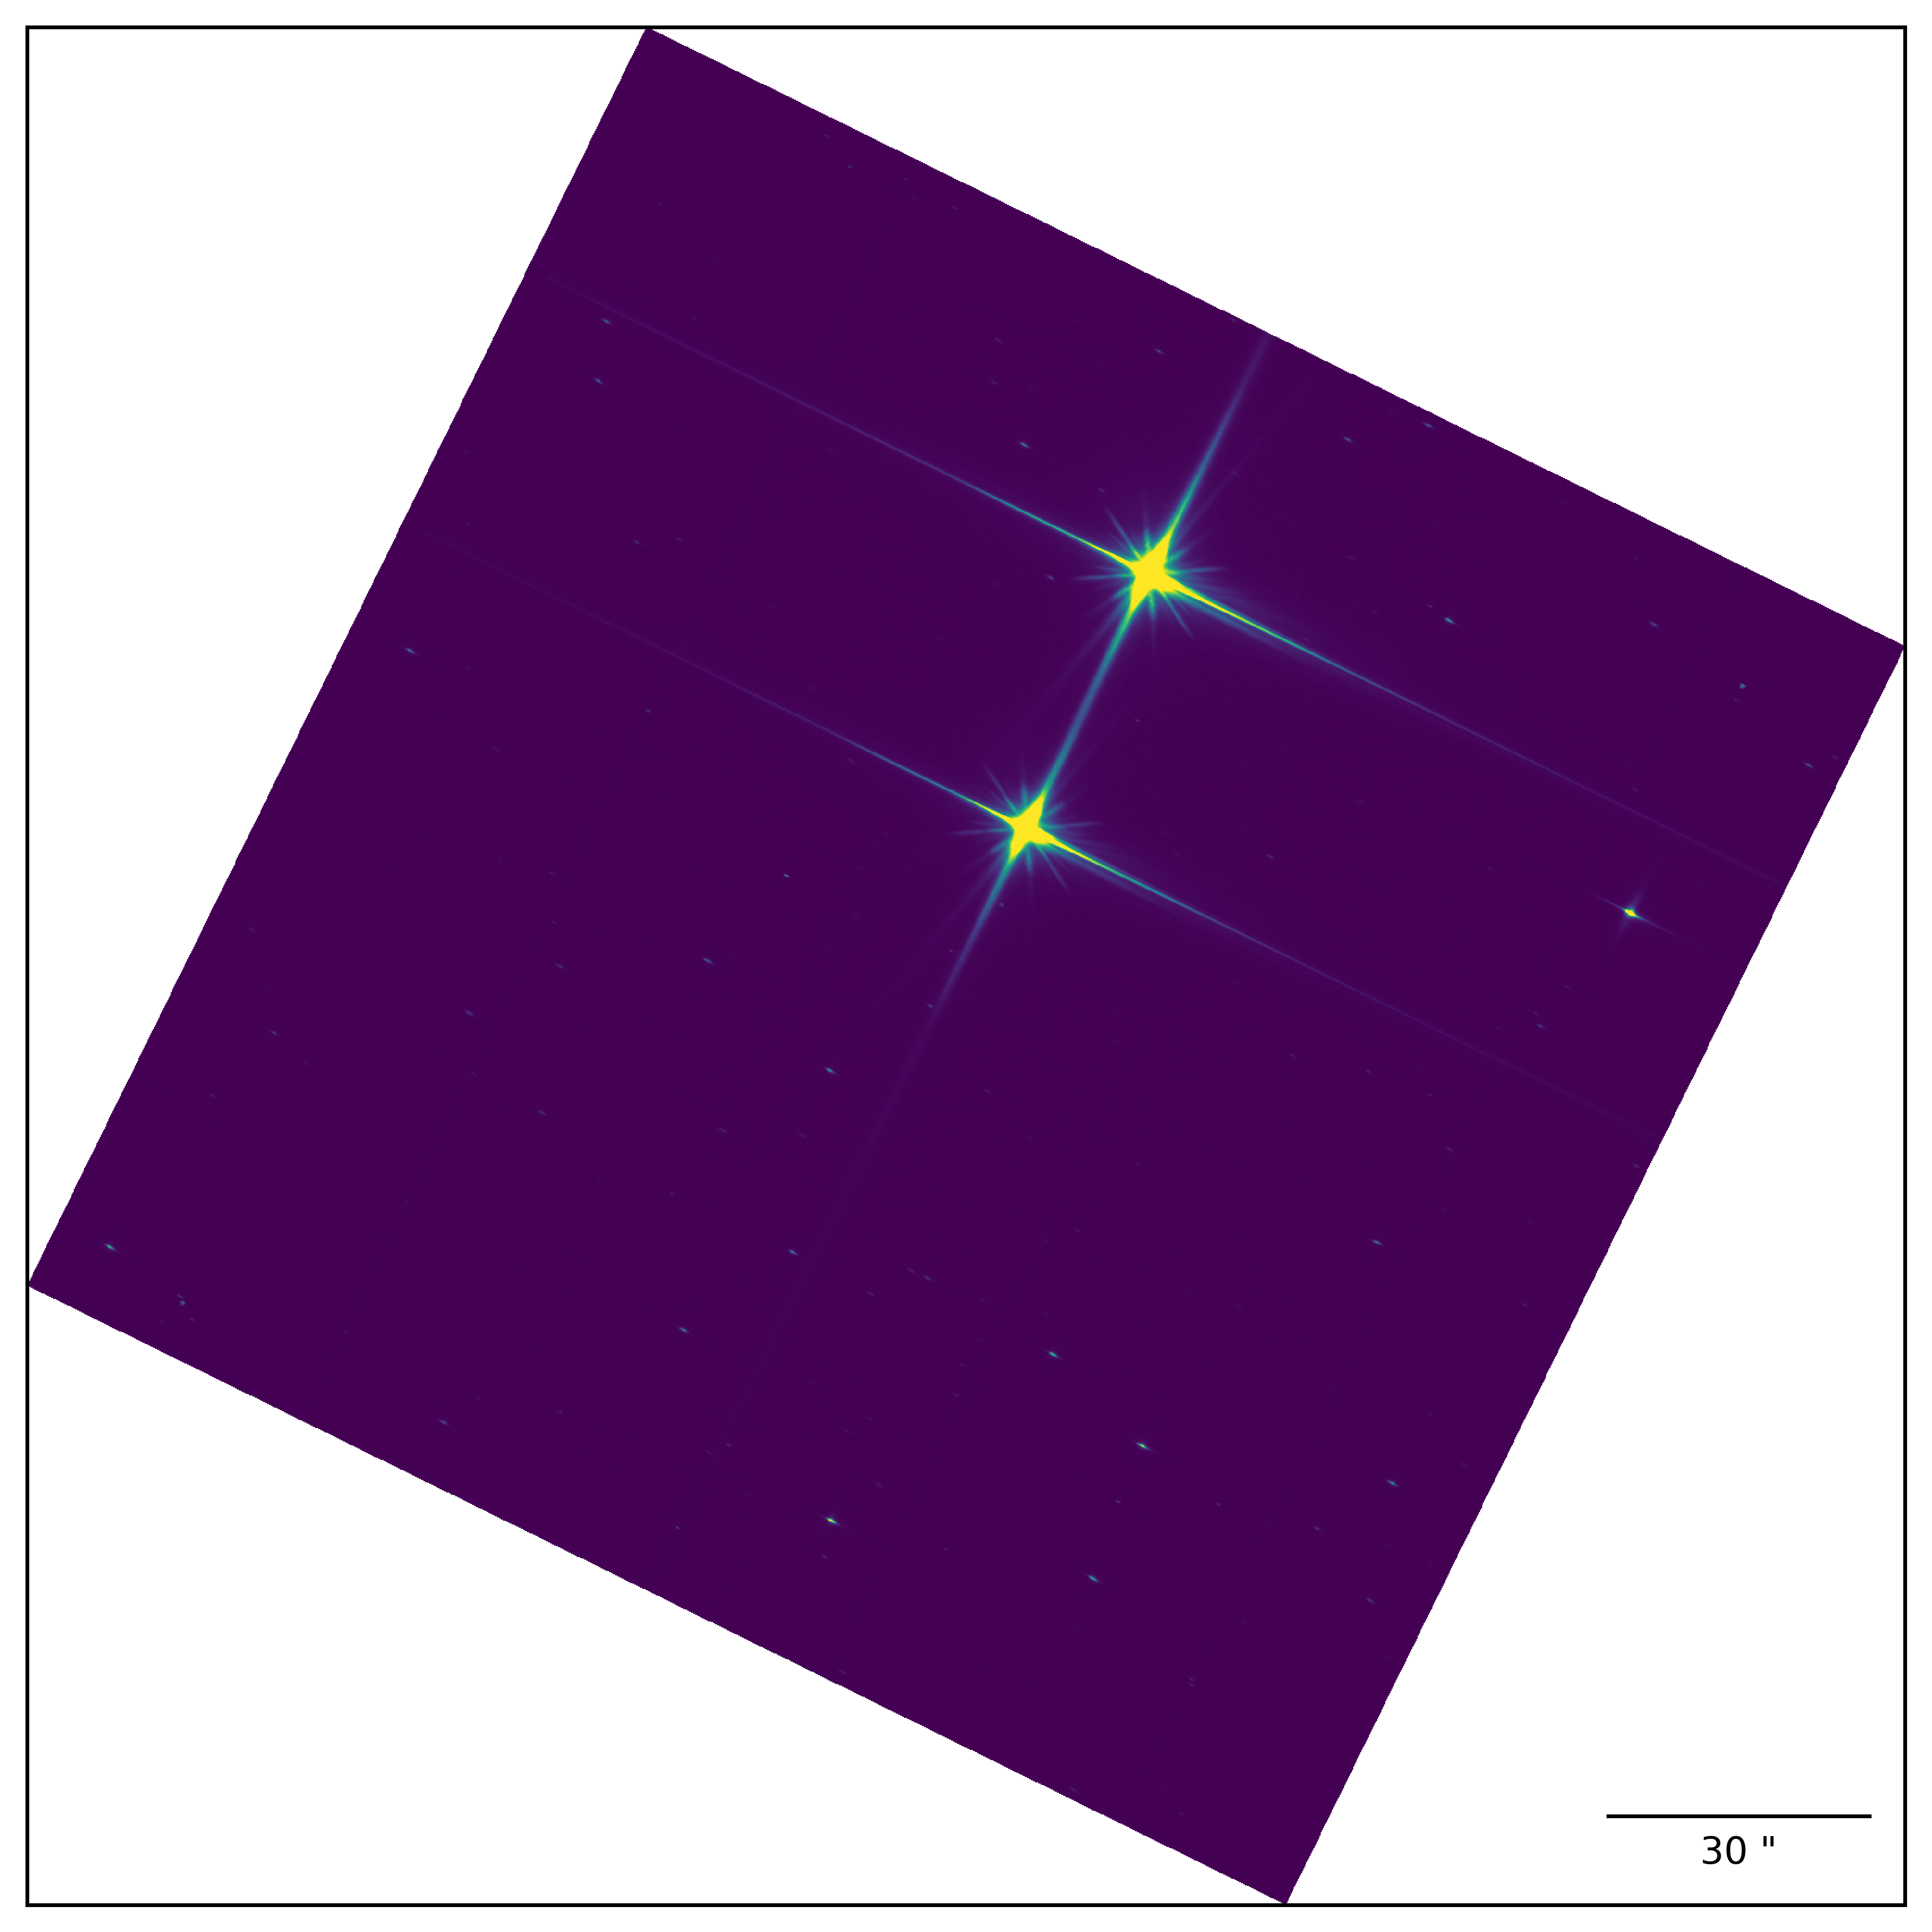
Figure 1. This calibration image is Gaia's final view of 61 Cygni. It was taken on 10 January 2025, mere days before Gaia's end of science observations. North is up and East is left in this image whose scale is indicated at the bottom right. The brightest component 61 Cygni A is seen North of its companion 61 Cygni B according to the relative orbit shown in Figure 5. A few background stars are visible as well. The false-colour scheme used here relates to intensity only. Like previous calibration images these data were acquired using a special Gaia function that is also used for crowded regions. Credits: ESA/Gaia/DPAC - CC BY-SA 3.0 IGO.
Gaia's observation programme came to an end today, on 15 January 2025, after ten and a half years of regular sky scanning, netting all the way more than 2600 billion astrometric CCD observations. The measurement of the parallaxes of at least one billion stars was one of the major objectives of the mission at selection time. The results so far published in Gaia's second and third data release amply confirm the success in fulfilling this ambitious promise.
Among the iconic stars in the Gaia harvest, the most symbolic regarding the core of the mission is 61 Cygni whose distance was the first ever measured in 1838 thanks to the perseverance and skills of F. W. Bessel. It happens that this was also the last iconic star observed in the Gaia programme, just a couple of days before the science observations were terminated. This is a good opportunity to recall the great achievement of Bessel and to show the unprecedented leap brought in this field by ESA's space astrometry missions: Hipparcos and Gaia.
The special Gaia function was activated during the recent passages of 61 Cygni to acquire the image in Figure 1 and to pay tribute to all who spent time at the eyepiece of a telescope or a measuring machine to probe the depth of the starry world. They paved the way to Hipparcos and Gaia.
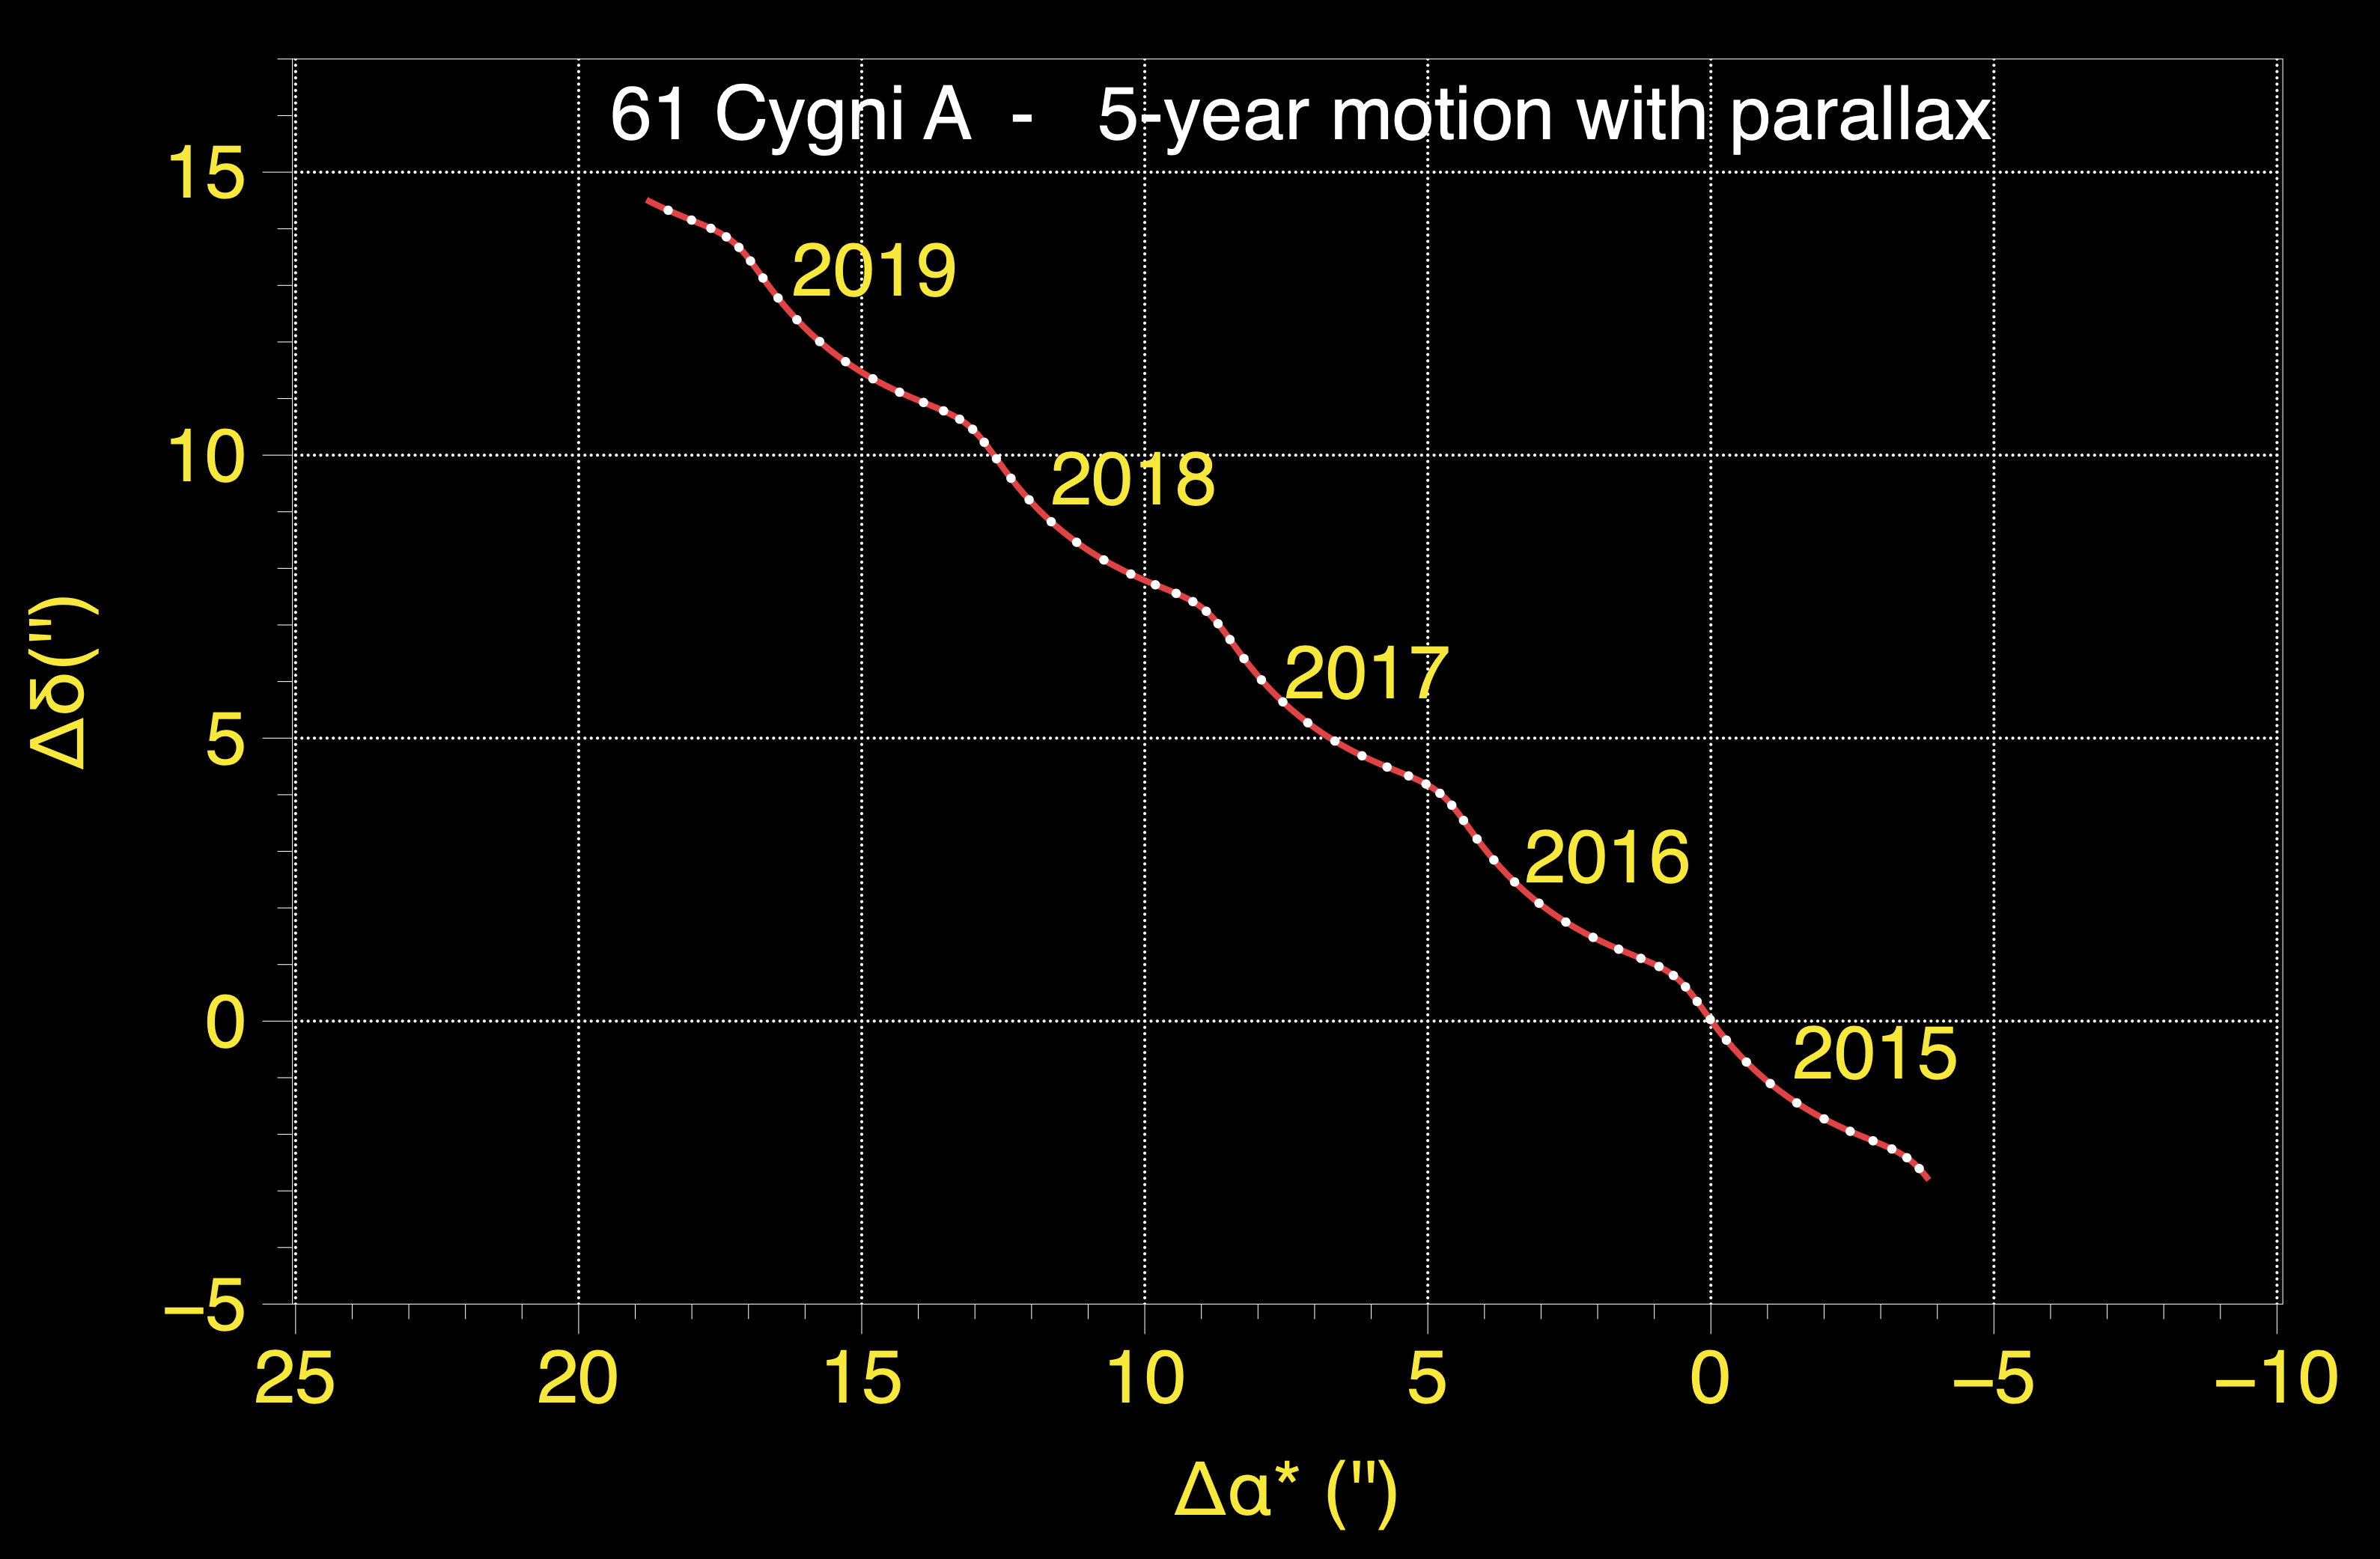
Figure 2. Apparent displacement of 61 Cygni on the plane of the sky over a few years during Gaia operations. The general trend comes from the proper motion (about 5.2"/yr) whereas the wavy feature is the annual parallactic swing. Dots mark the monthly positions. Credits: ESA/Gaia/DPAC - CC BY-SA 3.0 IGO. Acknowledgement: François Mignard.
The parallax of 61 Cygni from Bessel to Gaia
In a delightful little monograph entitled 'The Famous Stars' published in 1950, the Scottish-born astronomer William Marshall Smart explores the fundamentals of astronomy by selecting, on various grounds, six remarkable stars to guide his steps. Guess which came first: 61 Cygni, the `Flying Star`. As Smart was a distinguished astrometrist of his own, who authored a successful textbook on the matter, it comes as no surprise that he gave this star an outstanding status in his selection.
In 1804 the Italian astronomer G. Piazzi, the discoverer of Ceres, was the first to notice the surprisingly large annual motion (the largest known at that time) of the 5th-magnitude star known as 61 Cygni in Flamsteed designation, hence the nickname of `Flying Star`. It travels with an annual displacement of 5.4" (arcseconds) relative to the neighbouring stars (see Figures 2 and 3), a very high speed for a star. Piazzi pointed out that this would make 61 Cygni particularly suitable for parallax measurement, from the plausible link between apparent speed and proximity.
This discovery also opened up a breach into a general paradigm that the brightest stars should be also the nearest, with first magnitude stars nearer than stars of second magnitude, etc., whereas 61 Cygni was barely visible to the unaided eye and that there were nearly three thousand stars brighter. This fact was quickly seized upon by F.W. Bessel who gave in 1812 his first thoughts on the parallax issue and commented on the duplicity of 61 Cygni in this respect.
He was not alone in this pursuit and as early as 1812, F. Arago and C.L. Mathieu undertook zenith distance measurements over six months to detect the parallax in declination, which came out at 0.55". But their report is too scanty in the 'Annuaire du Bureau des Longitudes' for the year 1834, without details and no assessment of its merit, let alone the unaccounted delay of more than 20 years between the measurements and the published result. Very surprising for a matter of this importance as though they lacked confidence in their result. Scientifically this episode had little value and would be quickly forgotten.
W.F. Bessel was the first to seriously set up a plan for repeated observations of 61 Cygni in order to assess its distance. He decided on this star for several reasons, where the large proper motion came first to support the small distance. Then from Königsberg, in Northern Germany, the star is observable almost year round given its declination. As a well separated double star Bessel saw this feature as an advantage for the precise sighting: using a heliometer he had to put in coincidence the comparison star and the image of 61 Cygni with the motion of a screw to move half of the front lens. He claimed that this would be more accurate by using the mid point between 61 Cygni A and B instead of matching one of the component image. Hence his measurement is neither A nor B, but something closer to the centre of mass, considering these two stars were physically connected. No orbital displacement had been detected yet but sharing so large a proper motion left little doubt about the true nature of the pair.
The Königsberg observatory was equipped with a heliometer designed by J. Fraunhofer and built in his workshop. In the expert hands of Bessel this proved a well adapted instrument to his task, although difficult to use. Bessel selected two reference stars, hereafter referred to as stars Sa and Sb, faint enough to assume they lay much farther than 61 Cygni and then had negligible parallaxes. Although the campaign of observations commenced for real in 1837, Bessel started in 1834 by selecting two faint reference stars close to 61 Cygni. After few trials though, they proved too faint for the prevailing atmospheric conditions in Koenigsberg. Then he was engaged in geodetic work in Berlin and Halley's comet passage of 1835 kept him busy. The following year it was the measurement of the degree of meridian in his country, the Kingdom of Prussia, and the publication of the final report that kept him away from working on 61 Cygni. This delayed the observations to the summer of 1837.
Bessel measured the distances to Sa and Sb as often as possible between August 1837 and October 1838 for the first series and then to July 1839 and even March 1840 with an assistant named Sluter. The first series included 85 distances to Sa and 98 to Sb and with a least squares processing Bessel obtained three results:
- the parallax of the system 61 Cygni relative to Sa as 0.369" and probable error of 0.019" (equivalent to standard error of 0.028")
- the parallax of the system 61 Cygni relative to Sb as 0.260" and probable error of 0.019"
- a combined solution assuming the parallaxes of Sa and Sb were not much different lead to the parallax of the system 61 Cygni as 0.314" with a probable error of 0.014" (standard error of 0.02").
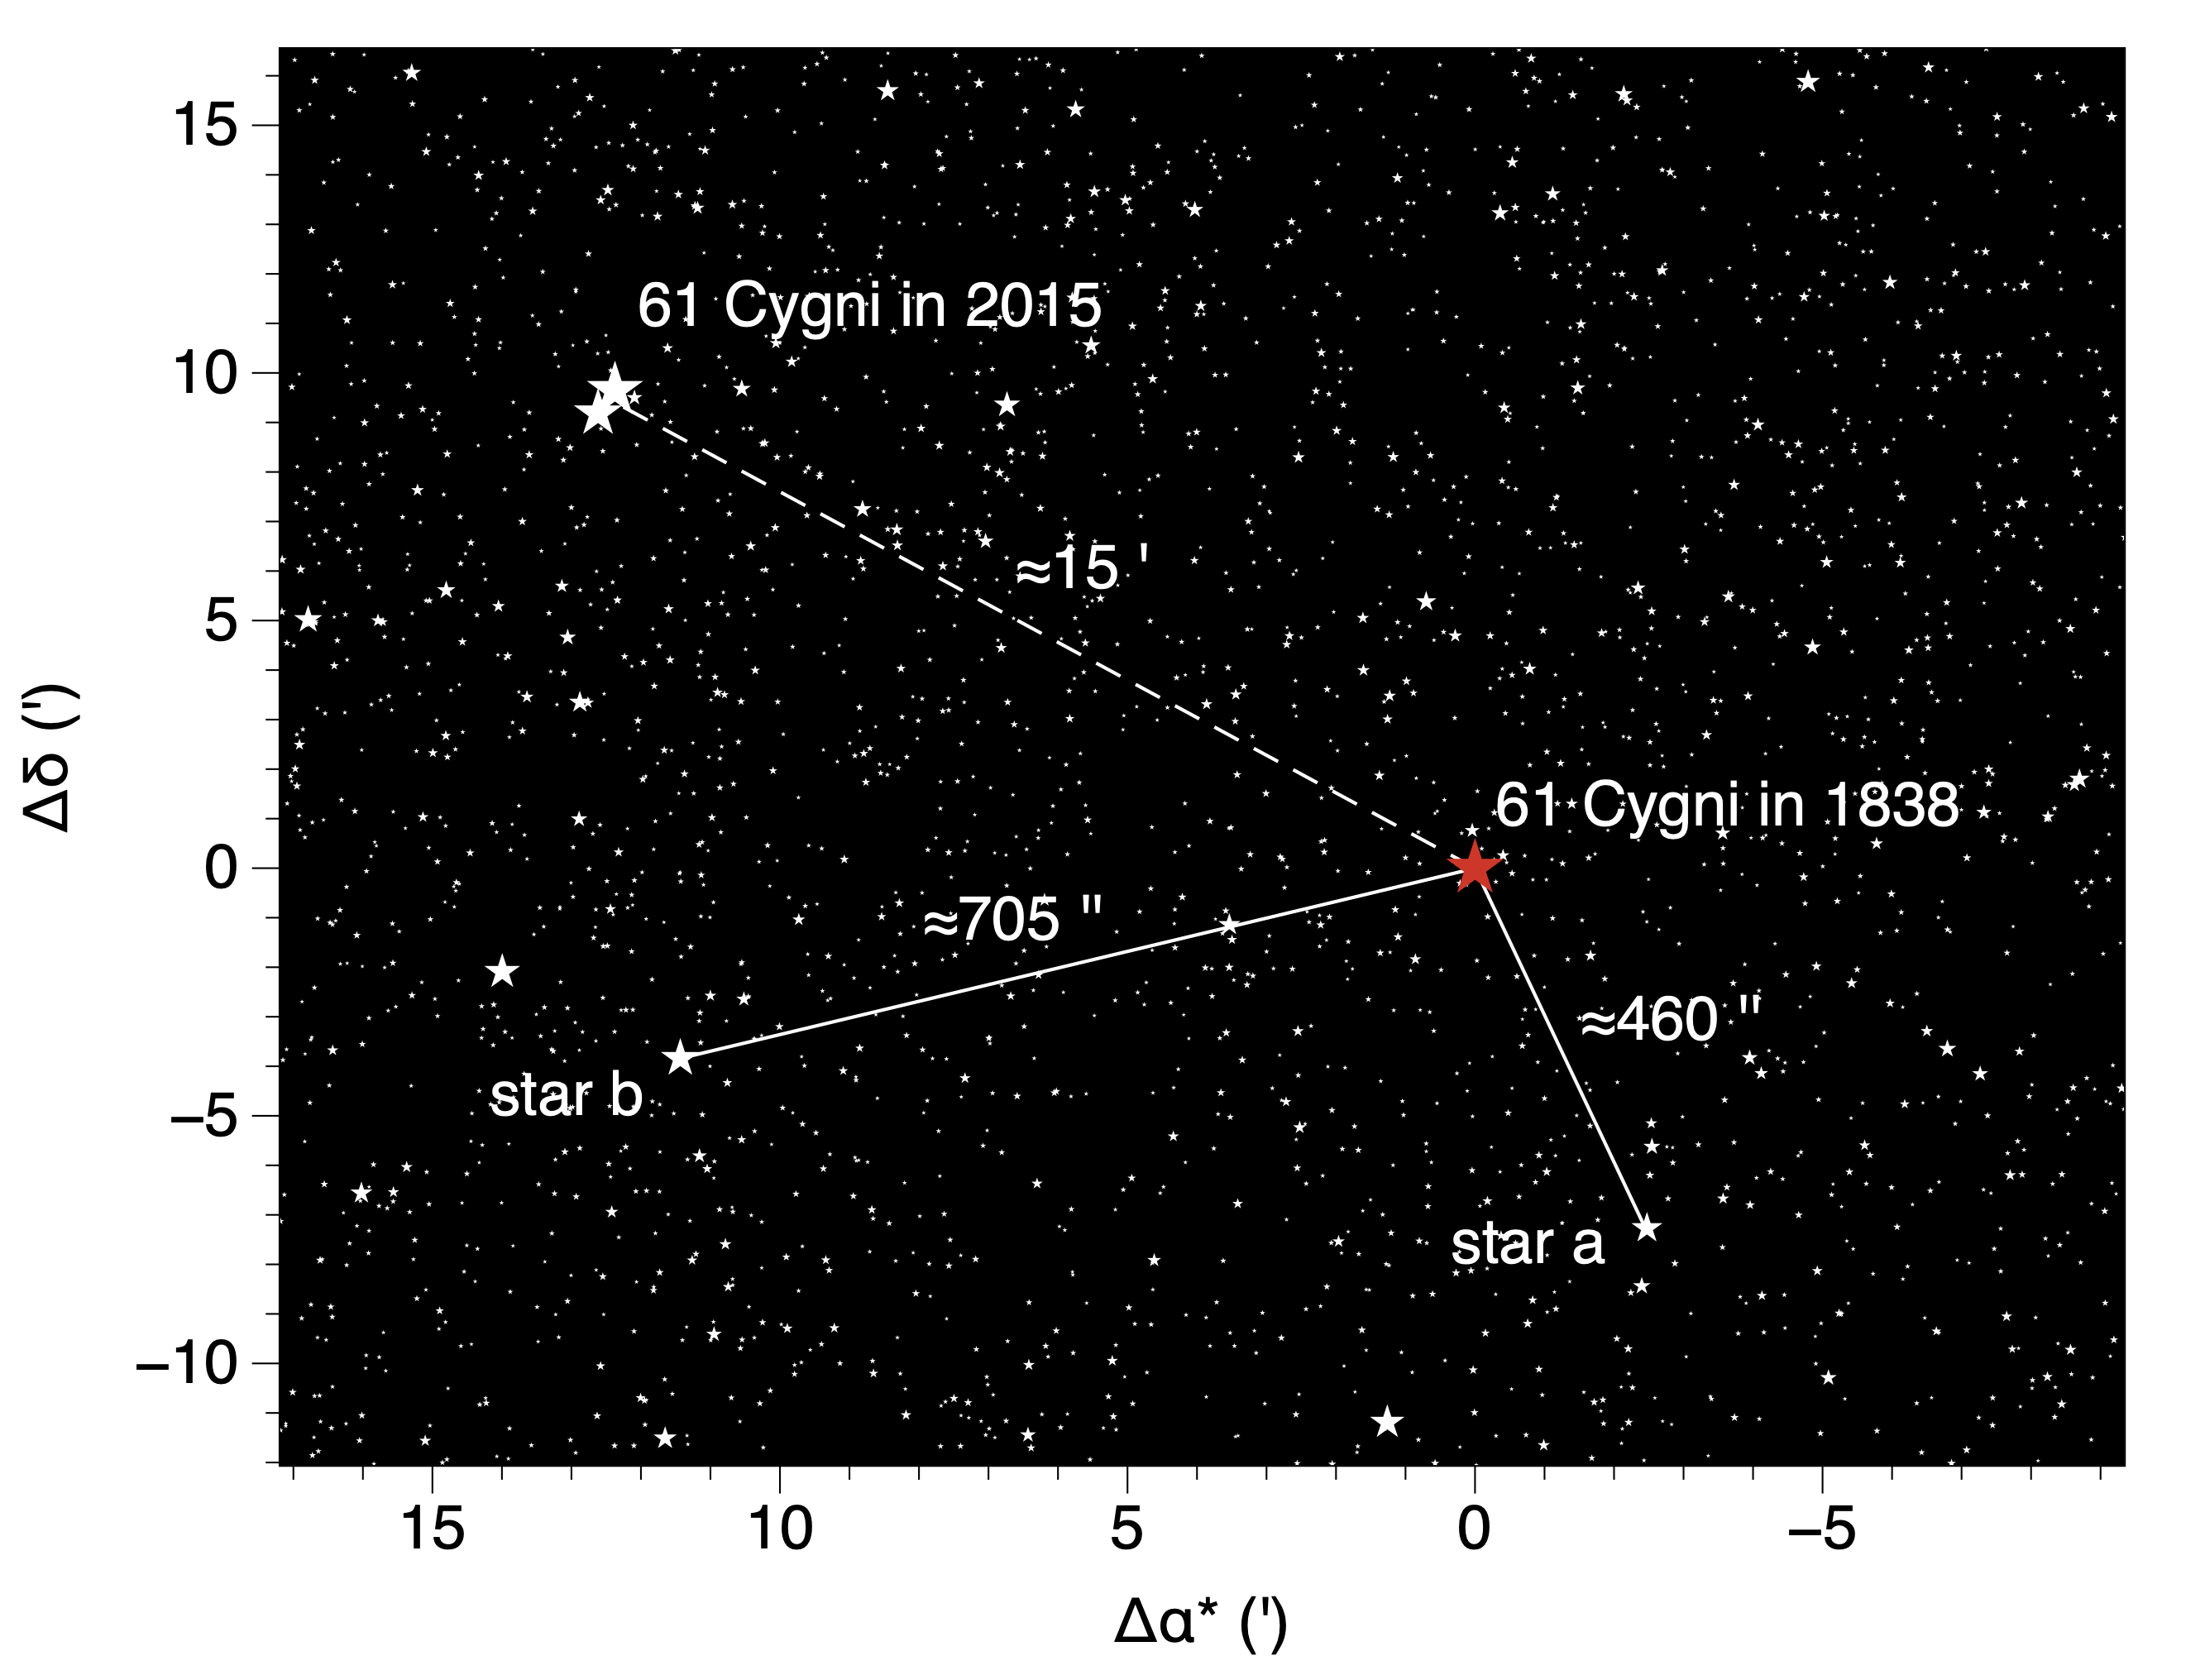
Figure 3. The 61 Cygni system relative to the two reference distant stars Sa and Sb plotted with stars from the Gaia DR3 catalogue brighther than G=17. The red star shows the position of 61 Cygni in 1838, about 15 arcminutes away from its current position due to its large proper motion. Bessel measured repeatedly the distances between the mid-point of components A and B of 61 Cygni to star Sa and star Sb from 1838 to 1840. Credits: ESA/Gaia/DPAC - CC BY-SA 3.0 IGO. Acknowledgement: François Mignard.
These results appeared in an epoch-making paper in the volume 365 of the Astronomische Nachrichten 'Bestimmung der Entfernung des 61sten Sterns des Schwans'. The fame of the author, the clarity of the exposition, the regular sampling, and the behaviour of the residuals with respect to the theory contributed widely to the immediate acceptance of Bessel's result. No serious astronomer doubted that the parallax of 61 Cygni was sensible and ascertained by Bessel. A letter to J. Herschel, who spoke German as first language, was translated and published in MNRAS in 1838 ("to you I can write in my own language and thus secure my meaning from indistinctness") and Bessel was awarded the Gold Medal of the Royal Astronomical Society for 1841.
Regarding the assumption that Sa and Sb had negligible parallaxes, this was definitely established with Gaia's Data Release 2 with a parallax_a of 2.397±0.027 milli-arcseconds (mas) and parallax_b = 1.952±0.028 mas, although spectroscopic distances of about 400 pc had been available for decades. The two stars are sufficiently far away for Bessel but not infinitely far if they were used as reference with Gaia accuracy. The complete solution with about twice as many measurements until 1840 confirmed the first result with the combined solution giving a parallax of 0.348" and probable error of 0.01", that is to say a 2-sigma difference between the two combined solutions. Today we know with Gaia and Hipparcos with sub-mas accuracy that the parallax is rather 0.2860".
The race to the parallaxes was launched and many attempts would follow by visual means, with programmes in Europe and the USA. At the end of the century the photographic method would take over and become the standard method until the ESA Hipparcos mission changed the rules of the game.
Interestingly, 61 Cygni is the star with the most numerous determinations, either absolute or differential like Bessel's. Every programme in the northern hemisphere included 61 Cygni, first because this had become a famous target, but also because it had the most reliable distance, a fact very useful to calibrate or qualify a new set of measurements: recovering Bessel parallax was a factor of trust for the other stars of your program!
Focussing only on that star, the next fifty years did not produce a nice cloud of points around Bessel value, but a rather large scatter of more or less compatible values, see Figure 4. In 1899, Ch. André adopted the value 0.44" as the most probable, while S. Newcomb in his semi-popular book 'The Stars' recommended 0.39" in 1901. Only when the photographic methods became the normal technique did the solutions cluster around 0.290" with an uncertainty below 0.01". Curiously the most accurate result at that time, at least judged from the published formal uncertainty, is due to F.L Chase, an assistant astronomer at Yale. His work of 1907 was carried out anew with a heliometer and yielded a parallax of 0.291" ± 0.005", in remarkable agreement with Hipparcos and Gaia values. This was the last parallax determination using a similar technique as Bessel.
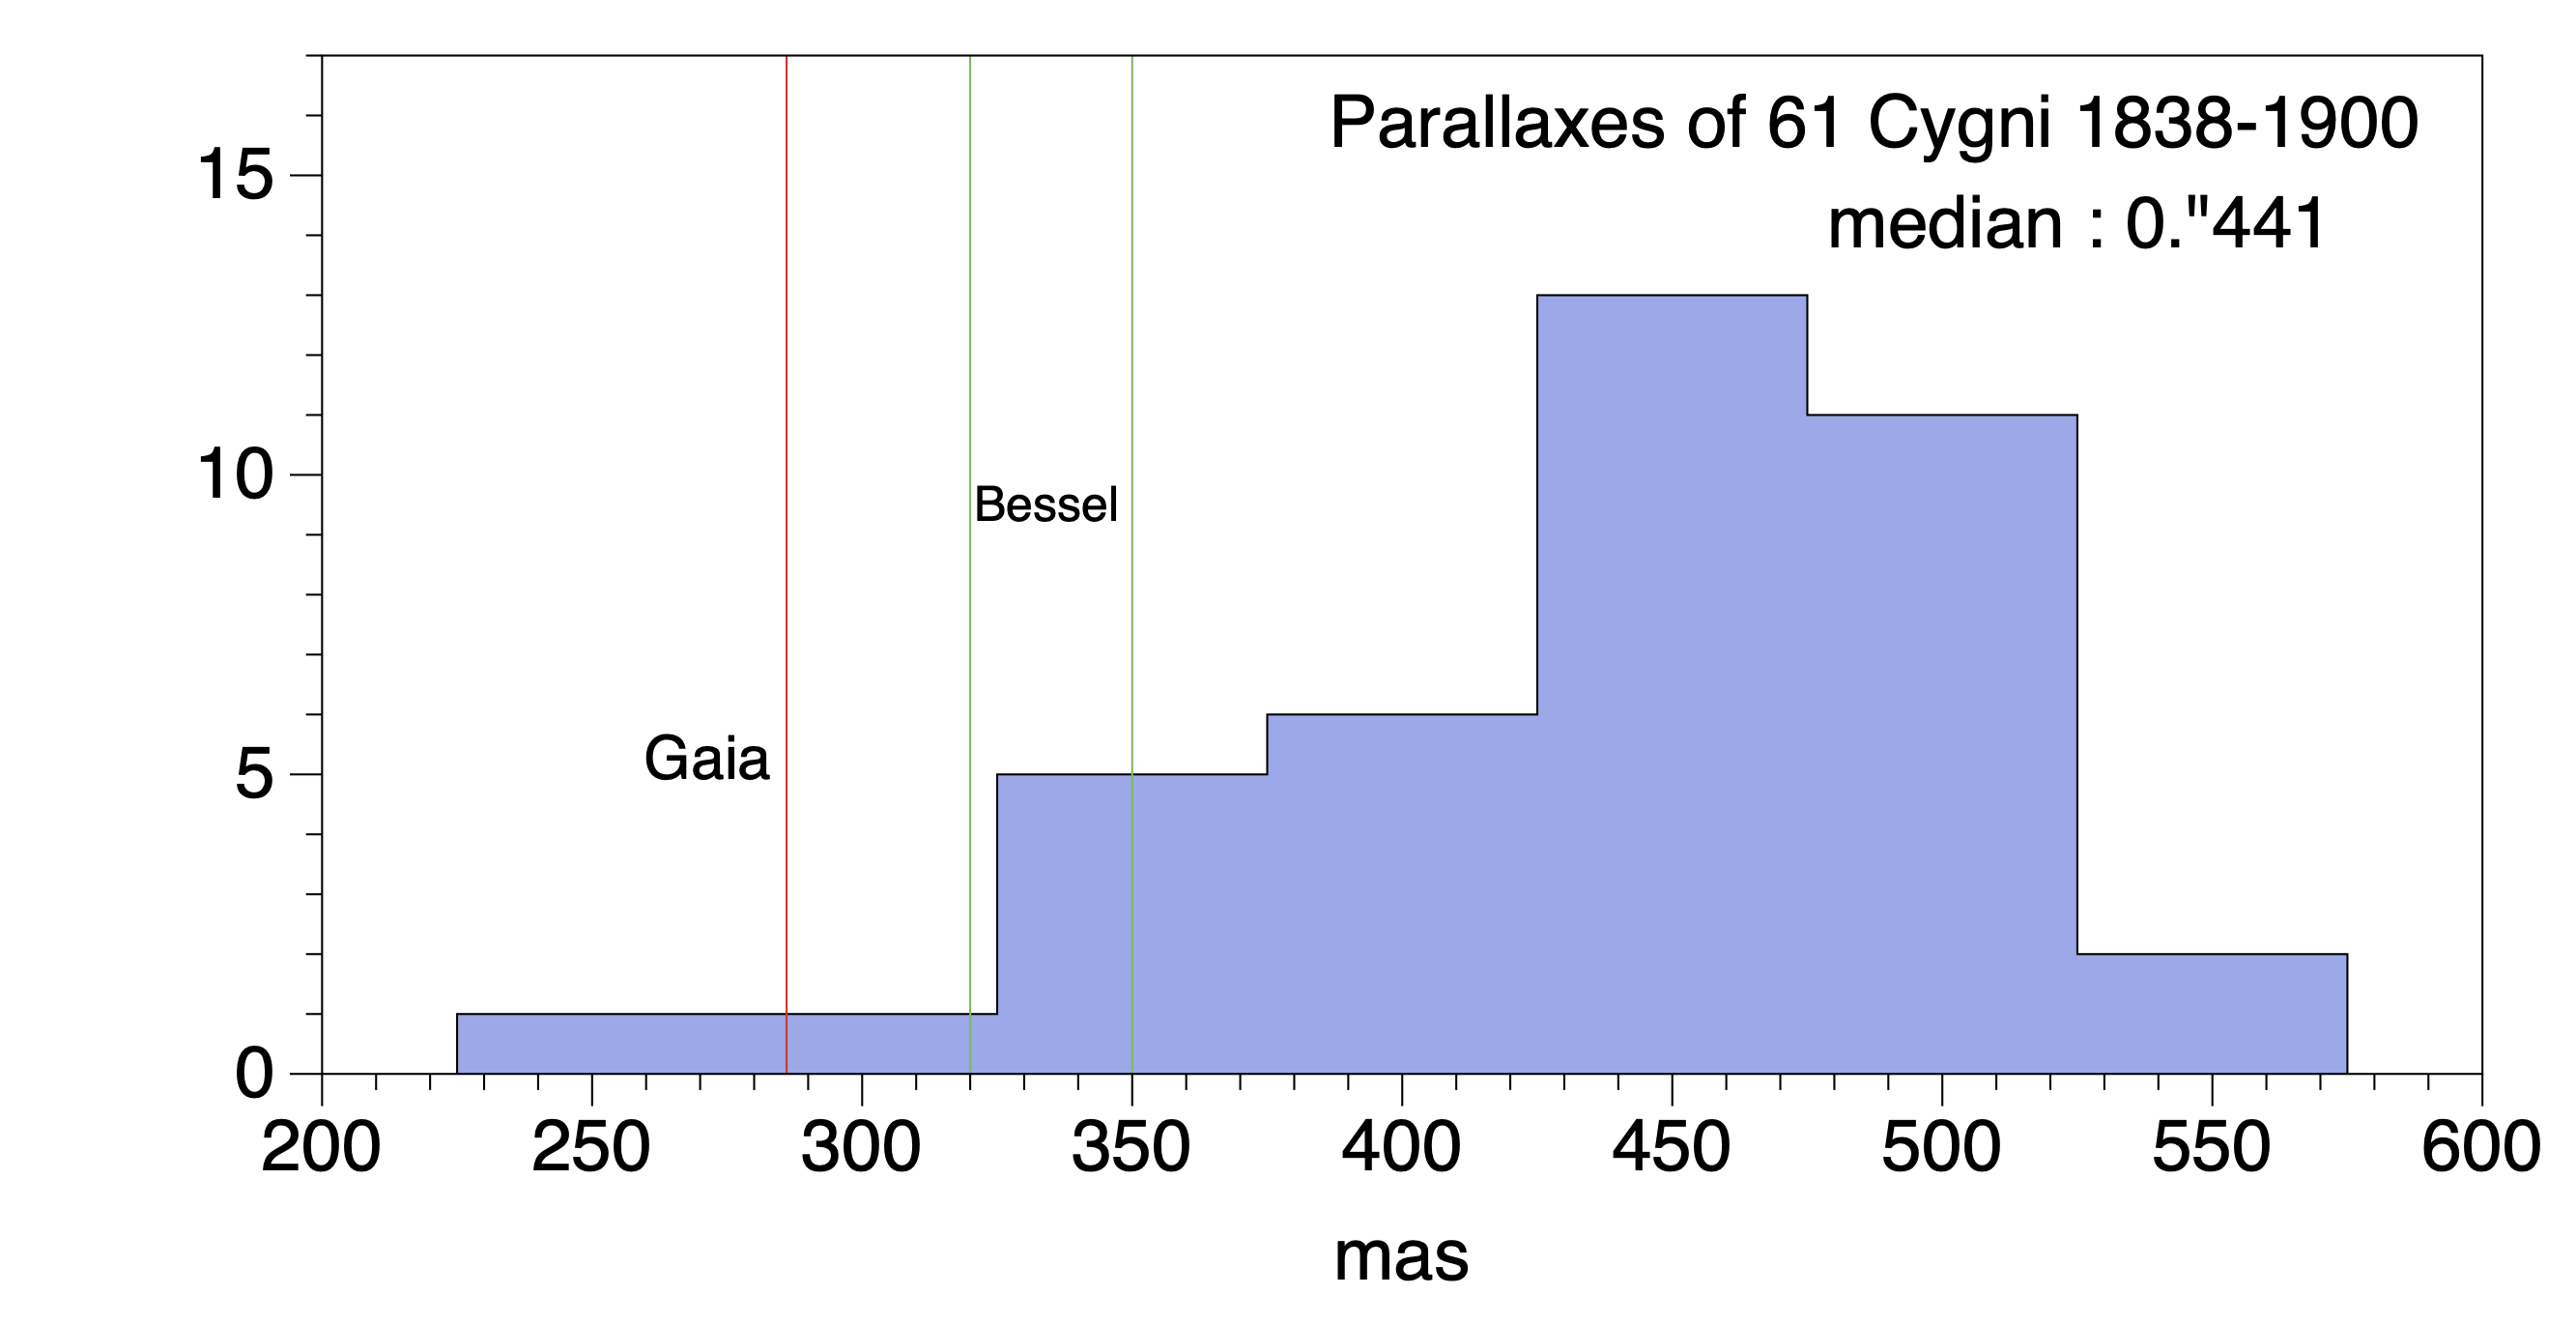
Figure 4. Results of about 40 determinations of the parallax of 61 Cygni by various methods before 1900, compiled by Ch. André in his book on stellar astronomy published a few years after. The scatter is quite large and the median of 0.44" farther from the truth than the Bessel seminal solution. André recommends this value as the best current estimate. Further parallaxes from photographic plates will bring this number down, closer to the true value. Despite all the attention given to these measurements, one sees how difficult it is to obtain a reliable parallax. Credits: François Mignard, based on data from Ch. André, Traite d'Astronomie Stellaire, vol I, 1899, Gauthiers-Villars.
With Hipparcos and Gaia, we have the current values as:
- Hipparcos_1 1996 287.1 ± 1.5 mas 61 Cygni A
Hipparcos_1 1996 285.4 ± 0.7 mas 61 Cygni B
- Hipparcos_2 2007 286.8 ± 6.0 mas 61 Cygni A
Hipparcos_2 2007 285.9 ± 0.6 mas 61 Cygni B
- Gaia DR2 2018 285.95 ± 0.10 mas 61 Cygni A
Gaia DR2 2018 286.15 ± 0.06 mas 61 Cygni B
- Gaia DR3 2021 285.995 ± 0.06 mas 61 Cygni A
Gaia DR3 2021 286.005 ± 0.03 mas 61 Cygni B
a very consistent set. New solutions will come out later with Gaia's fourth and fifth data releases. From the orbital motion (Figure 5) one knows that in 2015 the B component is closer to us than A by 60 au, wich translates into a parallax difference of 0.024 mas, smaller than the current uncertainty.
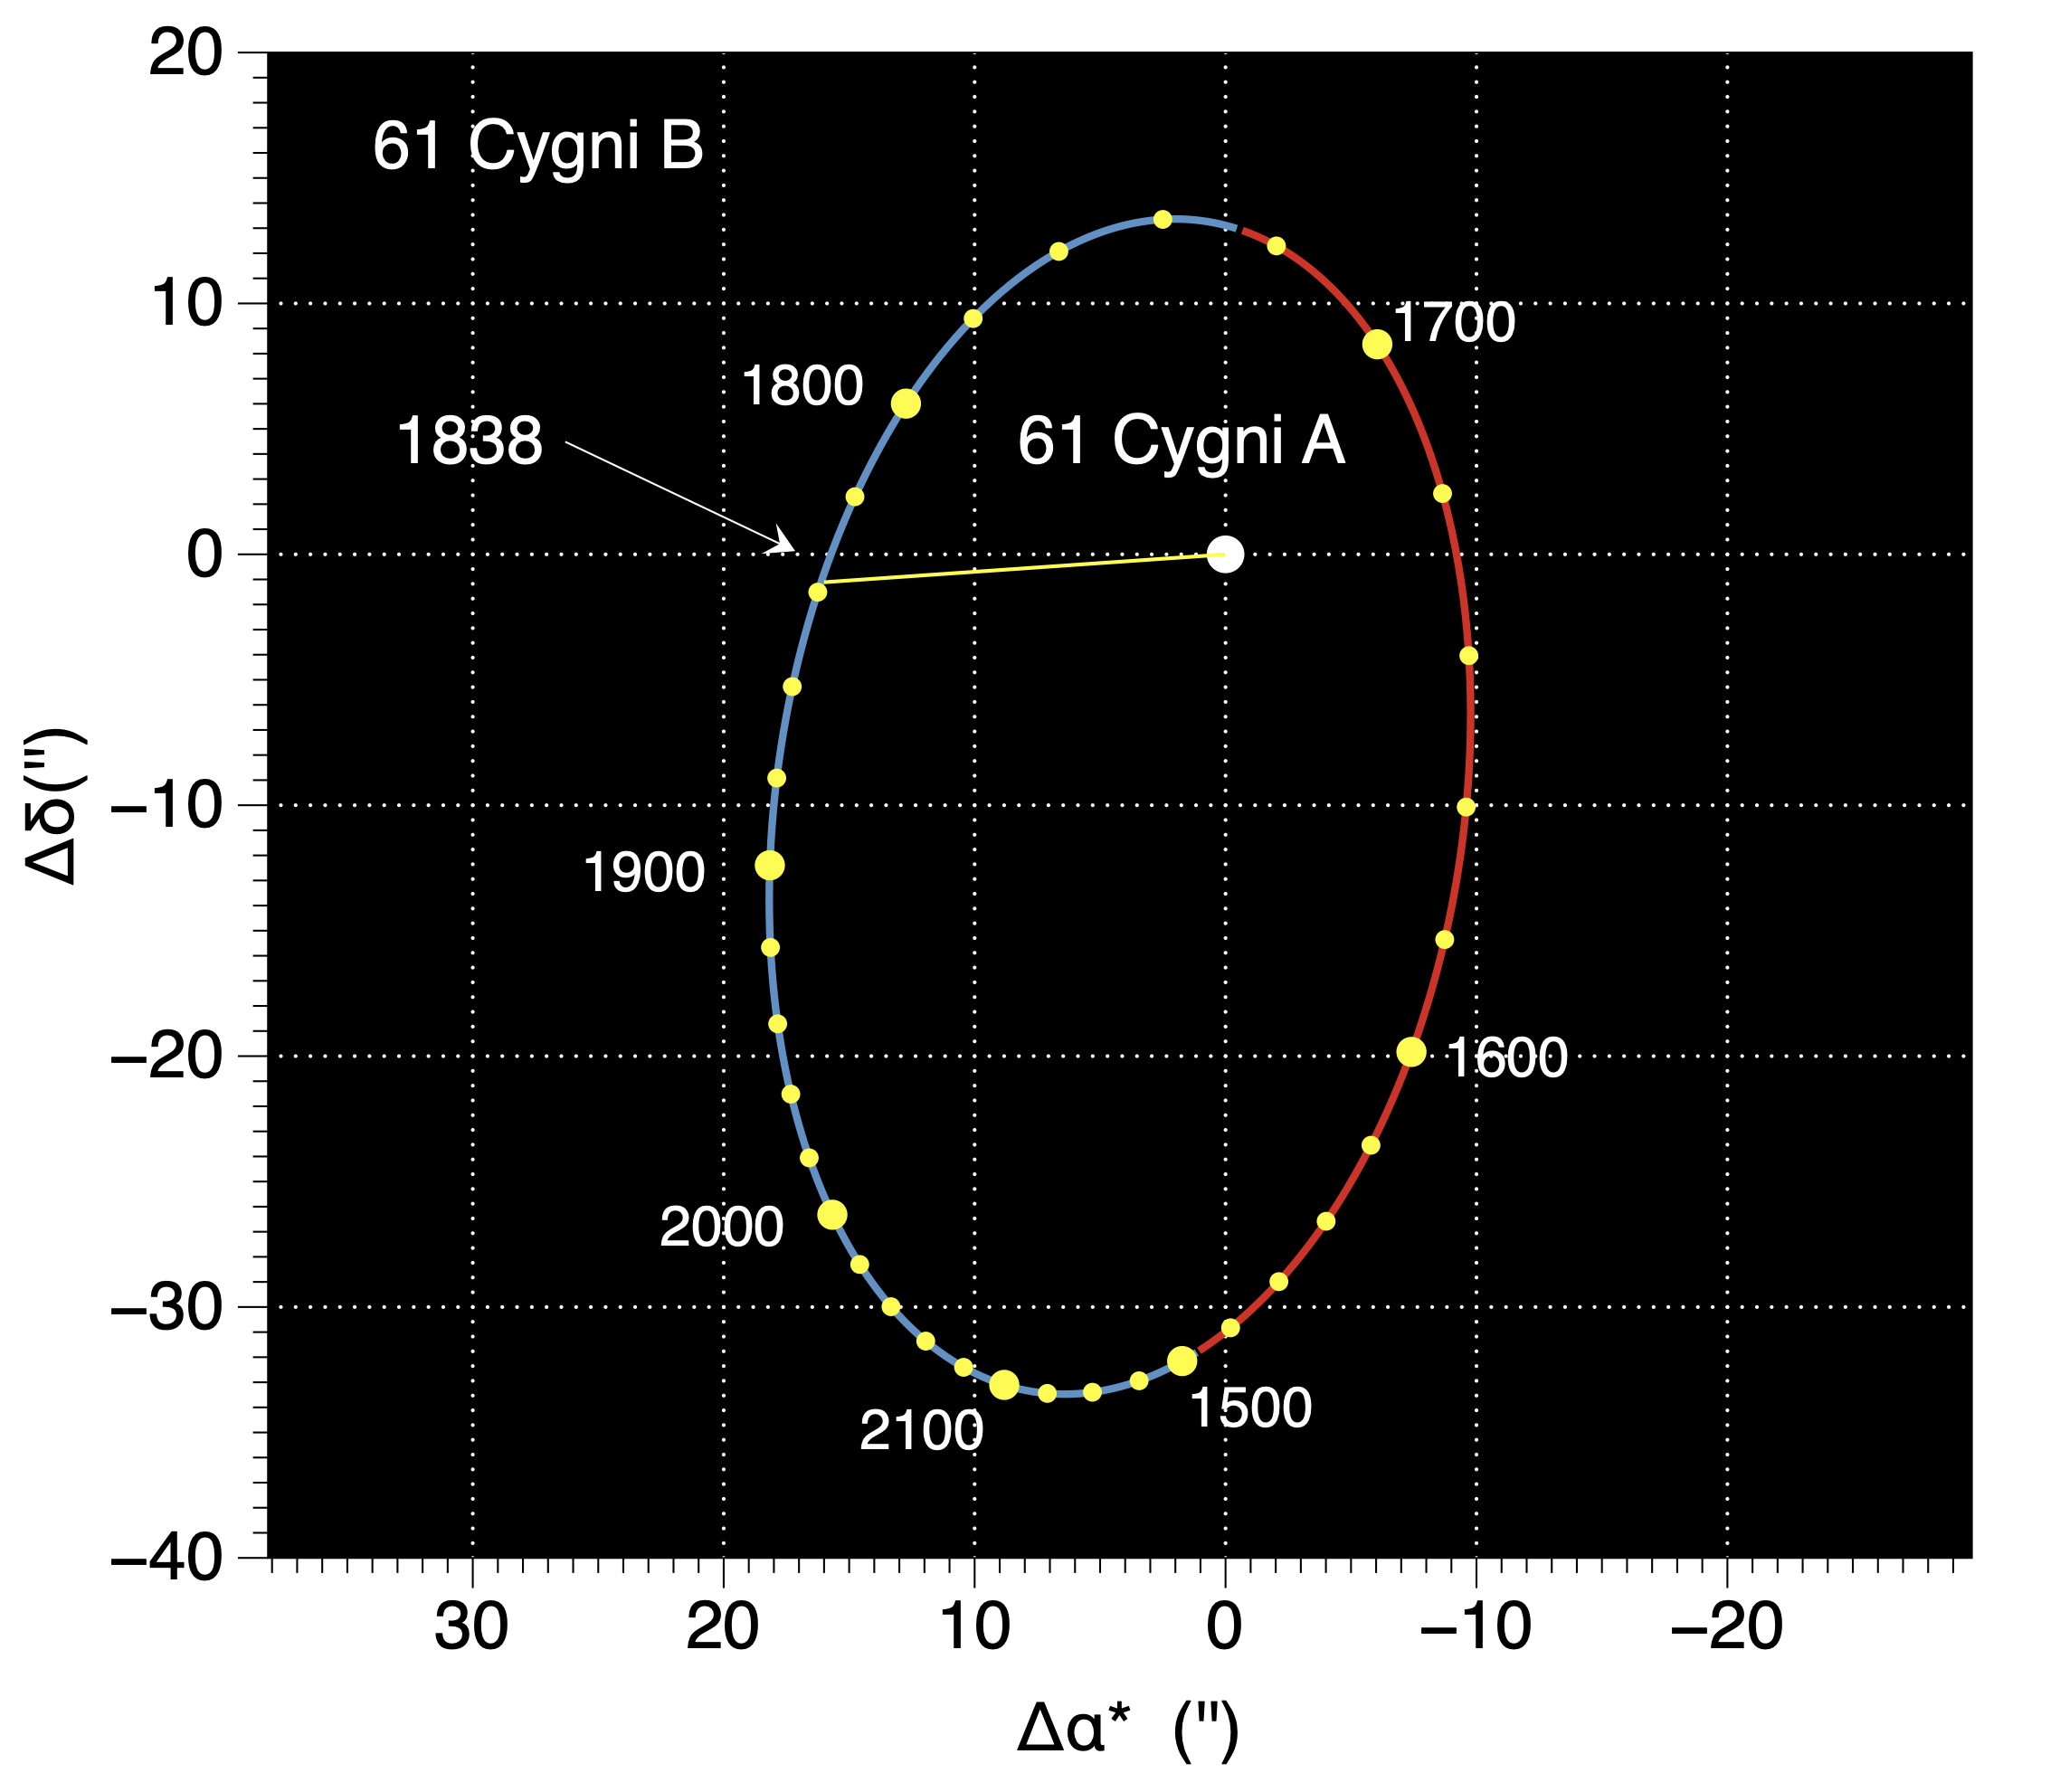
Figure 5. Apparent orbit of 61 Cygni B relative to A. In the red arc, 61 Cygni B is farther from us than A, and closer in the blue arc. The orbital period is just below 700 years and over the measurement interval 1838-1840, the orbital displacement is absorbed in the proper motion. With Gaia, the difference of proper motions between A and B agrees with the orbital motion around 2015. The difference of parallaxes between A and B is just below significance in Gaia DR3 to see the 60 astronomical units gap between the two components, but the sign is as expected. With Gaia DR5 this seems to be an achievable feat. Credits: ESA/Gaia/DPAC - CC BY-SA 3.0 IGO. Acknowledgement: François Mignard.
This video explains the concept of parallaxes and proper motions by making parallaxes and proper motion 100,000 times larger than in reality. The data shown here is from Gaia's data release 2. The computer program Gaia Sky, developed in Heidelberg, Germany, shows the sky as measured with the Hipparcos and Gaia spacecraft. Gaia measures the parallaxes (the apparent motion of the stars due to the annual movement of the Earth around the Sun and the finite distance of the stars) and the proper motions of the stars. At the end of the video it is shown how the stars would move on the sky if they were one trillion times faster than in reality. Credits: ESA/Gaia/DPAC - CC BY-SA 3.0 IGO. Acknowledgements: Stefan Jordan and Toni Sagristá with Gaia Sky.
Debate on attribution
Historians of astronomy are not all in agreement about whom should be credited as the first to achieve a trustworthy measurement of the distance to a star. The important word here is 'trustworthy', since results have been published well before Bessel, but all proved defective after careful examination. The most important in this respect was the long series of cautious absolute observations undertaken by John Brinkley at Dublin on the first magnitude stars, that led to years of acrimonious criticism from J. Pond, the then Astronomer Royal at Greenwich. From what is known now, we are left with three contenders: F.W. Bessel with 61 Cygni, F.G.W. Struve with Vega, and T. Henderson with alpha Centauri, whose results fortuitously came out almost simultaneously.
As early as 1837 Struve had estimated the parallax of Vega to 0.125", (the modern value is 0.130" from Hipparcos), but had little confidence in his result for various reasons and saw this as no more than a tentative result, needing to be confirmed by further observations, over a longer interval. This he did over the next two years to reach his final and published value in 1839 of 0.261±0.025". Such a large difference between the two values did not help keeping him in the front line among the contenders, let alone the publication date later than Bessel.
J. Henderson's case is more intricate. He was at the Royal Cape Observatory for one year only in 1832-1833, where he collected an impressive amount of astrometric observations, including meridian passages of alpha Centauri. Then appointed Astronomer Royal of Scotland, he delayed the reduction of his observations for five years and in the meantime learnt about the large proper motion of alpha Centauri, which combined with its rapid orbital motion made this star a first rate candidate to search for the parallax. This led to the lecture of a paper before the Royal Society in early 1839 announcing a significant parallax for alpha Centauri. But the absolute measurements were not particularly well designed for this purpose and the parallax concluded from the right ascensions was 0.70" whereas this was 1.46" from the declinations, that Henderson combined into 1.16±0.11" for the parallax of alpha Centauri.
His observations performed much earlier than Bessel's were the basis of claims of him being the first to detect a stellar parallax. Had he processed his raw data more quickly, the case could have been debated, but as it stands the publication came out after Bessel and the accuracy is not convincing enough for such a claim. Absolute measurements are too prone to systematic effects, albeit small, for such a tiny motion.
Publication date, clearness of the data analysis, dense time sampling and flawless residuals without outliers, give Bessel credit as the one who first delivered a reliable stellar parallax. Accuracy and lack of reservation in his result led to its immediate acceptance and eventually he had brought the answer to a quest started 150 years earlier. Struve and Henderson had achieved a parallax measurement but Bessel changed the course of history.
A historical coincidence
61 Cygni was also observed by George Mitchell Seabroke, an astronomer active in the United Kingdom, back in 1871. A total of 31 observations of the double star were made by him until 1908. These were published, later digitized, and now they are available from the Washington Double Star Catalogue. Little did he know that his great-great-grandson, George Seabroke, would join the Gaia collaboration and follow in his footsteps. The Gaia observation in Figure 1 is credited to the full Gaia collaboration, a team of over 400 scientists and engineers, responsible for the Gaia data processing and analysis, with as ultimate goal: the publication of the Gaia data releases.
Further reading
- Press release published by ESA on Gaia's end of observations: "Last starlight for ground-breaking Gaia" / Dutch / French / German / Italian / Spanish
- Find the most up to date Milky Way map, based on Gaia data from this page. The page contains an edge-on view, face-on view and an animation.
- University of Barcelona, Spain: Last starlight for ground-breaking Gaia / Última llum estel·lar per a la pionera missió Gaia (Catalan) /
Última luz estelar para la pionera misión Gaia (Spanish) - Institute of Space Studies of Catalonia (IEEC): Last starlight for the ground-breaking Gaia mission / Última llum estel·lar per a la pionera missió Gaia
- Institute de Ciències del Cosmos, University of Barcelona, Spain: Last starlight for ground-breaking Gaia
- University of Cambridge, United Kingdom: Last starlight for ground-breaking Gaia
- Media INAF, Italy: Il satellite Gaia va in pensione
- Observatoire Astronomique de Strasbourg (CDS), France: Dernière lumière stellaire pour gaia
- University di Vigo, Spain: A astrofísica Ana Ulla participa no procesamento de datos recompilados pola nave espacial Gaia tras completar a exploración da Vía Láctea
- Royal Observatory of Belgium: The gaia spacecraft is ending its life of observations but the harvest continues / French / Dutch
- Leicester University, United Kingdom: Leicester astronomer pays tribute to ground-breaking Gaia mission
Credits: ESA/Gaia/DPAC. Story written by François Mignard and Tineke Roegiers.
[Published: 15/01/2025]
- Removed a total of (6) style text-align:center;
- Removed a total of (3) style text-align:justify;
Stories by ESA Science and Technology

- Removed a total of (1) style text-align:center;
Image of the Week Archive
- Removed a total of (1) border attribute.
- Removed a total of (1) cellpadding attribute.
- Removed a total of (1) cellspacing attribute.